Dr. Mandavia Hitesh. C.
A-201 Asopalav springs, Satyasai Road ,Behind Atmiya College, Rajkot - 360005 Gujarat, India
Article Publishing History
Article Received on : 20 Mar 2013
Article Accepted on : 7 May 2013
Article Published : 01 Jan 2014
Plagiarism Check: Yes
Article Metrics
ABSTRACT:
The present paper reports the thermoluminescence characteristics of Feldspar, Alumina and Quartz minerals collected from the ceramic tiles manufacturing unit, Morbi. As the received minerals TL was recorded (NTL), and annealed and quenched from 500oC followed by 25Gy beta dose given from Sr-90 beta source TL was recorded and the comparative TL (Thermoluminescencs Study) study of above materials are presented and it represent some special characteristics of the materials.
KEYWORDS:
Natural Thermoluminescence;TL- Thermoluminescence;Minerals;Annealed and Quenched
Copy the following to cite this article:
Mandavia H. C. Thermoluminescence Study of Minerals: Quartz, Feldspar and Alumina. MSRI;10(2)
|
Introduction
Many natural mineral are used to manufacture floor tiles for household floorings. The demand of a variety of flooring materials has lead to develop various types of ceramic tiles. In India the ceramic industry is one of the fastest growing industries, more then 200 manufacturing units of ceramic tiles, vitrified tiles and sanitary wares are situated at Morbi (Rajkot District, Gujarat state, India). Many natural minerals are used as the raw materials for the manufacturing ceramic wares. The minerals used in manufacturing the ceramic tiles are Quartz, Feldspar, Zircon, Talc, Frit-O, Frit-T, Aluminium oxide, Sodium trypoly phosphate China clay, Bikaner clay, etc. Most of the minerals are from mines in Gujarat and few are from Rajasthan state and imported from Russia. The phenomenon of TL has been studied by many investigators. The thermoluminescence (TL) study in geology, particularly for natural minerals, is an important research tool. The TL study of minerals commonly used in ceramic tiles industry, such materials gives better understanding about their properties and characteristics. The systematic study of TL of such minerals is helpful to solve the basic raw materials quality problem the ceramic tiles industries.
Experimental Method
The natural minerals used in manufacturing ceramic tiles are collected from the ceramic tiles industry. Most of the materials used for the TL analysis were indigenous ones and a few were imported minerals. First make a fine powder of such mineral and then 5mg powder of each materials are taken and placed this powder between circular ring and then put Sr 90 Beta source on it for five minut for irradiation. The source capacity is 500rad./min, after irradiation the sample is collected from the circular ring and placed into the TL(Thermoluminescence)reader. TL of these minerals was recorded using TL set-up supplied by Nucleonix Systems, Hyderabad. Irradiation was carried using Sr-90 beta source. Equal quantities of samples (5 mg) were used for the analysis.
Results and Discussion
TL Study of Quartz
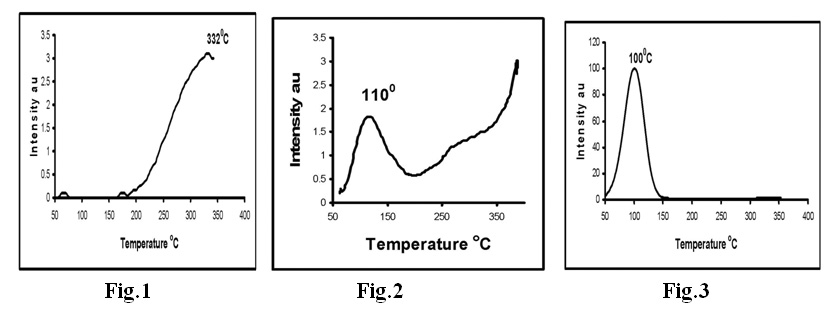
Fig 1 is the TL of 5mg of weighed powder was taken to record TL glow curve of Quartz (NTL) without any pre heat treatment and irradiation. The glow curve exhibit one hump like glow peak at temperature at 3320C. There is no good TL is observed.
Fig.2 shows TL glow curve of Quartz irradiated with beta dose of 25 Gy using Sr90. Here one peak occurs at temperature 1100Cand intensity of 1.83au here little TL is recorded. It is noted that after irradiation one trap developed and released carrier during the TL measurement.
Fig. 3 is the TL glow curve of Quartz annealed and quenched from 5000C and given a beta dose of 25 Gy using Sr-9o beta source. TL glow curve of 500oC AQ sample of Quartz exhibits one well resolved and isolated TL peak with high intensity around 100oC. This peak is interesting TL peak in dosimetric point of view.
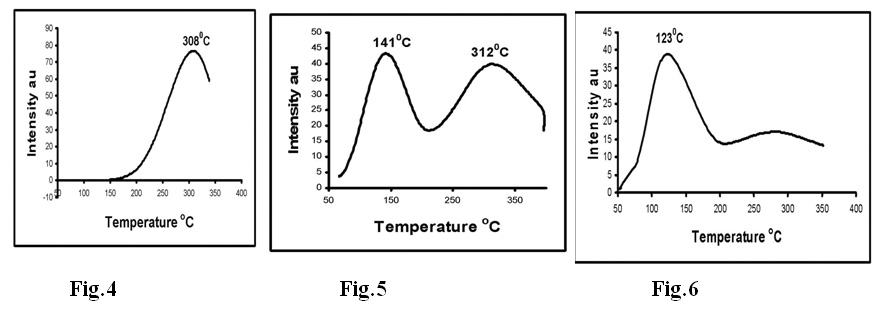
Fig. 4 shows the TL glow curve of Feldspar mineral with out any pre heat treatment and irradiation .The glow curve exhibits one well resolved peak at 3080C temperature ,here heating rate is 4Oc/sec for TL measurement the intensity of peak is 76au noted this intensity is remarkable this sample gives TL without any pre heat treatment this result is interesting here phase changed thrmoluminescence is occurs,some mineral contain water molecule due to this result the phase change TL produced. Here till temperature 1700C the intensity remain near to zero but then after intensity continuously increasing with temperature .From this result it is noted that one trap with large numbers of carriers generated with peak 3080C.
Fig 5 shows the TL glow curve of Feldspar mineral irradiated with beta dose of 25 Gy by Sr90here no any pre heat treatment is given to the sample, here two well resolved glow peak occurs at temperature 1410C and 3120C it is indicate that two traps with large carriers is related with this temperature range here the intensity of peak is 43au and 39au respectively, here it is noted that the intensity of peak 3090C in in fig.4 is decreased in fig.5 and the peak temperature slightly change from 3090C to 3120C it shows fading effect but one remarkable result is that one new peak occurs at temperature 1410C with intensity 43au this peak is well resolved and stable so it is considered as dosimetric peak.
Fig. 6 shows the TL glow curve of Feldspar mineral with pre heated at annealing and quenching temperature at 5000C and irradiated with beta radiation dose of 25 Gy by Sr 90 here heating rate is 4Oc/s for TL measurement here one well resolved glow peak occurs at temperature 1230C and peak intensity of 39au is recorded, with comparison of fig. 5 it is clear that peak temperature almost remain same but the peak intensity is decreased about 40%, this interesting this shows the fading effect occurs between temperature range of 2000C to 5000C into the material also broad hump is produced in the glow curve.
TL Study of Alumina
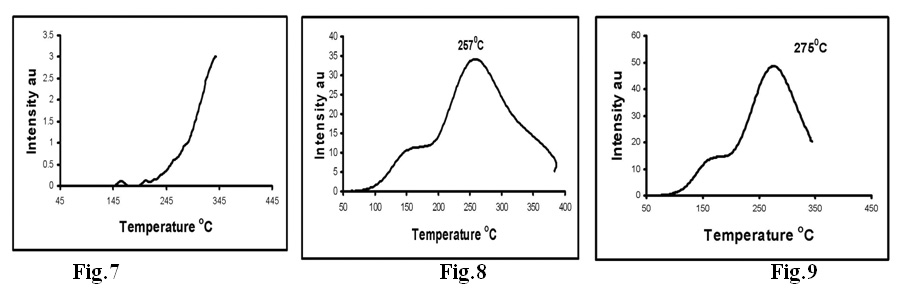
Fig.7 shows TL glow curve of Alumina without treatment of heat and irradiation dose. This glow curve exhibits one peak at temperature 1590C and intensity of 0.11au here no significant TL is recorded, the material exhibits low TL sensitivity in natural form.
Fig.8 shows TL glow curve of Alumina with irradiated with beta dose of 25Gy by Sr90 .The glow curve exhibits one peak at temperature 2570C and with intensity of 34au, here it is noted that after irradiation the intensity of TL is increased it is means that that large carriers oriented trap is generated .
Fig.9 shows the glow curve of Alumina treated with annealing and quenching temperature of 4000C and irradiated with beta source of 25Gy .here glow curve exhibits one well resolved peak at temperature 2750C and intensity of 48au also one broad hump is developed. It compare with fig.8 the intensity is increased from 19au to 48au it is noted that after the treatment of AQ5000C more carriers oriented trap is formed and it released it when it heated for TL measurement. The heating rate for TL is 4Oc/s. The peak 2750C is conceder as stable peak it indicate stability of material also this peak is interesting for dosimetric point of view.
Conclusion
From the TL studies of subjected minerals clearly indicate TL peak observed in glow curve is due to the traps form by irradiation and heat treatment all the studied minerals are radiation sensitive and observed peaks are important for the dosimetry study. The systemic study may be more useful in checking the purity of the raw materials which improving the quality of ceramic tiles in ceramic industries. Further studies are in progress.
References
- Murthy K.V.R. and Reddy J.N., Thermoluminescence basic theory application and experiment , Pub. Nucleonix, Hyderabad. (2008)
- Murthy K.V.R. , Patel Y.S. , Sai Prasad A.S., Natarajan V. , Page A.G. , Radiation Measurements, 36 483, (2003)
CrossRef
- Murthy K.V.R., Pallavi S.P., Ghildiyal R., Parmar M.C. , Patel Y.S. , Ravi Kuma V., Sai Prasad A.S., Natarajan V., Page A.G. Radiation Prot. Dosim., 120 238 (2006)
CrossRef
- Murthy K.V.R., Pallavi S.P., Ghildiyal R., Patel Y.S. , Elangovan D., Radiation Prot. Dosim.,119 350 (2006)
CrossRef
- Mckeever S.W.S. , Thermoluminescence of Solids, Cambridge University Press, Cambridge, 205 (1985)
- Blasse , Luminescent Materials, Springer, Berlin , 93 (1994)
- Aitken M. J. , Physics and Archaeology) Oxford, U.K.: Oxford Univ. Press. (1974)
- McKeever S.W.S. , Akselrod M. S. and Markey B. G. , Radiation .Prot. Dosim., 65 267 (1996)
CrossRef
- Kumar S., Source Book of Ceramic, (1998)i
- H.C.Mandavia and Murthy K.V.R International Journal of Luminescence and application volume-2,15 (2012)
- H.C.Mandavia and R.U.Purohit,Material science an Indian Journal,Volume-6, Issue-3,167-169 (2010)

This work is licensed under a Creative Commons Attribution 4.0 International License.