Synthesis and characterization of Co(II) Cu(II) Zn(III) and La(II) complexes of standard antidiabetic drugs
INTRODUCTION
Glimeperide, is abi-substituted urea derivatives can exist in keto andenolic form when dissolved in an organic solvent and react with various metal ions to form intensely coloured metal complexes that provide the basis for their use as a sensitive reagent.
The thermal degradation study of complexes has become a subject of recent interest. It is important property of complexes, which decides the thermal stability and processability of the complexes. The study of thermal behaviour of complexes in air at different temperature provides important information about its practical applicability.
Iqbal S.A.et.a1l.,
(2005) synthesized the metal complexes of glimeperide characterized by FTIR, elemental analysis and TGA-DTG parameters. The thermal analysis (TGA) was performed at the heating rate of 10°C/min. in nitrogen atmosphere.
Wilma Cyrilet.al2.,
(2011)studied kinetics and Thermal decomposition of Cu(II) complex of of hydroxyl quinoline-5-sulphonic acid
Thermal data have been analyzed by Freeman Carroll and Sharp-Wentworth method.
Thermal analysis (TGA and DTG) is a typical analytical technique to describe the relationship between physico-chemical changes and temperature.1-2 In order to synthesize complexes having practical applications. There is a need to investigate the effect of heat on complexes in order to establish thermal stability.
Iqbal and co-workers3-4
havesynthesized and characterized complexes of tolbutamide and glimeperide by FTIR, elemental analysis and TGA-DTA technique.
Thermal studies of complexes were carried out to determine their mode of decomposition, the activation energy (Ea), order of reaction (n), frequency factor(Z), entropy change (S), Free energy (ΔF) and apparent entropy change (*S). Thermal decomposition curves were discussed with careful attention of minute details. The freeman Carroll and Sharp-Wentworth methods have been used to calculate thermal activation energy and thermal stability.
However, very little work has been carried out on the synthesis and characterization and thermal degradation studies of the metal complexes of glimeperide.
Hence in this work we prepare complexes of Cu(II), Co(II), Zn(II) and La(II) transition and inner transition metals with glimeperide drug molecule. The solid complexes were characterized using different physico-chemical methods, like elemental analysis (C,H,N,S and metal content), IR and thermal analysis (TGA and DTG)
EXPERIMENTAL
2.1 MATERIALS AND REAGENTS
All chemicals used were of analytical reagent grade (A.R.) and of highest purity. They included glimeperide (Zim laboratories, Nagpur), Copper(II) Chloride ,Zinc(II) chloride,Cobalt(II) chloride andLanthanum(II) Chloride heptahydrate (Hi media Lab, Mumbai) organic solvents used absolute ethyl alcohol, DMF. These solvents were spectroscopic pure from BDH, hydrogen peroxide, hydrochloric and nitric acid (E.Merck) were used.De-ionized water was used in all preparations.
2.2 INSTRUMENTS
Molar conductance of solid complexes in DMF was measured using Systronics conductivity meter, elemental microanalyses of the isolated solid complexes for C,H,N were performed at CDRI, Lucknow, using (HMS-932CLECO) Vario elemental analyzers. Infrared spectra were recorded on Perkin-Elmer, FTIR type 1650 spectrophotometer in wave number 400-4000 cm-1. The spectra were recorded as KBr pellets.
The thermogravimetric (TG and DTG) analysis was carried out in dynamic nitrogen atmosphere (20 ml.min-1) with a heating rate of 10°C/min. using shimatzu TGA-50H Thermal Analyzer at IIT Bombay (Mumbai) Electronic spectra recorded at Qualichem Laboratory, Nagpur.
2.3 SYNTHESIS OF METAL COMPLEXES
Metal complexes are synthesized by adding metal salt solution in appropriate solvent to the solution of the ligand. The mixture was refluxed for 3-4 hours. Then the precipitate of metal complexes was obtained. It was filtered, washed and dried in vacuum desiccators.
All selected metals forms 1:2 complexes with glimeperide, were confirmed by Jobs method of continuous variation5as modified by Turner and Anderson6.
2.4 ESTIMATION OF METALSIN COMPLEXES
An accurately weighed portion of the different complexes ranged from 10 to 30 mg was placed in Kjeldhal flask. A measured volume of concentrated nitric acid ranged from 5 to 10 ml was added initially to the powdered complexes to start the fast wet oxidation digestion. This mixture had been digested with some drops of H2O2 solution using a gradual heating. This treatment was conducted until most of the powdered complexes were dissolved and the remaining solution had the colour of the corresponding metal salt. This solution was then diluted upto a 50 ml. with distilled water and the metal content was determined by titration against standard EDTA solution at a suitable pH value using the suitable indicator.
RESULTS AND DISCUSSION
3.1 COMPOSITION AND STRUCTURES OF METAL COMPLEXES.
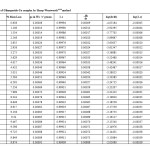
The isolated solid complexes of Cu(II), Co(II), Zn(II) and La(II) with GLM ligands were subjected to elemental analysis (C, H, N, S. and metal content), I.R., Molar conductance, thermal analysis (TG and DTG) to support the tentative structure. The results of elemental analysis listed in table (1) suggest the formulae [Co(GLM)2]2H2O, [Cu(GLM)2],[Zn(GLM)2], and [La(GLM)2]2H2O for respective complexes.
3.2 MOLAR CONDUCTANCE
The complexes were dissolved in DMF and the molar conductivities of 10-3M of their solutions at 298 K are measured. It is concluded from results listed in table (1) that the complexes are found to have molar conductance values of 13.18 to 30.15Ω-1 mole-1 am-2 indicating that all the metal complexes are non-electrolytes.
3.4 ELECTRONIC SPECTRAL STUDIES
Electronic spectra of the ligand shows two high intensity bands at 47431 and 32233 cm-1,indicating n n*and transitions respectively of the ligand moity.The electronic spectra of La(II) complex displays band at 32130 and 27393cm-1 The two bands corresponds to 4T1g 4A2g(F), 4T1g 4A1g(P) suggesting octahedral geometry of these complexes. The Cu(II) complex displays a band at 26130cm-14E1g 4T2g(F),Zn(II) complex displays single absorption band at 31225cm-1.This is due to Ligand Metal charge transfer spectra..
3.3 IR SPECTRAL STUDIES
The IR data of the spectra of GLM ligand and there complexes are listed in table (4). The IR spectra of the complexes are compared with those of the freeGLM ligands in order to determine the coordination sites that may be involved in complexation7-15 The tautomeric equilibrium depends on the extent of conjugation, nature and position of the substituent, polarity of the solvent etc
3.5 MAGNETIC SUSCEPTIBILITY STUDIES
The roomtemperature magnetic moment of the complexes was found to be 4.66 B.M. which corresponds to the presence of Co(II), La(II) in octahedral geometry. Zayed et al16., (2000)Cotton et.a17., (1999)
In addition to that, the Cu(II), and Zn(II) complexesare found to have magnetic moment value of 4.62 B.M.and 4.72B.M.respectively which indicates the presence of Cu(II) and Zn(II) complexeshave tetrahedral structure.
3.6 THERMAL ANALYSIS (TGA AND DTG)
In the present investigation, the weight losses for each complex were calculated within corresponding temperature ranges. The obtained data are listed in table (4). All complexes are thermally decomposed in three decomposition steps within the temperature range of 50-600°C .The TGA/DTA data for the complexes are shown in Table-1,2 and 5
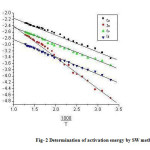
The thermoanalytical data are presented in table 1,2 and 5. In studying the decomposition kinetics18-26, three methods mentioned in the literature were used in each case the least square plots were drawn. The first few points that did not fall on straight line were discarded. These types of deviations of points are reported in literature by several research workers. This is explained as due to the failure of obeying as first order kinetics always by the solids in their decomposition in the early stages fig-1 and 2..
Theoretical Consideration
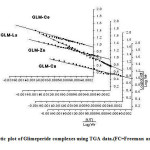
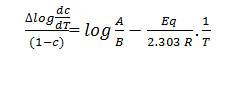
To provide further evidence regarding the degradation system of analyzed compounds we derived the TG curves by applying an analyticalmethod proposed by Freeman-Carroll27-28 and Sharp-Wentworth29-30.
Freeman-Carroll Method26-27
The straight line equation derived by Freeman and Carroll, which is in the form of
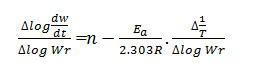
Where rate of change of weight with time

Wr = Wc-W
Wc = Wt. loss at completion of reaction
W = Total wt. loss upto time ‘t’
Ea = Energy of activation
n = Order of reaction
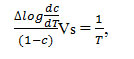
The plot between the term
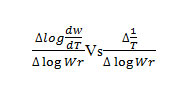
gives a straight line from which slope can be calculated, also we obtained energy of activation (Ea) and intercept on Y-axis as order of reaction (n). The change in entropy (ΔS), frequency factor (Z), apparent entropy (S*) can also be calculated by further calculation.
Sharp-Wentworth Method28-29
Using the equation derived by Sharp and Wentworth
Rate of change of fraction of weight with change in temperature. β = Linear heating rate

by plotting the graph between
We obtained the straight line which gives energy of activation (Ea) from its slope.
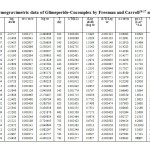
The thermodynamic activation parameters of decomposition process of dehydrate complexes namely activation energy (Ea), enthalpy (ΔH), Entropy (ΔS) and Gibb’s free energy change of decomposition (ΔG°) are evaluated graphically by employing Free man-Carroll and Sharp-Wentworth relation. The data are summarized in Table 1,2,5.The activation energies of decomposition are found to be in the range 29.70 to 204.7 KJ.Mole-1. The high value of activation energies reflect the thermal stability of complexes. The entropy of activation is found to have negative values in all the complexes which indicate that decomposition reactions process with lower rate than the normal ones31-
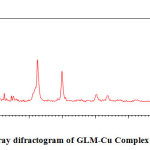
a(Å) = 21.5867 Volume(abc)Å = 14060.360
b(Å) = 23.5386 Dcal. = 5.38736 g/cm3
c(Å) = 27.6713 Dobs. = 5.38524 g/cm3
Standard deviation = 0.027% Crystal system = Orthorhombic
α=90°, β=90°, λ=90° Porosity(%) = 0.03935
Density = 0.074306g/cm3 Particle size = 15.5602microns
Space group = Pm
|
2θ
|
I/I0
|
D(Obs)
|
D(Cal)
|
h
|
k
|
l
|
|
12.7240
|
21.84
|
6.95731
|
6.96397
|
25
|
3
|
0
|
|
16.4612
|
100.00
|
5.38524
|
5.38736
|
0
|
1
|
5
|
|
17.7016
|
16.05
|
5.01057
|
5.00820
|
0
|
2
|
5
|
|
19.8348
|
2.59
|
4.47624
|
4.48231
|
0
|
4
|
4
|
|
20.8349
|
5.00
|
4.26360
|
4.26359
|
2
|
5
|
1
|
|
22.5976
|
9.06
|
3.93484
|
3.93691
|
4
|
4
|
1
|
|
25.3489
|
5.04
|
3.51367
|
3.51709
|
3
|
4
|
5
|
|
32.5464
|
46.93
|
2.75121
|
2.74909
|
-3
|
2
|
9
|
|
39.8827
|
35.12
|
2.26043
|
2.26123
|
0
|
6
|
10
|
|
50.4146
|
7.61
|
1.81016
|
1.81016
|
6
|
2
|
13
|
|
53.8220
|
5.99
|
1.70192
|
1.70195
|
3
|
13
|
4
|
TABLE-(3-ANALYTICAL DATA OF GLIMEPERIDE COMPLEXES
|
Sl. No.
|
Molecular formula of complexes
|
Molecular weight
(gm/mol)
|
% Analysis found (calculated)
|
|
C
|
H
|
N
|
O
|
S
|
Metal
|
H2O
|
|
1
|
(C24H34N4O5S)2Co·2H2O
|
1076.164
|
53.18
(53.52)
|
6.18
(6.13)
|
10.38
(10.40)
|
17.82
(17.84)
|
5.84
(5.94)
|
5.37
(5.47)
|
3.54
(3.34)
|
|
2
|
(C24H34N4O5S)2Cu
|
1044.774
|
55.14
(55.13)
|
6.18
(6.31)
|
10.78
(10.72)
|
18.30
(18.37)
|
6.52
(6.12)
|
6.00
(6.08)
|
–
|
|
3.
|
(C24H34N4O5S)2Zn
|
1044.604
|
55.10
(55.14)
|
6.18
(6.31)
|
10.82
(10.72)
|
18.48
(18.38)
|
6.28
(6.12)
|
6.82
(6.06)
|
–
|
|
4.
|
(C24H34N4O5S)2La·2H2O
|
1156.144
|
48.88
(49.82)
|
2.82
(5.70)
|
9.66
(9.68)
|
16.80
(16.60)
|
5.62
(5.53)
|
11.98
(12.01)
|
3.28
(3.11)
|
TABLE (4): I.R. SPECTRA (4000-400cm-1) OF THE GLM AND THEIR METAL COMPLEXES
|
Compounds
|
γ (OH) Enolic
|
γ (NH)
|
γ (SO2) Asym
|
γ (SO2) Sym
|
γ (C=O) Amide
|
γ (m-O)
|
|
(C24H34N4O5S)2Co·2H2O
|
3100-3320 Br.
|
–
|
1375 sh.
|
1100 sh.
|
1460 sh.
|
530 m.
|
|
(C24H34N4O5S)2Cu
|
3220-3320 br.
|
3100 br.
|
1365 sh.
|
1120 sh.
|
1481 sh.
|
|
|
(C24H34N4O5S)2Zn
|
3220-3363 br.
|
3024 br.
|
1340.8 m.
|
1160.6 sh.
|
1481 sh.
|
|
|
(C24H34N4O5S)2La·2H2O
|
3280-3310
|
–
|
1305 sh.
|
1160 w.
|
1480 sh.
|
577 m.-
|
Table (5): Thermogravimetric data of Metal complexes of GLM drugs with corresponding to heating rate of 10°C/min.
|
Complexes
|
Decomposition Temp. (°C)
|
%Wt. loss
|
Ea(Kj/mole)
|
ΔS*
(Kj/mole)
|
ΔF
(Kj/mole)
|
Z
|
S*
|
n
|
|
F.C.
|
W.W.
|
|
[CC
(C15H20N3O3S)2Cu
|
30-150
150-350
350-510
|
9.926
58.408
65.68
|
32.87
51.21
110.30
|
31.37
51.01
109.23
|
-28.85
-64.65
-112.5
|
-8.708
-27.29569
-69.9772
|
281.2
269.8
252.7
|
-44.2681
|
0.9
|
|
(C15H20N3O3S)2Co.2H2O
|
30-150
150-350
350-510
|
5.815
51.027
69.718
|
33.67
55.14
109.37
|
32.66
54.38
108.38
|
-33.98
-82.07
-116.8
|
-10.26227
-34.66047
-72.65703
|
322.8
268.3
252.3
|
-48.5380
|
1.01
|
|
(C23H27O5ClN3S)2Zn
|
30-150
150-350
350-510
|
10.413
58.409
65.042
|
29.77
67.76
114.2
|
28.68
66.14
113.92
|
-24.59
-67.76
-116.50
|
-7.421
-29.94992
-72.4653
|
284.3
263.0
252.0
|
-43.2123
|
0.98
|
|
(C24H33N4O6S)2La
|
30-150
150-350
350-510
|
2.577
61.536
81.344
|
52.66
85.94
138.23
|
52.16
85.13
138.14
|
-43.48
-82.05
-102.2
|
-13.12178
-39.54421
-43.09237
|
269.2
269.2
257.6
|
-44.2381
|
0.99
|
Discussion
The complexes of Cu,Zn,La and Co were synthesized with oral hypoglycemic agents i.e. glimeperide the formulae suggested for the complexes are well supported by the Jobs method of continuous variation as modified by Turner and Anderson,moreover,the formulae of the complexes further gets supports from the analytical data.
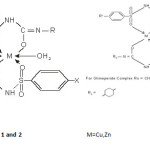
The structure of the complexes are supported from variety of spectroscopic techniquelike I.R,Electronic spectra,TGAmethod whose results are summarized in Tables-3,4,5. All the complexes prove to be formed in2:1 ligand metal ratio The complexes are formed after enolisation of the drugs which is indicative by the presence of only metal oxygen bonds and not the metal nitrogen. The Cu and Zn complexes shows tetrahedral structures while La and Co complexes shows octahedral structures in which the six co-ordination is fulfilled by two water molecule in which the oxygen of the water is vertically joining to the metal atom, above and below the plane of the molecule.
Thus on the bases of analytical data and spectroscopic studies the following structure-1 and 2 may be assign for the Cu,Zn and La, Co complexes respectively.
CONCLUSION
As the reported metal complexes of Glimeperide drugs are able to dissociate at stomach pH, therefore its dosages, to be given to subject animals should be such that it should not be dissociate in stomach i.e. at pH 1.2 for this complexes prepared enteric coated to make at the drug bioavailable as it is, i.e. at duodenum and small intestinal pH (5.5 to 6.8 pH)
Drug is coated with a polymer HPMC-5CPS (Hydroxy propylmethyl cellulose) which does not permit drug to dissolve in stomach (i.e. pH 1.2) and such polymer dissolves rapidly at deodenal pH (5 – 5.5) thus drug releases at 5.5 pH and is available for absorption. At this pH complex is stable, non-dissociatable and absorbable. Therefore dosage forms for animals study is prepared as enteric coated, polymerized in this dosage forms are not soluble at pH 12. This drug delivery system is adopted for further study36
The hypoglycemic effects Glimeperide the well known sulphonyl ureas, were inverstigated on the blood sugar levels of male albino rats by using Folin Wu method.37 . Analysis of data show that thisdrugs caused a marked decrease in blood sugar level to the extent while their complexes reduced the blood sugar level to than the parent drug.
This blood sugar lowering effect of sulphonyl ureas seems to be related to the stimulation of insulin secretion on the other hand, many studies have strongly indicated the presence of long term or extra pancreatic action of sulphonyl ureas38. The hypoglycemic activity of sulphonyl ureas may also be attributed to the stimulation of glycolysis and to the inhibition of glycogenesis in the liver by itself or by enhancing insulin action39.
On comparing the hypoglycemic effect of these complxes with their parent drugs, it was revealed that in the three groups Glimeperide-Zn(II) treated albino rat had lowest blood sugar level being 49.72 mg/100 ml. respectively on an average. These facts clearly indicate a better hypoglycemic activity of complexes as compared to their parent drugs which is in agreement with the earlier findings of Iqbal and co-workers40. This improved hypoglycemic activity may be related to smaller particle size of metal complexes than drugs as on complexation particle size is reduced which may promote the ratio of absorption of complexes in gastro-intestinal tract.
Results of the present work are also in conformity with the hypoglycemic effect of copper-phenformin complex over parent drug phenformin as mentioned by Piccini et al.,41
These interesting observations on metal-complexes of oral sulphonylureas used as anti-diabetic agents for lowering blood sugar concentration may likely substantiate the use of these complexes after extensive clinical studies.
References
- Iqbal S.A.and Siddiqui A.,Orient J.Chem.,3(1);81-84(2005)
- Wilma Cyril,Suresh Kumar and Shobhna D.Orient.J.Chem.27(4);1653-1658(2011)
- Asmi Desnavi and S.A. Iqbal Orient J chem..1986 2(2),156-159 (1986)
- S.A.Iqbal, S.Siddiqui, R.Qureshi and A. Desnavi Orient J. Chem.; 1(1) 32-34 (1985)
- Iqbal S.A.,SibiJose and Ishaq Jaafrany,Orient.J.Chem.,28(1);613-618(2012)
- Mamta Bhattacharya S.A. Iqbal and Suman Malik, Orient J. Chem20(4); 643-646 (2004)
- Priya Budhani,S.A. Iqbal and S. Malik, Chemical and Environment Research( Aligarh) (2004)
- K. Nakamotto, Infrared Spectra of Inorganic and Co-ordination Compounds, John Wiley and Son’s New York Ed.(1963)
- C.N.R. Rao, Chemical Applications of Infrared Spectroscopy,Academic press, New York (1963)
- L.J. Belamy, The Infrared Spectra of complex Molecules, Matheum and Co-Ltd London (1964)
- Cotton F. A.; Modern Co-ordination chemistry, Inter-science Pub Ed.(1960)
- A.Weissberger ,Chemical Application of Spectroscopy, Inter-science publishers New York (1956)
- A.W. Coats, J.P. Redfern, Nature (London) 201,68 (1964)
CrossRef
- H.W. Horowitz G. Metzger, Anal Chem. 35,1464 (1963)
CrossRef
- Rosenberg,B.,Lippert B.,1999Cisplatin Chemistry and Biochemistry of Leading Anticancer Drug,verlag chemie VCH Basel 3
- Zayed M.A., Nour El-Dien, F.A.Mohamed Gehad G, El-Gamel, Nadia E.A., , J Z. Mol. Struct., 841, 41(2007)
CrossRef
- Cotton, F.A.; Wikinson G., Murillo, C,A., Bochmann, M. Advanced inorganic chemistry, sixth ed. Wiley, New York. (1999)
- P.M.Madhusudhayan, K.Krishan, K.N.Ninan Thermochim. ChemActa97,189 (1986);
- Pandey.R.N.,Nag A.K.,Prasashti Pandey and Sanjay K.Sing,Orient.J. Chem.26(1);109-112(2010)
- Rai,B.K.,and Chandan Kumar,Orient.J.Chem.26(3);989-994(2010)
- Birendra Kumar,Kiran Kumar Prasad and Sanjay Kumar Shrivastav,Orient.J.Chem.26(4);1413-1418(2010)
- Subi, A. AL-Jibori,Ibrahim F.,Waheed and Alif.Al-Samoraie,Orient.J.Chem.28(1);257-262(2012)
- Rehman,F.and Samya Majraj,Orient.J.Chem.,28(1);581-585(2012)
- A. A. Alhadi S.A.Shaker W.A.Yehe,H.M.Ali and A.A. Mahmood,Orient.J. Chem.,27(4);1437-1442(2011)
- A.S. AL-Janabi,and S.A.Ahmed,Orient.J.Chem.27(4);1563-1571(2011)
- S.Singh,K.K.Singh and J.P. Singh,Orient.J.Chem.27(3);1233-1237(2011)
- K.C. Patel, S.K. Patel and G.P. Vaidya, Orient J Chem,17, 223 (2001)
- Michael PEP, Barbe J.M., Juneja H, D. and Paliwal L. J.Euro polym. J. 43,(12) 2007
- Tamami B, Yaganesh H and Koohmarch G.A Iran polym. J, 14(5) ,785-792.( 2005)
- Yangesh H and Ataei S. M.Iran polym.J.,14(5),449-455(2005)
- Jadho M.M., Paliwal L.J. and Bhave M.S.J App Polym Sci, 109, 508 (2008),
CrossRef
- Gurnule W.B.,Juneja H.D. and Paliwal L.J.,Oriental J. Chem15, 283(1999),
- Mohamed G.G., Abd El-Wahwb, Z.H. J. Therm. Anal.73.347(2003)
- M.R.Khan and Sahdev,Orient.J.Chem.27(2);649-653(2011)
- K.Shankar and A.B.Nazeera,Orient.J.Chem.,27(2);655-660(2011)
- Varshosaz,J.,Tabbakhian,M.and Zahrooni,M,:Journal of Microcapsulation,24(3),253-262(2007)
CrossRef
- Folin.,O.and Wu,H:J.biol.Chem.,41,367(1920)
- Anturlikar,S.D.:Indian J.of Physiology and pharmacology,39,95-100(1995)
- Iqbal,S.A.,Hussain I.Khan,M.A.Khan,N.A., and Siddiqui,N.U.,:Orient.J.Chem.3(2),199-202(1987)
- Qureshi,.R.and Iqbal,S.A.:Indian J.Applied and pure Biol.,2(2),65-67(1987)
- Piccinni,F.Murazzi,E.,Uberti and Lu Catelli.I.:Pharmaco.(pavia) Ed.Sci.,15,521(1960)

This work is licensed under a Creative Commons Attribution 4.0 International License.