Effect of Zinc Oxide Nano Particle Concentration in the Polyaniline-Zinc Oxide Nanocomposite on the Dielectric Property
N. K. Verma
Center of Excellence, Material Science & Engineering, Department of Metallurgy, OP Jindal Institute of Technology, Raigarh Chhattisgarh -496001, India.
DOI : http://dx.doi.org/10.13005/msri/110207
Article Publishing History
Article Received on : 23 Nov 2014
Article Accepted on : 02 Dec 2014
Article Published : 02 Dec 2014
Plagiarism Check: Yes
Article Metrics
ABSTRACT:
Films of polyaniline and polyaniline–ZnO composites were synthesized by spin coating. The spin coated films were deposited over glass substrate. In order to confirm the dispersion quality and the size of the dispersed ZnO, Transmission electron microscopy was done. The TEM images show that ZnO nanoparticles were spherical in shape. Dark imaging mode confirmed these particles in solid phase and revealed the uniform distribution of the particles in the PANI matrix. The absorption peaks in FTIR spectra of PANI–ZnO composite film were found to shift to higher wave number when compared with pure PANI. The observed shifts were attributed to the interaction between the ZnO particle and PANI molecular chains. A change in the value of lattice parameter of ZnO as confirmed through the X ray diffraction method in the composite indicated the presence of interaction between ZnO particles and matrix. The dielectric study of PANI and PANI–ZnO composites demonstrated a significant decrease in the value of dielectric constant after the incorporation of the ZnO nanoparticles in the polymer matrix.
KEYWORDS:
Polymer Nanocomposite; FTIR; Nanoparticles
Copy the following to cite this article:
Verma N. K. Effect of Zinc Oxide Nano Particle Concentration in the Polyaniline-Zinc Oxide Nanocomposite on the Dielectric Property. Mat.Sci.Res.India;11(2)
|
Copy the following to cite this URL:
Verma N. K. Effect of Zinc Oxide Nano Particle Concentration in the Polyaniline-Zinc Oxide Nanocomposite on the Dielectric Property. Mat.Sci.Res.India;11(2). Available from: http://www.materialsciencejournal.org/?p=864
|
Introduction
The polyaniline –type conducting polymer had been worked with special interest in chemical, electrochemical, doping process and polyaniline based composite process. The process development with high accuracy of product result had direct relationship of structure, properties and molecular structure modification for future application1.The polymer prepared two solutions, one with highly oxidizing agent ammonium per sulfate (NH4)2(S2O8)) and other monomer aniline (C6H5NH2) .Both were dissolved in the electrolytic of of 1M CF3COOH; 1M HCl-IM NaCl; and 1M H2SO4-0.5 Na2SO4 were cooled at ~ 0.10C and stirred for 2 hours under nitrogen atmosphere2.The synthesis of optically polyaniline salt films were achieved via the electro polymerization of aniline on indium-tin –oxide (ITO)-coated glass electrodes in the presence of sulphonic acid. The results predict that chiral holes might be formed in polymer matrix during both redox and chemical re-doping cyclic of polyaniline salt films3.The films of polyaniline was prepared using ammonium persulphate as oxidizing agent. the films were prepared by casting an N-methyl-2 pyrrolidone (NMP) solution of an emeraldine base of polyaniline powders on glass substrates at 50 0C and doped in 1 M HCl aqueous solution with doping the polyaniline, changes to conducting form 4 .The polyaniline film using spin coating technique and polymers were dissolved in analytical –grade solvents (chloroform, THF and cyclohexanone) to form solutions of pure polymers and symmetric (1:1 w/w) polymer blend. The pure polyaniline films were prepared using the solution of PANI in Solvent and spin coating onto glass substrate speed of 3000rpm5 .the two structures differ from each other by the exchange of the carbon–carbon single and double bonds. While polyacetylene can exist in two isomeric forms: cis and trans-polyacetylene, the trans-acetylene form is thermodynamically more stable and the cis–trans isomerization is irreversible6. Oxidative (p-type) doping of polyacetylene involves the chemical or anodic oxidation of the polymer to produce carbonium cations and radicals with simultaneous insertion of an appropriate number of anions between the polymer chains7. Two radicals can then recombine to give a spineless dication referred to as a positive soliton, which can act as the charge carrier8. The combination of these characteristics makes polyaniline useful for various applications including rechargeable batteries9, light emitting diodes10, transistors11, molecular sensors12, nonlinear optical devices13, corrosion protection14, electromagnetic interference shielding15, and electrochromic displays16. The metal oxide semiconductor field effect transistor (MOSFET) is the most important device for very large scale integrated (VLSI) circuits such as microprocessors and memory devices. Much research has explored the use of conducting polymers as an active material in field effect transistor devices; dedoped or doped conjugated polymers such as trans-polyacetylene, polythiophene, thiophene oligomers, polythienylene vinylene, polyaniline17.
Experimental
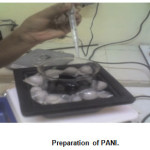
Preparation of Polyaniline
Polyaniline has been synthesized by chemical oxidative polymerization method. For the synthesis of polyaniline 0.5M aniline 1.5M HCl in double distilled water was taken. These were stirred in a beaker which was kept inside the rubber insulator at 00C. After this, 9 gm ammonium peroxidisulphate was dissolved in minimum (35-45 ml/gm) quantity of water. The ammonium peroxidisulphate is then added drop wise to above insulated beaker with constant stirring. The color changes to dark green. This solution was put for overnight. The solution was then filtered in Butchery funnel and the residue was washed 2-3 times with distilled water in the same funnel. The filtered residue is the dried for 3-5h in electrical oven at 450 C.
Preparation of ZnO Nanoparticle
ZnO nanoparticle synthesis was as follow Zinc acetate dihydrate (3.35 mmol) was first dissolved in methanol (31.25 ml) and another solution of potassium hydroxide was prepared by dissolving potassium hydroxide (6.59 mmol) in methanol (16.25 ml). The potassium hydroxide solution was added drop wise to the zinc acetate solution at 60 ◦C under vigorous stirring. After 1.5 h, nanoparticles started to precipitate and the solution became turbid. The heater and stirrer were removed after 2h and the solution was allowed to sit for another 2h. The ZnO nanoparticles settled at the bottom and the excess mother liquor was removed and the precipitate was washed twice with methanol (12.5 ml). The precipitate was then dispersed in 12.5 ml of methanol and 2.5 ml of chloroform. The dispersed solution was translucent and stable for up to 2 weeks 18.
Synthesis of Polyaniline-Zinc Oxide Composite
The undoped polyaniline powder was dissolved in N-methyl-2-pyrolidone (NMP).The solution was stirred for 2 hrs and filtered by a whatman filter paper having pore size of 6micron. A film of this undoped PANI was deposited by spin coating method on a glass substrate with 600 rpm for 20 sec and then dried at 1500 rpm for 45 sec. The film was then put for half an hour to dry completely at room temperature. A free standing film was also deposited by solution casting technique. For this a glass slides were taken in a Petri dish and spread the solution over them by a dropper. The ZnO composites with undoped PANI were prepared by adding 20% ZnO and 30 % ZnO in filtered solution of undoped PANI in NMP. After that the solution was arranged on the magnetic stirrer for 5 hrs. The film of composites were prepared on glass substrate by spin coating method at 600 rpm for 20 sec and then dried at 1500 rpm for 20 sec. Other free standing films of composite were also prepared by the solution casting technique 19.
Results & Discussion
Xrd Analysis
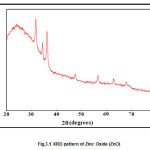
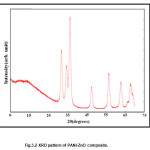
XRD analysis of bulk film of composite was conducted over the glass substrate. The characteristics peaks of ZnO comes at 31.720, 34.50, 36.30, 47.760, 56.60, 63.10 and 680 which corresponds to miller indices (100),(002),(101),(102),(110),(103) and (201) respectively. The average crystallite size was calculated by using Scherer formula by measuring the full width at half maxima of the (101) peak. The average size was found to be 27nm. This is further confirmed by TEM results. The XRD pattern of PANI shows a broad peak at 2θ=190, which corresponds to (200) plane of PANI. The XRD pattern of ZnO powder and PANI-ZnO (20%) composite exhibit the characteristic peak for crystalline ZnO of wurtzite structure this indicates that crystal structure of ZnO is not modified due to the presence of PANI. All the peaks of PANI-ZnO composites shift slight higher values of 2θ. From the XRD peaks it was observed that lattice parameter for ZnO were a=b=3.2269 Ao and for composite were a=b=3.2442 Ao, c=5.2061 Ao. This change of lattice parameter shows that the unit cell of ZnO stretches along horizontal plane and suppresses along c-axis. Since the surface area along the horizontal direction of unit cell is more than that of combined surface area of two vertical surfaces (top and bottom).
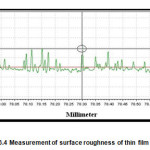
Thickness Measurement
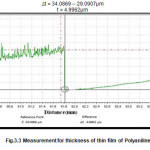
Thickness of PANI-ZnO composite film was measured with the help of mechanical profilometer. The graph given below can be used to measure thickness. Here on going from left to right we have a step at the origin. This step is the measure of thickness of film and can be measured by subtracting lower-right value from upper-left value. So, the thickness is
∆t = 34.0869 — 29.0907μm
t = 4.9962μm
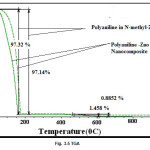
Thermogravimetric Analysis
The Thermogravimetric analysis (TGA) of ZnO-PANI composite was carried out in the presence of Nitrogen from 30oC to 1000oC. For PANI initially the huge loss of weight (97.32%) upto the temperature of 160oC is due to the loss of N-methyl-2-pyrolidone from melt. After that there was no change in weight up to 430oC, which shows that the PANI is stable up to that temperature. After this PANI starts to decompose at 480oC. The reaction completes at 600oC. For PANI-ZnO composite the curve was nearly same and loss of weight occurs due to loss of N-methyl-2-pyrolidone (97.13%) upto 175oC. After that there was no weight change till 445oC temperature was reached (430oC for PANI). This shows that the composite was stable till 445 oC and strength of composite also increased due to the attachment of PANI chains with ZnO crystallites. The composite decompose 0.88% up to the temperature of 637oC (which was 600oC for PANI). After 637oC there was no weight change up to 1000 oC owing to the stability of ZnO nanoparticles.
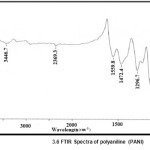
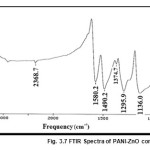
Ftir Spectral Studies
The characteristics peaks of PANI at 503.1cm-1, 587.6 cm-1,798.7 cm-1, 1121.8 cm-1, 1296.7 cm-1, 1472.4 cm-1, 1559.8 cm-1, 2369.3 cm-1 and 3446.7 cm-1 corresponds to the C = N iminoquinone, C =C stretching mode of quinoid rings, the C = C stretching mode of the benzenoid rings, the stretching mode of C – N, the stretching mode of N = Q = N where Q represents the quinoid ring and C – H bonding mode of aromatic rings. The PANI-ZnO composite also shows the same characteristics peak. But the corresponding peaks of pure PANI at 798.7 cm-1shifted to 794 cm-1,1121.8 cm-1 shifted to 1136 cm-1, 1472.4 cm-1 shifted to 1490.2 cm-1and 1559.8 cm-1 shifted to1580.2 cm-1 wave numbers in PANI-ZnO composite. The shift may be described due to the formation of hydrogen bonding between ZnO and NH group of PANI on the surface of ZnO particles.
Dielectric Constant
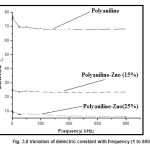
The dielectric constant (ε) of PANI and PANI–ZnO composites as a function of frequencies (1 to 800 kHz) are shown in Fig. 3.8
For PANI the dielectric constant as a function of frequency decreases from 674.34 to 604.17 while for PANI–ZnO (15%) composite and PANI–ZnO (25%) composite, it remains almost constant. The real part of permittivity of PANI–ZnO (15%) composites decreases by a factor of ∼2 and for PANI–ZnO (25%) composite by ∼9 in comparison of pure PANI. This decrease in real part of permittivity can be explained by the multi-core model of interface between ZnO particle and PANI. According to this model the interface between particles and polymer consists of multilayer in which the inner layer consists of polymer chains. These layers are strongly attached to the surface of ZnO particles and the outer layer consists of polymer chains which loosely interacted with the inner layer. It is characterized by different chain conformation, chain mobility and free volume. The reduction in the real part of permittivity is related to inner bound layer which impairs the motion of dipoles and the free volume contributed by the outer layer. In the present case of PANI–ZnO composite, there is a strong interaction on the surface of ZnO particles with the PANI molecular chains as indicated by the XRD and FTIR analysis. The reason of this interaction may be attributed to the defects on the surface of ZnO particles. These defects may act as active sites (dipoles) for the interaction of PANI molecular chains.
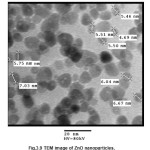
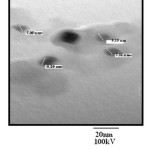
Tem Analysis
The fig 3.10 shows the TEM images of ZnO nanoparticles. It is clear from the image that shape of particles is spherical, the average size of particles lies between 5 to 10 nm in diameter. The dark images show that nanoparticles are solid in structure. The TEM images (Fig. 10 (a), 11 (b)) of PANI-ZnO composite shows that particles are entrapped inside the matrix of PANI and size of particles is same so there is no agglomeration of ZnO nanoparticles in PANI matrix. Also, the distribution of ZnO particle in PANI matrix is nearly uniform.
Conclusion
The thin Films of polyaniline and polyaniline–ZnO composites have been synthesized over glass substrate. The PANI-ZnO composites showed a better dielectric property as compared to the PANI films due to high energetic ZnO nanoparticles with matrix of polyaniline. This is attributed to the interaction between the uniformly dispersed ZnO nanoparticles and the polymer chain in the matrix. This interaction has been confirmed simultaneously through various characterization such as X-Ray Diffraction (XRD), Transmission electron microscope (TEM) and Fourier transform infrared (FTIR). The TEM study of composite film revealed uniform distribution of ZnO particles matrix. In FTIR spectra the peaks corresponding to polyaniline are shifted to higher wave number side than polyaniline which again indicates interaction between polyaniline chain and ZnO nanoparticles. The XRD confirm the attachment of ZnO nanocomposite with the polymer chains.
Acknowledgements
I am thankful to Principal Director, OPJIT and Head of Department, Metallurgical Engineering for Providing necessary amities and facilities for continuing and caring this work.
References
- Yuvraj Singh Negi and P.V.Adhyapak, Polymer Research and Development Division, Centre for Materials for Electronics Technology, 42, 35-53.
- M.Sacak,M.Karakisla,E.Erdem and U.Akbulut,Journal of Applied Electrochemistry ,309-316,27(1997)
- Mir Reza Majidi,Leon A.P.Kane-Maguire and Gordon G.Wallance Astralian Journal of Chmistry,5(1),23-30.
- Hu Yan, Kazuhisa Tomizawa, Hiroyuki Ohno, Naoki Toshima, Macromol.Mater Eng.288.578-584, (2003).
- Jaczewska, A.Budkowski, A.Bernasik, I.Rapitis, J.Raczkowska, D.Goustouridis, J.Rysz, M.Sanopoulou DOI10.1002/App.26012,(2006).
CrossRef
- Y. Cao, J. J. Qiu, P. Smith, Synthetic Metals 69 (1995) 187
CrossRef
- J. L. Bredas, G. B. Street’ Accounts of Chemical Research 18 (1985) 309.
CrossRef
- A. Pron, P. Rannou Progress in Polymer Science (2002) 27 135.
CrossRef
- A. F. Diaz, K. K. Kanazawa, G. P. Gardini, Chemical Communications 14 (1979) 635.
CrossRef
- A. G. Macdiarmid, Angewandte Chemie – International Edition 40 (2001) 2581.
CrossRef
- E. Menefee, Y. H. Pao, Journal Of Chemical Physics 36 (1962) 3472
CrossRef
- V. V. J. Walatka, M. M. Labes, J. H. Perlstein, Physical Review Letters 31,
- W. D. Gill, W. Bludau, R. H. Geiss, P. M. Grant, R. L. Greene, J. J. Mayerle, G. B. Street,Physical Review Letters 38 (1977) 1305.
CrossRef
- G. Natta, G. Mazzanti, P. Corradini, ‘Stereospecific Polymerization Of Acetylene,’ Atti Accad. Nazl. Lincei Rend. 25 (1958) 3.
- C. K. Chiang, S. C. Gau, C. R. J. Fincher, Y. W. Park, A. G.Macdiarmid, A.J.Heeger, Applied Physics Letters 33 (1978) 18.
CrossRef
- R. B. Seymour, Conductive Polymers; Polymer Science and Technology, 1st Edn, Plenum Press, New York, 1981.
CrossRef
- C.J. Mathal, S. Saravanan, M.R. Anantharaman, S.Venkitachalam And S. Jayalekshmi, Institute Of Physics Publishing, 35 (2002) 240-245.
- Exploring Surface Texture, A Fundamental Guide to the Measurement of Surface Finish, Published by Taylor Hobson Limited, England, 2003.
- Z L S Seow, A Swwong, V Thavasi, R Jose, S Ramakrishna And G W Ho Nanotechnology 20 (2009) 6 .

This work is licensed under a Creative Commons Attribution 4.0 International License.