Shalini Agarwal, Vibhav K. Saraswat*
Deptt. of Physics, Banasthali University, Banasthali (Tonk), 304022, India
DOI : http://dx.doi.org/10.13005/msri/110210
Article Publishing History
Article Received on : 22 Nov 2014
Article Accepted on : 30 Nov 2014
Article Published : 05 Dec 2014
Plagiarism Check: Yes
Article Metrics
ABSTRACT:
In present research work, nanocomposite films of organic polymeric matrix polymethylmethacrylate (PMMA) and its nanocomposites with inorganic nanosized filler, namely titania (TiO2) nanoparticles, have been prepared and characterized thermally. TiO2 nanoparticles have been synthesized by chemical route method. Formation of nanoparticles and their average size have been confirmed by Transmission Electron Microscopy (TEM). The average particle size of the nanoparticles has been found to be ~19 nm. PMMA-TiO2 nanocomposites with different TiO2 weight percent (e.g. 1%, 2% and 3%) have been prepared by solution casting technique. These prepared samples have been investigated by means of Differential Scanning Calorimetry (DSC) at different heating rates. The effect of heating rate and TiO2 weight percent on glass transition temperature (Tg) and melting temperature (Tm) have been studied. It has been found that Tg and Tm increases as TiO2 content increases in PMMA matrix. An effort has also been made to calculate activation energy at glass transition temperature using Kissinger, Moynihan and Lasocka relations.
KEYWORDS:
PMMA nanocomposites; Differential scanning calorimetry; Glass transition; Activation energy
Copy the following to cite this article:
Agarwal S, Saraswat V. K. Synthesis and Thermal Characterization of PMMA-TiO2 Nanocomposites. Mat.Sci.Res.India;11(2)
|
Introduction
During the past years, major developments in the polymer science has been enriched our knowledge about the relationship between the structure of polymer and their properties [1]. Polymer nanocomposites are important materials for nanoelectronics and solar cells due to their unique properties like high homogeneity and cost-effective processability [2-5]. TiO2 is commonly used and one of the most investigated metal oxides since it is inexpensive and nontoxic material. Dispersion of TiO2 in polymer matrix can offer enhancement in the weatherability and durability of polymer products [6,7]. The potential applications of the nanocomposites include automotive, aerospace, opto-electronics [8] and many more. A plenty of work have been reported on thermal, mechanical and optical studies of polymer nanocomposites. A. Parveen [9] reported the improvement in thermal stability of polyaniline/TiO2 nanocomposites at 660°C. At high temperature, surfactant acts as a plasticizer in polystyrene/TiO2 nanocomposites and shows the thermal stability [10]. PMMA, which is also known as Acrylic, is a linear thermoplastic polymer. Thermal, optical and mechanical properties of PMMA can also be improved by addition of suitable nano filler. Jieyu [11] have prepared high refrective index PMMA/TiO2 nanocomposites by solvothermal method. V. modgil [12] and N. Tanwar [13] have been investigated crystallization and glass transition kinetics under nonisothermal conditions using DSC technique. Present work reports about the thermal characterization of PMMA and its TiO2 nanocomposites and estimation of activation energy using Kissinger, Moynihan and Lasocka relations.
Materials and Methods
Synthesis of TiO2 Nanoparticles
Synthesis of TiO2 nanoparticles has been carried out using chemical precipitation method [14]. TiCl3 solution has been mixed with NH4OH aqueous solution in 1:6 volume ratio. The resulting solution has been stirred for 48 hrs at room temperature. By centrifuging the solution, obtained white precipitate has been further washed in iso-propyl alcohol and dried at room temperature. This procedure produced white colored dry nanopowder.
Preparation of PMMA -TiO2 Nanocomposites
Nanocomposites films with TiO2 nanoparticles, dispersed in the polymer matrix PMMA with different wt % of TiO2, have been prepared by solution casting method. The mixture has been stirred until complete dissolution of the polymer and TiO2 in solvent Dichloromethane (DCM). The resulting solution has been casted on to the glass petridish and kept in a dry atmosphere; dried film has been peeled off from petridish and used for further characterization.
Results and Discussion
Transmission Electron Microscopy (TEM) and X-Ray Diffraction (XRD)
Figure 1(a) shows the TEM image of synthesize TiO2 nanoparticles. The average particle size of the sample has been found to be ~19 nm. Figure 1(b) shows the XRD pattern of pure PMMA and its TiO2 (1, 2 and 3 wt%) nanocomposites. Broad peaks occurred in diffraction pattern at 2θ=29.6° and 41.9°, are due to amorphous nature of PMMA. XRD spectra of the nanocomposites show the bands observed in PMMA together with the peaks of the fillers. The intensity of peaks, corresponding to TiO2 increases with increasing filler quantity. This confirms that the filler maintained its structure in the composite, and that the orientation of the PMMA chains has also not been influenced during the nanocomposite preparation process.
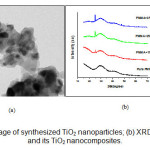 |
Figure1: (a) TEM image of synthesized TiO2 nanoparticles; (b) XRD patterns of PMMA and its TiO2 nanocomposites.
Click here to View figure
|
Differential Scanning Calorimetry (DSC) of Nanocomposites
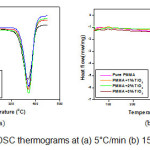
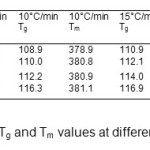
The effect of nano filler content and heating rate on the PMMA-TiO2 nanocomposites has been investigated using NETZSCH DSC 204- F1 phoenix Differential Scanning Calorimeter. Tg and Tm have been calculated and analysed using DSC thermograms recorded in a temperature range from room to 450°C at different heating rates (e.g. 5, 10, 15, 20 °C/min). Figure 2 shows the DSC thermograms of PMMA and its nanocomposites at 5 and 15°C/min as representative case. Tg values have been taken at the midpoint of the step transition and endothermic peak gives the melting point. PMMA is amorphous in nature and does not exhibit a noticeable melting transition but at high temperature it can show melting transition. Table 1 lists Tg and Tm obtained from DSC thermograms for pure PMMA and its nanocomposites at different heating rates. It is clear from table 1 that melting temperature varies from 369.63 to 393.8°C. It has been observed that glass transition temperature increases as TiO2 wt% increases in PMMA matrix. It has also been observed that Tα increases as heating rate increases. The Tα value increases due to restriction of segmental chain mobility and enhancement in crosslinking density between organic and inorganic domain. Activation energy at glass transition is defined as energy required for segmental motion of chains to reach at glass transition region. Activation energy (E) of these nanocomposites has been evaluated by empirical relation, given by Kissinger [15] as;
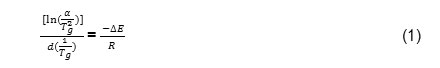
Where, α is the heating rate, Tg is the peak glass transition temperature and R is gas constant.
The activation energy of glass transition (E) have been calculated by the slope of the plot of ln(α/Tg2) against 1/Tg. Figure 3(a) shows the variation of ln (α/Tg2) against 1/Tg. Slope of these lines provides the activation energy. Another approach has also been used for calculation of activation energy at glass transition using Moynihan’s relation [16] as;
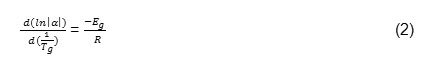
Where, symbols have their usual meaning. Variation of ln (α) against 1/Tg has been plotted for PMMA and its TiO2 nanocomposites in Figure 3(b). Slope of these lines provides the activation energy at glass transition.
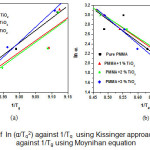 |
Figure3: (a) Plots of ln (α/Tg2) against 1/Tg using Kissinger approach (b) Plots of ln α against 1/Tg using Moynihan equation
Click here to View figure
|
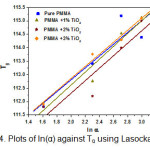
The values of activation energies calculated by Kissinger and Moynihan approaches have been listed in Table 2. It is evident from Table 2 that the activation energy increases as nano filler wt % increases. Higher activation energy is due to formation of the cross linked network in polymer nanocomposites and hence the PMMA/ TiO2 nanocomposite system shows higher thermal stability than that of pure PMMA. Values of activation energy have been found in good agreement using both models. The dependence of Tg on the heating rate has also been studied using Lasocka’s empirical relation [17] as;
Tg = A+B ∫η α (3)
Where, A & B are constants. The value of ‘A’ indicates the glass transition temperature at a heating rate of 1 °C/min and ‘B’ determines the time response of configurational changes within the glass transition region to the heating rate. Values of A and B calculated from the plots of Tg versus ln α (figure 4), have been listed in Table 2. This equation has been found to hold well for all samples.
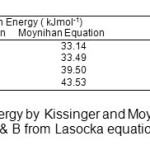 |
Table2: Values of activation energy by Kissinger and Moynihan equation and constants A & B from Lasocka equation
Click here to View table
|
Conclusion
TiO2 nanoparticles and PMMA-TiO2 nanocomposites have been prepared by chemical route and solution casting method, respectively. TEM has been employed to calculate particle size and it comes out to be ~19 nm. XRD of nanocomposites shows the bands of PMMA together with the peaks of TiO2 nanoparticles. It has been observed that peaks for TiO2 nanoparticles in XRD patterns are more pronounced for higher content of TiO2 nanoparticles. DSC thermograms show the increase in Tg and Tm value due to restriction of segmental chain mobility as TiO2 content increases in PMMA matrix. One may conclude that TiO2nanoparticle has been proved to be a favourable way for more crosslinking between chains and hence chain mobility is restricted to segmental motion. Activation energy of PMMA and its nanocomposites has been calculated using Kissinger and Moynihan model. Results conclude that the PMMA/ TiO2 nanocomposite system has a higher activation energy and thermal stability than pure PMMA. It has been found that values of activation energy calculated by Kissinger and Moynihan model are in good agreement and Lasocka equation has been found to hold good for all nanocomposites.
Acknowledgement
Authors are thankful to DST, Govt. of India for supporting Banasthali University under its CURIE scheme.
References
- Agarwal S., Saxena N. S., Agrawal R. and Saraswat V. K., RAM, AIP Conf. Proc.1536, 777 (2013)
CrossRef
- Patra N., Barone A.C., Salerno M., Caputo G. and D. Cozzoli, Advanced Materials Research 67, 209 (2009)
- Yakuphanoglu F., Ilican S., Caglar M. And Caglar Y., Journal of Optoelect. and Adv. Materials 9, 2180 (2007)
- Guo Z., Ng H. W., Yee G. L. and Thomas Hahn H., Journal of Nanoscience and Nanotechnology, 9, 3278(2009)
CrossRef
- Agrawal H., Awasthi K. and Saraswat V.K., Polym. Bull. 71, 1539 (2014)
CrossRef
- Dzunuzovic E., Marinovic M., Vukovic J. , Jeremic K. and Nedeljkovic J.M., Polym Composites 30,737 (2009)
CrossRef
- Agrawal H., Agarwal S., Saraswat Y. K., Awasthi K. and Saraswat V. K., Journal of Nuclear Physics, Material Sciences, Radiation and Applications 1, 207 (2014)
- Yupjeon I. and Beombaek J., Materials 3, 3654 (2010)
CrossRef
- Parveen A. and Roy A.S., Adv. Mat. Lett.4, 696 (2013)
CrossRef
- Patra N., Salerno M., Cozzoli D. and Athanassiou A., Journal of Colloid And Interface Science 405,103 (2013)
CrossRef
- Jin J., Qi R., Su Y., Tong M. And Zhu J., Iran. Polym. J. 22, 767 (2013)
CrossRef
- Modgil V. And Rangra V.S., Journal of Materials, Doi/10.1155/2014/318262 (2014)
- Tanwar N. and Saraswat V.K., Journal of Non-Crystalline Solids 394, 1 (2014)
CrossRef
- Borse P. H., Kankate L. S., Dassenoy F., Vogel W., Urban J. and Kulkarni S. K., Journal of Material Science: Materials in Electronics 13, 553 (2002)
CrossRef
- Kissinger H. E., Anal. Chem. 29, 1702(1957)
CrossRef
- Moynihan C. T., Easteal A. J., Wilder J. and Tucker J., Journal of Physical Chemistry 78, 2673 (1974)
CrossRef
- Lasocka M., Materials Science and Engineering 23,173 (1976).
CrossRef

This work is licensed under a Creative Commons Attribution 4.0 International License.