Y. Govind Reddy1, A. Sadananda Chary1, S. Narender Reddy2*
1Department of Physics, University College of Sciences, Osmania University, Hyderabad- 50007, India.
2Department of Physics, University College of Engg. Osmania University, Hyderabad-50007, India.
Correspondence: E-mail: snreddy_sattineni2000@yahoo.com
DOI : http://dx.doi.org/10.13005/msri/120201
Article Publishing History
Article Received on : 17 Aug 2015
Article Accepted on : 10 Oct 2015
Article Published : 11 Aug 2015
Plagiarism Check: Yes
Article Metrics
ABSTRACT:
Lead Nitrate composite solid electrolyte system in different compositions was synthesized by dispersing nano particles of CeO2 in the host Pb(NO3)2. These systems were characterized by XRD, DSC and FTIR. X-ray diffraction patterns have shown peaks corresponding to pure lead nitrate and cerium oxide in all the compositions with varying intensities and no additional or shifting of peaks were observed. DSC studies indicate uniform melting point in host and dispersed composites. FTIR studies ruled out the chemical reaction between host and dispersoid. Dc ionic conductivity studies were carried out in the temperature range 100oC to 400oC. Ionic conductivity was found to increase with mole percentage of the dispersoid with increase in temperature. Maximum enhancement was observed for 8mole% dispersed system as against the pure Pb(NO3)2 in the extrinsic region of conductivity. Enhanced conductivity in dispersed systems was thought to be due to the presence of Space Charge Layer between the host and dispersoid.
KEYWORDS:
Composite Solid Electrolyte; Space Charge Layer; Ionic conductivity; Fluorite structure
Copy the following to cite this article:
Reddy Y. G, Chary A. S, Reddy S. N. Dc Ionic Conductivity Study by Two Probe Method on (1-X)Pb(No3)2:Xceo2 Composite Solid Electrolyte. Mat.Sci.Res.India;12(2)
|
Copy the following to cite this URL:
Reddy Y. G, Chary A. S, Reddy S. N. Dc Ionic Conductivity Study by Two Probe Method on (1-X)Pb(No3)2:Xceo2 Composite Solid Electrolyte. Mat.Sci.Res.India;12(2). Available from: http://www.materialsciencejournal.org/?p=3649
|
Introduction
The enhancement of ionic conductivity in inorganic ionic solids by dispersion of fine insulating and insoluble particles has been reported by several authors1. The presence of high ionic conductivity with negligible electronic conductivity of these systems has attracted a great deal of interest from industry and researchers due to their potential applications in solid state ionic devices in the recent past. These dispersed solid electrolyte materials have become promising candidates for devices in solid state technology. In the field of fast ionic conductors or super ionic conductors efforts are being continued for newer materials along with existing electrolyte materials to improve performance of solid state ionic devices.
Ionic conducting materials are broadly classified into two categories namely, cation based conductors and anion based conductors. In both the categories of composite solid electrolytes, the non conducting materials such as Al2O3, CeO2, SiO2 and ZrO2 are used as second phase particles for enhancement of conductivity. These second phase dispersoid particles are nearly insoluble in host under the preparation conditions. Several theories have been proposed to explain the enhancement of conductivity by forming a layer called Space Charge Layer (SCL) between the matrix of host and dispersoid. Due to enrichment of charge carriers at the host and interface interaction region in the matrix which forms as a highly conducting layer is treated as Space Charge Layer 2. Two probe method is one of the important techniques to study ionic transport parameters through dc conductivity technique3.
The enhancement of ionic conductivity in nitrates of alkali and alkaline earth dispersed composites have been reported in the literature 4-6. The structures of Ba(NO3)2, Ca(NO3)2, Sr(NO3)2 and Pb(NO3)2 were reported to be fluorite type structure forming an isomorphous group7. They have a cubic structure with a space group Pa3 and belong to Th6 class and reported that anti- Frenkel disorder is predominant in these nitrates8. For the present study Pb(NO3)2 was chosen as the host matrix material because of non-hygroscopic and does not exhibit any solid-solid transformation. Our survey of literature indicates that no systematic investigation has not been reported so far on Pb(NO3)2:CeO2 composite system. The aim of present work is to study enhancement in host Pb(NO3)2, with the dispersion of nano size CeO2 insulating particles, and to interpret the obtained results with suitable models/theories.
Experimental Procedure
Single crystals of Pb(NO3)2 were grown by solution growth technique from the starting material (99% purity) which was obtained from Merck chemicals (USA). The crystals obtained by this method were ground in an agate mortar and then sieved to obtain uniform particle size ( ≈ μm size). The dispersoid CeO2 (nano size < 25nm) used was obtained from sigma Aldrich. Pb(NO3)2 and CeO2 powders taken in particular composition were mixed in the presence of acetone for homogeneous mixing of both the constituents. Pellets of 12mm diameter and 1-2mm thickness were prepared by using steel die by applying a pressure of 0.26 GPa and they were sintered at 300oC for about 15hours. Silver paint was employed to ensure good electrical contacts with electrodes. To study ionic conductivity by two probe method, pellets were mounted in between the electrodes of sample holder and annealed at 100oC for 3hrs prior to the actual data recording. The temperature was measured with the help of Cr-Al thermocouple. A fixed voltage of 1.5 V was applied and the current measurement was done by using Agilent digital multi meter.
Structural characterizations were performed on Expert Pro X-ray Diffractometer (XRD) with CuKα radiation and Bruker Optics, Germany Tensor 27 model spectrometer (FTIR) respectively. The thermal properties have been carried out by DSC on Q20, a computer interfaced system, with continuous heating rate of 10oC min-1.
Results and Discussion
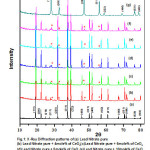
X-ray diffractograms of various compositions are shown in Fig.1 and peaks indicate that the system is in crystalline form and no new peaks were noticed except those belong to host and dispersoid which reveals that CeO2 remains as a separate phase in (1-X)Pb(NO3)2:XCeO2 composite. This XRD study also confirms that the present system is a two phase system. The lattice constant of pure lead nitrate is estimated as 7.9233Ao which is matched with literature value 9. For confirmation of phase formation, XRD peaks are indexed and compared with reported JCPDS data which is shown in Table.1. The average crystallite sizes are estimated from XRD data, for Pure Lead Nitrate as 353.53 nm and for dispersoid CeO2 is 85.05 nm, by means of Debye- Scherer formula. The average density percentage for all composite samples after annealing is estimated to be around 90%.
Figure 1
Table 1: Comparison of calculated XRD data and reported JCPDS data.
|
Table1:Comparison of calculated XRD data and reported JCPDS data
|
|
Calculated
|
|
Reported
|
|
Crystallite size
|
|
data from 2θ
|
JCPDS data
|
calculated from XRD(nm)
|
|
Lead Nitrate Pure (JCPDS 36-1462)
|
|
|
2θ
|
(hkl)
|
2θ
|
(hkl)
|
|
|
19.13
|
111
|
19.56
|
111
|
149.23
|
|
22.2
|
200
|
22.61
|
200
|
190.23
|
|
24.92
|
210
|
25.33
|
210
|
155.37
|
|
27.37
|
211
|
27.78
|
211
|
99.19
|
|
31.79
|
220
|
32.2
|
220
|
277.14
|
|
37.67
|
311
|
37.94
|
311
|
242.89
|
|
39.43
|
222
|
39.69
|
222
|
373.33
|
|
45.91
|
400
|
46.15
|
400
|
276.12
|
|
50.33
|
331
|
50.58
|
331
|
301.66
|
|
51.62
|
420
|
51.99
|
420
|
310.16
|
|
57.19
|
420
|
57.39
|
420
|
266.54
|
|
61.04
|
511
|
61.24
|
511
|
298.28
|
|
67.2
|
440
|
67.34
|
440
|
369.79
|
|
71.11
|
531
|
70.88
|
531
|
460.71
|
|
76.3
|
620
|
76.61
|
620
|
813.1
|
|
Cerium Oxide Pure (JCPDS 81-0792)
|
|
28.15
|
111
|
28.54
|
111
|
72.93
|
|
32.7
|
200
|
33.07
|
200
|
52.32
|
|
47.15
|
220
|
33.07
|
220
|
43.16
|
|
56.03
|
311
|
56.33
|
311
|
78.8
|
|
58.79
|
222
|
59.07
|
222
|
84.97
|
|
69.17
|
400
|
69.4
|
400
|
99.06
|
|
76.47
|
331
|
76.68
|
331
|
125.2
|
|
78.81
|
420
|
79.06
|
420
|
124.01
|
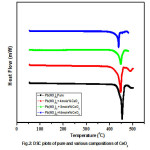
Fig.2 shows DSC curves of pure lead nitrate and composite systems of lead nitrate. The DSC spectrum recorded in the temperature range 50 – 500oC. The strong endothermic peak which corresponds to melting point of lead nitrate is observed nearly at 454oC. The endothermic peak remains unaffected, except slight shifting with increase of dispersoid concentration. This suggest that there is no solubility of CeO2 in Pb(NO3)2 and thus Pb(NO3)2:CeO2 system form a two phase system, which is in conformity with XRD results. DSC curves of pure Lead Nitrate and its various compositions shows no phase transitions occur before its melting. The Endothermic peaks in pure Lead Nitrate after melting point indicates decomposition nature of it.
Figure 2
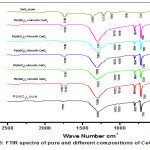
FTIR spectra of pure and composite samples have been recorded in the wave number range 600-4000 cm-1 (shown 600-2500 cm-1) shown in Fig.3. FTIR is a powerful tool to identify functional groups present in composites by monitoring the vibrational energy levels of molecules and to identifying the nature of bonding between molecules 10. The spectrum of Pb(NO3)2 shows a strong absorption band at 721 (v strong), 803(v strong), 1013,1072,1287,1770 cm-1. These values are in good agreement with earlier reported values and these bands are ascribed to presence due to isotopitically different NO3– ions 11. And beyond 2600 cm-1 a few very weak absorptions are observed (not shown in graph) are due to weak interaction of hydrogen bond with pure Lead Nitrate. The other compositions also show similar absorption peaks at corresponding wave numbers, except with slight fluctuation at 1287 cm-1.
Figure 3
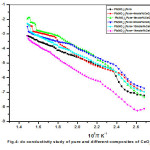
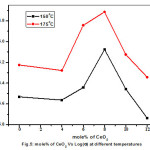
Variation dc ionic conductivity with reciprocal temperature plots between temperatures 100oC and 400oC drawn for pure and dispersed composites are shown in Fig.4. The conductivity data were represented by Arrhenius relation given by σ = σ₀exp(-Ea/KBT), where σo is pre-exponential factor, Ea is activation energy, KB is Boltzmann’s constant and T is absolute temperature. From conductivity graph it is clear that, while increasing the concentration of CeO2 the enhancement of conductivity was found increase and reaching to a saturation value at 8mole% of dispersoid and there on wards decrement of conductivity was recorded. The maximum enhancement of conductivity recorded was about one order with respect to pure Pb(NO3)2 system. Fig.5 shows variation of conductivity with different mole% of CeO2 dispersed systems for few typical temperatures indicates a systematic variation of conductivity as a function of CeO2. Similar observations made on some anion-Frenkel defect systems such as CaF2, PbF2, Ba(NO3)2, Pb(NO3)2 12-16 where the conductivity varied systematically as function of dispersoid for different insulating particles.
Figure 4
From the above observation, it is clear that dispersion of CeO2 in host Pb(NO3)2 responsible for considerable enhancement in conductivity. To interpret the enhancement in conductivity with CeO2 dispersion in host Pb(NO3)2, Random Resistor Network [RRN] model taken into account, out of available models.17 According to this model, from the macroscopic point of view at interface region a highly conducting layer exist between host and dispersoid and predicts the existence of two critical concentrations, namely, Pc‘ and PcꞋꞋ. At Pc‘ the high conducting layers begin to form connected pathways and at PcꞋꞋ the connected pathways get disrupted as they begin to form closed loops due to increased concentrations of insulating bonds. Fig.5 shows that conductivity raises initially, passes through maximum at 8mole% of CeO2 composite and subsequently drops to higher mole% of CeO2 composite. This appears to be consistent with RRN model for (1-X)Pb(NO3)2:XCeO2 composite system.
Figure 5
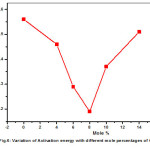
The transport parameters are given in Table.2 for all Pb(NO3)2-CeO2 composites studied in this work. The variation of activation energy (Ea) is consistent with the generally observed relation for ionic conductors i.e. the increase in conductivity is almost invariably associated with a decrease in activation energy. The activation energy initially decreases from pure Pb(NO3)2 to 8mole% of CeO2 composite, where conductivity is maximum in extrinsic region and there after enhancement of activation energy is observed, where the conductivity recorded decrement. The variation of activation energy (Ea) vs. mole percentage is shown in Fig.6.
Figure 6
In composite solid electrolytes, it is widely believed that the presence of excess defects at the host matrix and dispersoid particle interface contributes to high conductivity in composite solid electrolytes. Formation of space charge layer between host and dispersed particles is thought to be responsible for conductivity enhancement process. In Fluorite structured ionic solids, ionic mobility requires anti-Frenkel defects 7, 18. The enhancement in conductivity with heterogeneous dispersion can be explained within the frame work of space charge model proposed by Maier’s semi quantitative model 19. Macroscopically generation of excess anion vacancies at matrix-particle interface due to formation of space charge layer is more appropriate for this composite solid electrolyte system.
Table 2: Ion Transport parameters Viz. the Pre-exponential factor (σ₀) and the Activation Energy (Ea) of Pb(NO3)2: CeO2 composites.
|
|
|
Mole
|
Temperature
|
Activation
|
Pre exponential
|
|
percentage
|
range (oC)
|
Energy (eV)
|
factor (σ₀)
|
|
0
|
250-350
|
0.56
|
1.36
|
|
4
|
250-350
|
0.46
|
3.68
|
|
6
|
250-350
|
0.29
|
1.4
|
|
8
|
250-350
|
0.19
|
0.41
|
|
10
|
250-350
|
0.37
|
1.99
|
|
14
|
250-350
|
0.51
|
3.33
|
Conclusion
XRD and DSC studies confirm that the composite (1-X)Pb(NO3)2:XCeO2 is biphasic system. FTIR studies show the presence of NO3– ion. The maximum enhancement of conductivity is about one order of magnitude for 8mole% dispersed electrolyte with respect to host Pb(NO3)2. The conductivity enhancement in extrinsic region due to formation of space charge layer between host Pb(NO3)2 and CeO2 is thought to be responsible. With the formation of space charge an internal field developed at interface which causes acceleration in transport of conducting ions.
Acknowledgements
Authors would like to thank the Head, department of Physics, Osmania University for allowing us to use the experimental facilities in the department. We also thank the Director CFRD for permitting to use the FTIR facility.
References
- Philippe Knauth, J.Am.Ceram.Soc.85 (7)1654-80 (2002).
CrossRef
- Shushong jiong, J.B.Wagner Jr, J.physics chemistry of solids, 56, No8, 1101-1111 (1995).
- R.C.Agarwal, Indian Journal of Pure and Applied physics, 37, 294-301 (1999).
- M. V. Madhava Rao, S. Narender Reddy, A. Sadananda Chary, Physica B, 389,292-295 (2007).
CrossRef
- P.S.Anantha, K.Hariharan, Material Science and Engineering B, 121, 12-19 (2005).
CrossRef
- V.G.Ponomavera, G.V.Lavrova, L.G.Simonova, Solid State Ionics, 136, 1279-1283 (2000).
- T.Chiranjivi, K.Saibabu, Bulletin of Electrochemistry 1(6), 585-588 (1985).
- K.Saibabu, T.Chirangivi, Solid State Ionics, 6,155-157 (1982).
CrossRef
- Hubert Nowotny, Gernot Heger, Acta Cryst, C42, 133-135 (1986).
CrossRef
- Brain C Smith, Fundamentals of Fourier Transform Infrared Spectroscopy, Second Edition, CRC press, Pp 12-16 (2011).
- M.H.Brooker, D.E.Irish, G.E.Boyd, The Journal of Chem.Phy.53, 1083 (1980).
- G. Rog, M. M. Bucko, A. Kielski, A. Kozlowska-Rog, Ceramics International, 25,623-630 (1999).
CrossRef
- A. Tschope, Solid state Ionics 139, 267-280 (2001).
CrossRef
- K. Hariharan, J. Maier, J. Electrochem.Soc.,142, 10 (1995).
CrossRef
- S.Narender Reddy, A. Sadananda Chary, Ch.Gopal Reddy, M. V. Madhava Rao, Materials Letters 58, 2949-2952 (2004).
CrossRef
- Y. Govind Reddy, S. Narender Reddy, A. Sadanada Chary, Advances in Applied Science Research, 3(5):2630-2635 (2012).
- H.E.Roman, M.Yussouff, Physical Review B 36, 7285 (1987).
CrossRef
- Drik Zahn, Paul Heitjans, Joachim Maier, Chem. Eur.Journal, 18, 6225-6229 (2012).
CrossRef
- .Maier, Prog.Solid State Chem., 23,171-263(1995).
CrossRef

This work is licensed under a Creative Commons Attribution 4.0 International License.