Spectral and Biological Studies on Microwave Assisted Synthesized Zn(II) Complex of Schiff Base Derived from Sulphonamides
T. A Bhattacharya and Priya Budhani
Sadhu vaswani College , Bairagarh . Bhopal-462 030(India) Cresent College, Bhopal-462 001(India)
DOI : http://dx.doi.org/10.13005/msri/130106
Article Publishing History
Article Received on : 14 Nov 2015
Article Accepted on : 03 Mar 2016
Article Published : 28 Feb 2016
Plagiarism Check: Yes
Article Metrics
ABSTRACT:
A big challenge, academic world and industry is facing the relationship of modern societies to the environment that requires reinventing the manufacture and use of materials. Synthetic methodologies now a day should be designed to use and generate substances that possess little or no toxicity to human health and the environment The miceowave assisted synthesis and characterization of Zn (II) complexes of Schiff bases derived from three diuretic drugs acetazolamide, furosemide and hydrochlorothiazide are reported here. The ligand and complexes have been suitably synthesized and isolated in crystalline form. Molar conductance values suggest the non-electrolytic nature of the complexes.On the basis of elemental analyses, electrical conductivity data and molecular weight data the adducts are assigned to the general composition [M(L)2].All the adducts are diamagnetic in nature. The IR studies indicate that ligand is coordinated to metal through azomethine nitrogen atom. The diuretic activity of the ligand FSM-SA and complex FSM-SA-Zn was assessed in vivo following the protocol of Institutional Animal Ethical Committee norms. While studying the results of the experiment it was concluded the diuretic activity of the FSM-SA and FSM-SA-Zn was found to be more than the parent drug. Partical size studies further suggest that the size of metal complexes is smaller than the drug molecule.
KEYWORDS:
acetazolamide; Complexes; diuretic; furosemide and Hydrochlorothiazide Schiff base;
Copy the following to cite this article:
Bhattacharya T. A, Budhani P. Spectral and Biological Studies on Microwave Assisted Synthesized Zn(II) Complex of Schiff Base Derived from Sulphonamides. Mat.Sci.Res.India;13(1)
|
Copy the following to cite this URL:
Bhattacharya T. A, Budhani P. Spectral and Biological Studies on Microwave Assisted Synthesized Zn(II) Complex of Schiff Base Derived from Sulphonamides. Mat.Sci.Res.India;13(1). Available from: http://www.materialsciencejournal.org/?p=3796
|
Introduction
Green chemistry is an invention, design ,development and application of chemical product and processes to reduce or eliminate the use and generation of the substances hazardous to the human health and environment.
Microwave assisted organic synthesis is one such component of green chemistry 1
Schiff bases and their metal complexes have been found to posses important biological and industrial applications. There is enormous interest presently in the field of coordination chemistry of ‘3d’transition metal ion with Schiff bases.2-8 Metal ions play a vital role in the biological activity and certain metal complexes of the drug have been found to be more potent than their parent drug.9 Survey of literature reveals that very few studies have been done on metal complexes of Schiff bases of diuretic drugs. We report herein the synthesis and characterization of some bipositive 3d metal ion chelates of diuretic drugs along with the assessment of diuretic activity. In continuation of our previous work on metal complexes of established drugs10-12 the synthesis and structural studies of (AZM-SA)2Zn, (FSM-SA)2Zn, (HCT-SA)2Zn complexes are described below.
Experimental
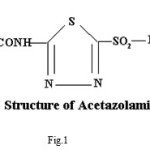
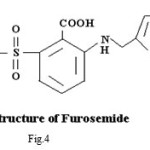
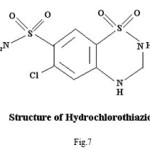
Pure sample of acetazolamidemide (AZM) molecular formula C4H6N4O3S2,, molecular weight 222.24, was obtained from Shalaks Pharmaceuticals Pvt. Ltd New Delhi. Pure sample of furosemide (FSM) molecular formula C12H11N2O5S, molecular weight 330.75, was obtained from Geno PharmaceuticalsPvt. Ltd., Goa.Pure sample of Hydrochlorothiazide (HCT) molecular formula C7H8Cl N3O4S2, molecular weight 297.74, was obtained from Novartis India Pvt. Ltd, Mumbai. These drugs were used as such for the synthesis of ligand. Metal salts were Qualigen chemicals. Solvents used were methyl alcohol and acetone. All the chemicals used were of analytical grade. . Elementa analysis (CHN) were carried out on a Carlo Ebra 1106 Thomas and Coleman analyzer. Conductivity measurments were carried out on Systronics digital direct reading conductivity meter using conductivity cell having cell constant 1.0. The IR spectra of ligand and complexes were recorded in KBr pallets on Perkin Elmer spectrophotometer in the range 4000-400 cm-1. Magnetic susceptibility measurements were done on Vibrating Sample Magnetometer at room temperature. The 1HNMR spectra of ligand and complexes were run in DMSO d6 on a Joel-FX-100 Spectrophotometer using TMS as an internal standard.
Diuretic activity of FSM-SA and (FSM-SA)2Cu complex was assessed at JawaharLalNehruCancerHospital and ResearchCenter, Bhopal, following the protocol and Institutional Animal Ethical Committee norms
General microwave procedure for the synthesis of Schiff bases (AK1-AK5).
Synthesis of Ligand (Drug-Schiff base)
General microwave procedure for the synthesis of Schiff bases
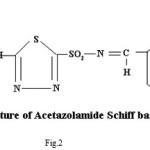
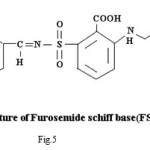
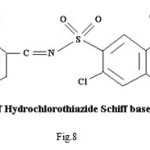
Equimolar solutions of pure drugs (0.01M) and salicyldehyde (0.01M) were taken in aqueous methanol mixture (1:1 ratio). Both the solutions were mixed contents were subjected to microwave irradiation at an interval of 1 min at 400 W for about 8-10 min;The reaction mixture was kept overnight. Crystals of drug-Schiff base (AZM-SA,FSM-SA,HCT-SA) were formed in the reaction mixture, which were washed with 50:50 methanol : water mixture, filtered, dried and weighed. Melting point was recorded
Ligand-Metal ratio and Stoichiometry
To confirm the ligand metal ratio, conductometric titrations using monovariation method were carried out on Systronics conductivity meter0.01M solution of drug-Schiff base was prepared in 60:40 acetone: water mixture and diluted to 200ml with same solvent. This Schiff base solution was titrated against 0.02M metal solutions using monovariation method. After making volume corrections the results were plotted that suggest the ligand metal ratio to be 2:1. Formation of 2:1 complex was further confirmed by Job’s method of continuous variation, modified by Turner and Anderson. The stability constants and free energy change were also calculated.
Synthesis of complexes
0.1M ligand solution was prepared in 60:40 acetone : water mixtures and refluxed for four hours with 0.05M solution of ZnCl2.. Fine crystalline compounds appeared in the solutions. Complexes were washed with acetone, filtered, dried and weighed. Melting points were recorded.
Diuretic activity of FSM-SA and (FSM-SA)2Zn complex
Diuretic activity of FSM-SA and (FSM-SA)2Cu complex was assessed at Jawahar Lal Nehru Cancer Hospital and Research Center, Bhopal, following the protocol and Institutional Animal Ethical Committee norms. The experiment was carried out on mice. Detailed survey of literature indicated that dose prescribed for human being is also safe in mice.25-26
The average volume of urine output for various sets of experiments explains clearly the order of diuretic activities of the drug its Schiff base and metal complexes as follows-
(FSM-SA)2Zn(Complex)>FSM-SA(Schiff base) > FSM(Pure drug)>Water
The order is indicating that a metal complex of the drug is more potent diuretic than its Schiff base and pure drug itself.
Results and Discussion
Ligand-Metal ratio and stoichiometery- The color, melting point, yield percentage, stability constant, free energy change and molar conductance value are summarized in table I & analytical data are summarized in table II.
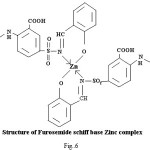
Conductometric studies, monovariation method and Job’s method of continuous variation modified by Turner and Anderson21-22 indicate the formation of 2:1 (L: M) complexes of Schiff base of ligands with Zn ion. . Analytical data of these complexes are in agreement with the composition.
Table 1: Synthesis and physicochemical characteristics of ligand and complexes
|
Ligand\
Complex
|
Ligand/ metal Ratio
|
Colour
|
% Yield
|
Stabilty Constant logK (L/mole)
|
Free energy change – F Kcal/mole)
|
Molar Conductance
(Ω-1 cm2 mole-1)
|
|
AZM-SA
|
–
|
Pale yellow
|
70
|
–
|
–
|
–
|
|
(AZM-SA)2Zn
|
2:1
|
Yellow
|
32
|
11.2006
|
15.6839
|
15.0
|
|
FSM-SA
|
–
|
Pale yellow
|
65
|
–
|
–
|
–
|
|
(FSM-SA)2 Zn
|
2:1
|
Yellow
|
32
|
11.3529
|
15.996
|
14.6
|
HCT-SA
|
–
|
Yellow
|
72
|
–
|
–
|
–
|
|
(HCT-SA)2 Zn
|
2:1
|
White
|
65
|
12.0888
|
17.038
|
11.3
|
Table 2: Analytical data of complexes
|
Ligand \Complex
|
Elemental analysis % Found (Calculated)
|
m.p
0C
|
C
|
H
|
Cl
|
N
|
S
|
metal
|
|
C11H10N4O3S2
|
40.66
(40.49)
|
3.33
(3.06)
|
–
|
17.57
(17.17)
|
9.29
(9.81)
|
–
|
212
|
|
(C11H8N4O3S2)2 Zn
|
36.89 (36.50)
|
2.53 (2.34)
|
–
|
14.53 (16.00)
|
17.21 (17.50)
|
9.11 (9.70)
|
150
|
|
C19H14ClN2O6S
|
52.63
(52.46)
|
3.66
(3.45)
|
8.29
(8.16)
|
6.87
(6.24)
|
7.33
(7.38)
|
–
|
212
|
|
(C19H13ClN2O6S)2Zn
|
48.22 (48.89)
|
3.54 (3.01)
|
7.63
(7.6)
|
6.75
(6.00)
|
6.58
(6.88)
|
7.62
(7.01)
|
150
|
|
C14H11ClN3O5S2
|
41.22
(41.89)
|
2.44
(2.74)
|
8.12
(8.72)
|
10.55
(10.47)
|
15.33
(15.96)
|
–
|
255
|
|
(C14H10ClN3O5S2)2Zn
|
38.15
(38.85)
|
2.59
(2.54)
|
8.77
(8.21)
|
9.70
(9.71)
|
14.14
(14.80)
|
7.86
(7.28)
|
260
|
IR Spectra
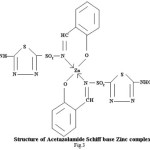
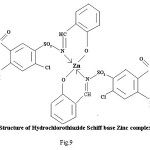
Proposed structure of (AZM-SA)2Zn, (FSM-SA)2Zn, (HCT-SA)2Zn complexes were further confirmed by IR spectra1 data.23-28 In the present work the IR spectra of ligands and their metal complexes were recorded on Perkin Elmer Spectrophotometer in KBr pallets.
Bands observed at 1163 cm-1 1150 cm– 1 and 1152 cm-1are characteristic of SO2-N group. Absorption bands at 1420cm-1, 1400cm-1 and 1427cm-1 shows the presence of chelate ring. Frequencies at 622 cm-1, 680 cm-1 and 676 cm-1 are characteristics of M-O linkage. Bands at 515 cm-1, 583 cm-1 and 609 cm-1 are characteristic of M-N linkage. Frequencies at 892 cm-1, 805 cm-1 and 859 cm-1 indicate the S-N linkage. Absorption bands of m-w intensity due to azomethine linkage have been observed at 1599 cm-1-1602 cm-1. Azomethine linkage is produced by the reaction between drug and salicyldehyde.
Table 3: Infra Red Spectral Bands (cm-1) of (AZM-SA)2Zn, (FSM-SA)2 Zn and (HCT-SA)2Zn complexes-
Lowering of azomethine frequencies in the metal complexes indicate its involvement in coordination29. The disappearance of frequencies of phenolic -OH in complexes supports its involvement in complexation.
|
Ligand/
Complex
|
n (SO2N)
|
n
(HC=N)
|
n
(Phenolic OH)
|
n
(C-S)
|
n
(M-O)
|
n
(M-N)
|
n Aroomatic S)
|
n
(C-Cl
|
Chelate Ring
|
|
AZM-SA
|
1176vs
|
1680 vs
|
3303 vw
|
|
–
|
–
|
700m
|
|
|
|
(AZM-SA)2Zn
|
1163 s
|
1599 s
|
–
|
|
622 s
|
515 s
|
700 s
|
|
1420vs
|
|
FSM-SA
|
1142 vs
|
1672 vs
|
1620 vs
|
|
–
|
–
|
|
789s
|
–
|
|
(FSM-SA)2Zn
|
1150 s
|
1600 vs
|
–
|
|
680 w
|
583m
|
|
630s
|
1400 m
|
|
HCT-SA
|
1152 s
|
1602 m
|
3271 m
|
1059w
|
–
|
–
|
|
776w
|
–
|
|
(HCT-SA)2Zn
|
1152 m
|
1580 w
|
–
|
1058w
|
676 w
|
609 w
|
|
776w
|
1427 w
|
The 1HNMR spectra of FSM-SA ,HCT-SA and (FSM-SA)2Zn & (HCT-SA)2Zn complex
The spectra of ligand(FSM-SA) and its metal complexes were recorded in DMSO.
FSM-SA
The (N=CH) group proton shows triplet peak at δ (8.59-8.63) ppm, which can be assigned to azomethine(HC=N) proton.30In the ligand (FSM-SA) peaks observed at δ( 8.34-8.40)ppm , δ(7.06)ppm and δ( 6.36-6.43)ppm are assigned to aromatic protons due to the different environments around the protons.31 The ligand showed the single peak at δ (7.62) ppm, that corresponds to proton of benzene ring having –COOH substitution at para position. The spectrum showed the presence of singlet at δ (7.32pm) due to (-NH) proton.The signal observed at δ (4.57-4.59) ppm has been assigned to phenolic -OH proton.32 Peaks observed at δ (3.33) ppm can be attributed to TMS (Tetra Methyl Silane).
(FSM-SA)2Zn complex
In The 1HNMR spectra of (FSM-SA)2Zn singlet peak observed at δ (9.162) ppm, is corresponds to –NH proton in .Singlet peak observed at δ (8.44) ppm is corresponds to azomethine (NC=H) proton.In spectrum singlet peak observed at δ (7.571) ppm are corresponds to proton of benzene ring having –COOH substitution at para position.The spectra showed peaks at d(6.936)ppm, d (6.33-6.77)ppm and d (7.244)ppm due to aromatic proton (loc.cit.).In The 1HNMR spectra of (FSM-SA)2Zn singlet peak observed at δ (3.512) ppm is assignable to TMS.The (N=CH) group Proton shows the downfield shifting which supports the coordination of metal to (N=CH) group through nitrogen, which is also supported by IR spectral data. Absence of signal due to phenolic -OH suggests the coordination of phenolic oxygen to the metal. This has also been supported by IR spectral data.The spectra do not show any peak due to coordinated water molecule which indicates square planer geometry of the complexes.
The 1HNMR spectra of HCT-SA and its (HCT-SA)2Zn complex The spectra of ligand(HCT-SA) and its metal complexes were recorded in DMSO.
HCT-SA –The (N=CH) group proton shows a triplet at δ (7.91-7.99) ppm, which corresponds to -NH proton. The peaks observed at δ (7.48) ppm may be attributable to azomethine proton. Spectra of ligand(HCT-SA) showed peak at δ( 6.97)ppm which can be assigned to aromatic protons due to the different environments around the protons.33 Signal observed at δ (4.70-4.73) ppm has been assigned to phenolic -OH proton. Peaks observed at δ (3.33) ppm can be attributed to TMS (Tetra Methyl Silane).
(HCT-SA)2Zn –
The signal observed at δ (7.959-8.003) ppm in 1HNMR spectra of (HCT-SA)2Zn has been assigned to azomethine (NC=H) proton.34 The peaks observed at δ (7.49) ppm in the spectra of (HCT-SA)2Zn are attributable to -NH proton.35 The 1HNMR spectra of (HCT-SA)2Zn showed peaks at δ(6.94)ppm due to aromatic proton (loc. cit.) .Peaks observed at δ (3.33) ppm may be assigned to TMS. The (N=CH) group Proton shows the downfield shifting which supports the coordination of metal to (N=CH) group through nitrogen, 36 which is also supported by IR spectral data. In spectra absence of signal due to phenolic OH suggests the coordination of phenolic oxygen to the metal. This has also been supported by IR spectral data. The spectra do not show any peak of coordinated water molecule, which indicates square planer geometry of the complexes.
Figure 1
Figure 2
Figure 3
Figure 4
Figure 5
Figure 6
Figure 7
Figure 8
Figure 9
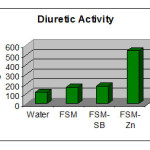
Diuretic Activity
The average volume of urine output for various sets of experiments is shown in tabulated form-
The average volume of urine output for various sets of experiments explains clearly the order of diuretic activities of the drug its Schiff base and metal complexes as follows-
(FSM-SA)2Zn(Complex)>FSM-SA(Schiff base) > FSM(Pure drug)>Water
The order is indicating that a metal complex of the drug is more potent diuretic than its Schiff base and pure drug itself.
Table 4: (observations for group I)Average volume of urine excreted by control animals (Mice were fed with 0.5ml acidified double distilled water)
|
S.N.
|
Vol. of urine
( in µl)
Readings
at 12:00 noon
|
Vol. of urine
( in µl)
Readings
at 3:00 pm
|
Vol. of urine
( in µl)
Readings
at 6:00 pm
|
Average
vol.
of urine
( in µl)
|
A1
(X+Y+Z/3)
|
|
1.
|
58.02
|
X
96.47
|
136.45
|
Y
166.76
|
50.52
|
Z
86.41
|
81.66
|
117.52
|
|
2.
|
126.04
|
175.20
|
61.56
|
120.93
|
|
3.
|
23.33
|
89.80
|
115.31
|
76.17
|
|
4.
|
221.25
|
278.0
|
151.04
|
216.97
|
|
5.
|
63.74
|
154.37
|
53.64
|
90.58
|
Table 5: (observations for group ii (test gr.) Table iv(observations for group ii (tes (0.024 g furosemide) (0.024 g furosemide Schiff base)
|
S.N.
|
Average vol. of urine( in µl)
|
A2
|
|
Mice 1.
|
173.29
|
168.29
|
|
Mice 2.
|
174.96
|
|
Mice 3.
|
168.96
|
|
Mice 4.
|
173.29
|
|
Mice 5.
|
150.96
|
|
S.N.
|
Average vol. of urine(in µl)
|
A3
|
|
Mice 1.
|
189.23
|
181.72
|
|
Mice 2.
|
176.49
|
|
Mice 3.
|
185.83
|
|
Mice 4.
|
184.05
|
|
Mice 5.
|
173.00
|
Table 6: (observations for group v (test gr.) (0.024 g furosemide Schiff base Zn complex)
|
S.N.
|
Average Vol. of urine
( in µl)
|
A4
|
|
Mice 1.
|
530.88
|
542.81
|
|
Mice 2.
|
541.81
|
|
Mice 3.
|
532.48
|
|
Mice 4.
|
576.92
|
|
Mice 5.
|
531.98
|
Table 7: Comparison Of Diuretic Activities Of Various Samples
|
Group
|
Sample given
|
Average vol. of urine
( in µl)
|
|
A1
|
(Water)
|
117.52
|
|
A2
|
(Pure drug Furosemide)
|
168.29
|
|
A3
|
Furosemide salicyldimine Schiff base
|
181.72
|
|
A4
|
Furosemide Schiff base Zn complex
|
542.81
|
Figure 10
The average volume of urine output for various sets of experiments explains clearly the order of diuretic activities of the drug its Schiff base and metal complexes as follows-
(FSM-SA)2Zn(Complex)>FSM-SA(Schiff base)> FSM(Pure drug)>Water
The order is indicating that a metal complex of the drug is more potent diuretic than its Schiff base and pure drug itself.
Acknowledgement
The authors thank the authorities of CDRI ,Lucknow for providing facilities of elemental analysis, IR and electronic spectra. The authors are thankful to Dr. N. Ganesh and Mr. T.M.Malla, Jawahar Lal Nehru Cancer Hospital and Research Center, Bhopal, for providing facilities for in vivo testing of diuretic activity of the ligand and the complexes.
References
- Yadav K., Sharma A., Shrivastava Asian J. Chem. 2012;24(12):5779-81.
- De A. K., Deb D., Bhowmik K. R N and Dutta R. N. J.Indian Chem Soc. 2009;86:76-82.
- Khan M. H. Orient. J. Chem. 2010;26(3):1155-58.
- Mohan J., Kataria S. Indian J. of heterocyclic Chem 1997;6:317.
- Sigel R. K. O.,Song B and Siegl H. J.Am.Chem.Soc. 1997;119:744.
CrossRef
- Kumar A.,Singh G., Handa R. N. Indian J. of Chem. 1999;38:613-617.
- Anant P and Shamim A. Orient. J. Chem. 2009;25(2):391-395.
- Anukul P and Rai B. K. Orient. J. Chem. 2009;25(1):175-179.
- Sachin S etal. Orient. J. Chem. 2009;25(2):433-436.
- Bhattacharya M., Iqbal S. A and Malik S. Orient. J. Chem. 2004;20(4):643-646.
- Iqbal S. A and Siddiqui S., Qureshi R and Desnavi A. Orient. J. Chem. 1985;1:32
- Qureshi R and Iqbal S. A. Orient. J. Chem. 1997;3:13.
- Larkem H.,Larkem A and Messadi D. Egypt J. Chem. 2004;47(4):413-426.
- Kishor K., Gupta B. B and Dheer R. Indian Drug Review, Mediworld Pub. Pvt. Ltd, Delhi. 2006.
- http://www.pettalk.com.
- Yadav R.,Raikwar D. K and Shrivastava K. S. J.Indian Chem Soc. 2009;86:195-198.
- http://www.Wikipedia, the free encyclopedia,
- http://www.patient.co.uk
- Burn J. H. Quart. J. Pharm. 1931;4:517.
- Aston R. Toxicol. appl. Pharmcol., 1959 ,1,272
- Job P. Ann Chim. 1928;10:113.
- Turner S. E and Anderson R. C. J.Am .Chem. Soc. 1949;71:912.
CrossRef
- Naushad A. Orient. J. Chem. 2010;26(3):921-929.
- Bellamy L. J. Chemical Application Of spectroscopy (Int.Sci.Pub.) New York. 1956.
- Nakamotto K. Infrared spectra of Inorganic and co-ordination Compounds, (John Wiley), New York. 1963.
- Weissberger A. Chem. Application of spectroscopy (Int. Sci. Pub.) New York. 1956.
- Rai B. K. Orient. J. Chem. 2010;26(3):1097-1101.
- Manivanan S and Manimaran A. J.Indian Chem Soc. 2008;85:988-995.
- Figgis B. N. Introduction to Ligand Field, Wiely Eastern,New Delhi. 1976;279.
- Lever A. B. P. Inorg. Electronic Spectroscopy, Elsevier. Amsterdam. 1968.
- Chukurovali A., Ibrahim Y and Habibe. Transition Metal Chemistry. 2001;26:619-624.
CrossRef
- Hussain A. et.al. Asian J.of Chem. 2005;17(3):1579- 1584.
- Metha B. H and Tanya G. Asian J. of Chem. 2005;17(3):1539-1544.
- Metha B. H and Salunke A. S. Asian J. of Chem. 2005;11(2):1103- 1110.
- Al-Nowasiar F. M. et al., Material Science Research India, 2005,03(1), 1-6Pathani S. Mansingh and Kailash C. Indian J.Chem. 1995;34:904-907.

This work is licensed under a Creative Commons Attribution 4.0 International License.