Effect of Nickel Doping on Optical Properties of CdS Nanoparticles Synthesized via. Co-precipitation Technique
Suresh Kumar1*  and J. K. Sharma2
1Department of Applied Sciences and Humanities (Physics), Maharishi Markandeshwar University- Sadopur, Ambala, Haryana, India, Pin-134007
2Department of Physics, Maharishi Markandeshwar University- Mullana, Ambala, India,
Corresponding author Email: sureshlakhanpal@gmail.com
DOI : http://dx.doi.org/10.13005/msri/140102
Article Publishing History
Article Received on : 31 May 2017
Article Accepted on : 10 Jun 2017
Article Published : 12 Jun 2017
Plagiarism Check: Yes
Article Metrics
ABSTRACT:
This work presents a comprehensive study on the optical behavior of cadmium sulphide (CdS) nanoparticles under the effect of nickel (Ni2+ ions) doping. The pristine and Ni-doped CdS nanoparticles (CdS:Ni) have been synthesized via. conventional co-precipitation technique and analyzed using UV-visible spectrophotometer. Ni2+ ions with different concentrations (2% and 4%) incorporate in CdS structure, modify it and hence, exhibit a red shift of absorption edge. The increase in Ni2+ ions concentration from 0% to 4% leads to tailor the optical band gap of CdS from 2.70 eV to 2.47 eV. These band gap values are higher than that of bulk CdS which confirm a quantum size effect in the synthesized nanoparticles.
KEYWORDS:
Ni doped CdS nanoparticles; Optical absorption; Optical band gap; Quantum size effect
Copy the following to cite this article:
Kumar S, Sharma J. K. Effect of Nickel Doping on Optical Properties of CdS Nanoparticles Synthesized via. Co-precipitation Technique. Mat.Sci.Res.India;14(1)
|
Copy the following to cite this URL:
Kumar S, Sharma J. K. Effect of Nickel Doping on Optical Properties of CdS Nanoparticles Synthesized via. Co-precipitation Technique. Mat.Sci.Res.India;14(1). Available from: http://www.materialsciencejournal.org/?p=5647
|
Introduction
Nanosized semiconductors having confinement of electrons exhibit number of quantum phenomena such as low dimensional electronic states, increased exciton binding energies and dynamics of carriers.1,2 II-VI semiconducting chalcogenide nanoparticles, especially sulfides have been investigated extensively due to their interesting optoelectronic properties.3 Cadmium sulfide (CdS) is a useful material and widely used in solar cells, lasers, photoconductors, light emitting diodes, transistors and biological markers.2-6 The effectiveness of CdS for advance applications depends upon the ability to dope it with suitable impurities in order to enhance its different properties. Transition metal (TM: Mn, Fe, Co, etc.) doped semiconductors, known as diluted magnetic semiconductors, have attracted widespread research attention due to their prospective applications in the field of science and technology. TM doped CdS offers an opportunity to integrate electrical, optical and magnetic properties into a single material. TM ions in CdS structure may make it useful for nonvolatile memory, magneto-optical and future spintronic devices.2,5,6 TM doped CdS particles have been synthesized by different chemical routes electrodeposition, sol-gel, hydrothermal, chemical vapor deposition, etc.2-6 It has been investigated that Fe and Ni dopants in semiconductors acts as a quenching centers for fluorescence and photoconduction.5-8 Moreover, they leads to diminish the quantum size yields in the visible and near-band-gap region and results in short carrier lifetimes useful in fast optoelectronic devices.5-8 In this work, authors have been investigated some of the optical properties of pristine CdS and Ni doped (CdS:Ni) nanoparticles synthesized by chemical co-precipitation method.
Materials and Methods
In the present study, pristine and CdS:Ni nanoparticles have been synthesized through chemical co-precipitation technique. First, a desired molar proportion of aqueous solution of cadmium chloride (Cd2Cl2H2O: 0.05M) and nickel chloride (Ni2Cl2.6H2O: 0.02M and 0.04M) were prepared using deionized water at room temperature under continuous stirring for 5 h. Then ammonia solution (NH4OH: 25%) was added drop wise in it and was stirred for another 2 h. The role of ammonia is to control the pH and to establish tetra-amine complex of Cd2+ and Ni2+ ions which promotes controlled precipitation in the solution. Finally, the aqueous thiourea solution (H2NCSNH2: 0.05M) was added drop-wise with continuous stirring. The pH of the solution was adjusted to 10.0 and whole reaction process was carried out for 1 h at room temperature. The precipitates with light yellowish to light greenish color were formed as a result of chemical reaction occurred between cadmium chloride, ammonia and thiourea under the effect of varying concentration of nickel chloride. The synthesized nanoparticles were initially cleansed by precipitating the particles with excess distilled water. Thereafter, the dried powders of pristine CdS and CdS:Ni nanoparticles were obtained by successive washing with double distilled water followed by centrifugation at 3000 rpm for 15 min and finally, heating the precipitates at 1000C for 3 h in a hot air oven.
The synthesized nanoparticles were characterized using UV-visible spectrophotometer (ELICO: SL-159) using a 1 cm path length quartz cuvette. Before characterization, a uniform dispersion of nanoparticles in ethanol solution was prepared by ultrasonication for 30 min and using ethanol as reference medium.
Results and Discussion
Optical behavior is one of the significant features of the semiconductor nanoparticles. Today, it is well known fact that as the particle size of semiconductors decreases and approaches to the size of Bohr exciton the optical band gap increases.1,2,9 This could be observed as a shift in the absorption edge toward the lower wavelength side i.e., blue shift in absorption spectra. The synthesized nanoparticles have been characterized for optical absorption using UV-visible spectrophotometer and results have been stated as below. The plot of absorbance (A) and transmittance (T%) as a function of wavelength are depicted in figure 1 and figure 2.
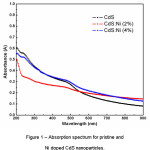
Figure 1: Absorption spectrum for pristine and Ni doped CdS nanoparticles.
Figure 1 displays a decrease in absorption by pristine CdS nanoparticles with increase in wavelength. Moreover, a similar trend in absorbance is also observed for Ni doped CdS (CdS:Ni 2% and 4%) nanoparticles. A low absorbance (0.6 to 0.05) of incident solar radiation by the nanoparticles has been found which shows a decrease from ultraviolet region to visible region of electromagnetic spectrum. The observed optical absorption is < 30% in the visible region for all samples indicating a high transparency. The percentage transmission (T = 10-A) of the incident radiation by the synthesized nanoparticles has been estimatedand plotted in figure 2.
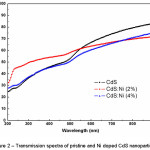
Figure 2: Transmission spectra of pristine and Ni doped CdS nanoparticles
The high transmittance (50% to 90%) in the visible range has been found for all samples. However, pristine CdS nanoparticles shows higher T% in visible range of electromagnetic spectrum than Ni doped CdS nanoparticles. The effect of Ni doping in CdS has been clearly observed from transmission spectrum. In the higher wavelength region of visible light, the T% decreases more for Ni (2%) then Ni (4%). However, in the lower wavelength region upto ultraviolet end, Ni (2%) sample has high T% than Ni (4%). This trend of T% spectra may be due to the incorporation of Ni2+ ions in CdS structure, size variation and packing of crystallites in the presence of Ni2+ dopents.
Absorption coefficient (α) measures the decrease in the intensity of a beam of photons or particles in its passage through particular substance or medium and has been calculated as α = A/λ for changing wavelength range.10 The values of α at absorbance edge region lies between 4.76×105 cm-1 to 5.54×105 cm-1 for pristine CdS, 5.62×105 cm-1 to 6.71×105 cm-1 for CdS:Ni (2%) and 5.91×105 cm-1 to 6.97×105 cm-1 for CdS:Ni (4%). It has been found that the absorption coefficient of synthesized nanoparticles increases with increase in doping content. The absorption edge shifts towards higher wavelength side with Ni doping than the pristine CdS, i.e., red-shifting of absorption edge.
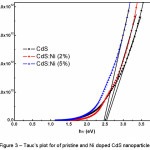
The fundamental absorption, corresponding to the transmission from valence band to conduction band, is used to determine the optical band gap of the material. The optical energy gap has been estimated from Tauc’s plot (figure 3) for direct transition using the relation, where B is an energy independent constant and hν is photon energy.10 The calculated band gap values are 2.54 eV for pristine CdS, 2.51 eV for CdS:Ni (2%) and 2.47 eV for CdS:Ni (4%) nanoparticles. It is noticed that the value of optical band gap decreases with the increase of Ni2+ ion doping (2% to 4%) in CdS structure. Similar trend in optical band gap variation have also been reported for Mn- and Co- doped CdS thin film structures.5,11 Further, these optical band gap values are close to the results already reported by Firdous A., et. al.6 Further, they have synthesized CdS and Ni doped CdS quantum dots using a high-boiling solvent (mercaptoethanol). While in the present work, authors employed commonly available ammonia solution to control the size and arrest the precipitates.
The size of the nanoparticles has been estimated using Brus’s empirical formula9 and found to be 6 nm for pristine CdS, 7 nm for CdS:Ni (2%) and 14 nm for CdS:Ni (4%) which is comparable to Bohr radius (10.4 nm) of CdS.12 Hence, pristine CdS and Ni-doped CdS as synthesized nanoparticles both are observed to fall within the quantum confinement regime.
Figure 3: Tauc’s plot for of pristine and Ni doped CdS nanoparticles
Conclusion
The effect of nickel (2% and 4%) doping on the optical behavior of cadmium sulphide nanoparticles synthesized via. co-precipitation technique has been studied. The absorption spectrum for the wavelength range from 200 nm to 900 nm have been obtained and analyzed to study the optical properties. It has been found that Ni2+ ions incorporate in CdS structure and leads to tailor the optical behavior of CdS. The absorption coefficient of synthesized nanoparticles increases from 4.76×10⁵ to 5.54×105 cm-1 for pristine CdS to 5.91×10⁵ to 6.97×105 cm-1 for CdS:Ni (4%) in the absorbance edge region. The optical study has been revealed a red shift of absorption edge w.r.t. pristine CdS followed by a decrease in the value of optical band gap from 2.54 eV to 2.47 eV as a function of Ni doping. However, these band gap values are higher than that of bulk CdS (2.42 eV).6 The estimated size of nanoparticles are close to Bohr radius of CdS nanoparticles. Hence, it can be concluded that synthesized nanoparticles exhibit a quantum size effect.
References
- Brus L. J. Chem. Phys. 1993;79:5566.
CrossRef
- Saravanan L., Pandurangan A and Jayavel R. J. Nanopart. Res. 2011;13:1621.
CrossRef
- Afzaal M and O’Brien P. J. Mater. Chem. 2006;16:1597.
CrossRef
- Acharya S., Patla I., Kost J., Efrima S and Golan Y. J. Am. Chem. Soc. 2006;128:9294.
CrossRef
- Chandramohan S., Kanjilal A., Tripathi J. K., Sarangi S. N., Sathyamoorthy T and Som T. J. Appl. Phys. 2009;05:123507.
CrossRef
- Firdous A. A., Singh D and Ahmad M. M. Appl Nanosci. 2013;3:13.
CrossRef
- Kumar S., Negi N. S., Sharma P and Sharma V. J.M.M.M. 2014;367:1.
- Rao B. S., Reddy V. R., Kumar B. R and RAO T. S. Int. J. Nanosci. 2012;11:1240006.
CrossRef
- Rai B. K., Bist H. D., Katiyar R. S., Nair M. T. S., Nair P. K and Mannivannan A. J Appl. Phys. 1997;82:1310.
CrossRef
- Tauc J. Amorphous and liquid semiconductors Plenum, New York. 1974.
- Chandramohan S., Kanjilal A., Sarangi S. N., Majumder S., Sathyamoorthy R., Hong C. H and Som T. Nanoscale. 2010;2:1155.
CrossRef
- Thambidurai M., Muthukumarasamy N., Agilan S., Arul N. S., Murugan N and Balasundaraprabhu R. J. Mater. Sci. 2011;46:3200.

This work is licensed under a Creative Commons Attribution 4.0 International License.