XRD-HTA, UV Visible, FTIR and SEM Interpretation of Reduced Graphene Oxide Synthesized from High Purity Vein Graphite
Introduction
Graphene and graphite oxide have gained vast popularity and become wonder materials in the present context of research and development.1-3 The discovery of single-layer graphene which received unprecedented interest because of its two dimensionality and unique physical, chemical and electrical properties such as high intrinsic carrier mobility, quantum electronic transport, tunable band gap, high mechanical strength, elasticity, and superior thermal conductivity etc has paved the way for research in almost all disciplines in modern time.4-7 The emerging of vast array of applications, such as developing of advanced materials with different functionalities, some advancement in modern electronic industry and importantly in energy storage devices are some of the promising areas of research. Moreover, graphene has been extensively studied for applications like sensors, composites, supercapacitors, transparent conductive films, solar cell and gas storage media.7-11 Graphite oxide on the other hand is an intermediate product in the process of graphene synthesis, and it has been recently considered as important precursor for synthesis of graphene.12-13 The desired properties of graphite oxide and reduced graphene oxide greatly depend on their structure, production process and raw materials conditions. The chemical composition (purity) of the raw material, particle size, surface area, surface morphology, and the thermal behavior etc., are some of important parameters which govern the final properties of GO and rGO/graphene.14-17 Initially, approaches of micromechanical cleavage from bulk graphite, and epitaxial growth on SiC wafer were proposed to synthesize graphene.18-20 However, very low yield, hard conditions has restricted the production of graphene on large scale. Chemical exfoliation, where the graphite is converted to graphite oxide first and subsequently converted to graphene would lead to exfoliation of GO into single graphene or few layer graphene-oxide sheets.21-22 Sonication or prolonged stirring, use of several reducing agents, electrochemical reduction, and solvothermal reduction have also been proposed.23-30 The methods have their own pros and cons. With respect to the electrochemical reduction it may only be limited to vary nano area like bio-sensing, and complexity of the technique is also a limiting factor.31 The issues in solvothermal reduction, such as solvent−GO interaction, including polar-polar interaction and hydrogen bonding, low reduction rate are some of the restrictions. Therefore, new trends are being focused on less hazardous and more economical process.4 In recent times, the method of thermal reduction has been found to be effective way of producing graphene or reduced graphene oxide where heating remove the oxygen functional groups from GO surfaces.32 However, the methods described involve higher temperatures (>500 °C) and use of solvents which involved additional cost and unwanted impurities.32-34 It must be stressed that one of the main limitations in the large-scale production of graphene is the lack of systematically study of variable factors. The main objectives of the present study is systematical investigation of the thermal reduction process of graphite oxide to reduced graphene oxide and identifying the impact of the particle size of the raw graphite on GO synthesis process. Sri Lanka’s graphite is said to be one of the world’s best quality natural graphite which has a larger potential for vast variety of applications. In the present study Sri Lankan vein graphite from Bogala mine with purity of about 99 % was used.35 To our best knowledge this is the first systematical study on optimization of the lowest reduction temperature and the particle size of graphite on producing high quality reduced graphene oxide.
Materials and methods
Preparation of materials
Natural graphite was obtained from Bogala mine in Sri Lanka with the average particle size (d50) ~ 111 μm. All other chemicals in the process were used without any further purification. Natural graphite powder was ball milled to prepare graphite with the average particle size (d50) ~ 37 mm and used to synthesize the graphite oxide (GO) and few layer reduced graphene oxide (rGO). Modified hummer method was adopted for the synthesis of GO.22 The product was then ultrasonically agitated to obtain highly dispersed brown-yellow color graphite oxide. For rGO synthesis and other analysis, the GO films were made by depositing the GO dispersion on a polythene sheet and dried at around 80-90 0C for about 12 hours. During the investigation of optimized conversion temperature of GO to rGO, the XRD was equipped with High Temperature Attachment (HTA) that can be used to study the effect of temperature upon thermal reduction systematically. The films of GO were mounted on the Pt plate and the temperature was varied from room temperature to 700 0C at steady heating rate of 5°C/min, and detailed scanning at difference temperature ranges in between. The samples were scanned in between the 2Φ range of 30 to around 1200 at the scanning rate of 2°/s.
Material characterization
X-ray diffraction analysis of graphite, graphite oxide, and the reduced graphene oxide was carried out using Rigaku Ultima IV X-ray Diffractometer with Cu Ka1 radiation (λ = 1.54056 Å). Ultraviolet-visible spectra were recorded for aqueous solutions of graphite oxide by using UV-1800, SHIMADZU spectrophotometer. FTIR characterization was performed using the Bruker Tensor 27 spectrometer. The morphology and the surface characterization of the samples were investigated using a LEO 1420VP Scanning Electron Microscope. In this study, powders and films were used in the morphology analysis. In comparison characterization the total solid content (TSC) of each product of GO and rGO was maintained at the same value.
Results and Discussion
The influence on particle size of graphite on formation of GO and rGO is discussed first. All most all the powder which is especially in micro size tends make agglomeration due to electrostatic forces between particles. This natural phenomenon is also common in graphite powder when the size decreases to micro level or below. These agglomerates are most often hinder to the ultimate properties. Therefore, it is essential to break (or disperse) these agglomerates in to individual particles as much as possible. The graphite obtained from Bogala (commercial) mine has an average particle size (d50) of 111 mm. The optimization of graphite powder dispersion has been investigated systematically in a separate study which is not discussed in detail in this study. However, two methods were employed in dispersion of graphite powder, such as ultrasonication (with and without a dispersion), and ball milling. Considerable influence on the dispersion of graphite particles has been observed for ball-milled graphite than that from ultrasonication. The particle size (d50) of ball-milled graphite powder for at least 3 h is about 37 mm and the powder with ultrasonication at least for 30 mins is about 53 μm. Therefore, based on the reduced particle size data obtained from the two methods, the ball milling was chosen to disperse the graphite powder. GO and rGO synthesized from commercial graphite and ball-milled graphite were compared.
Characterization of GO and rGO from commercial and ball-milled graphite
XRD characterization
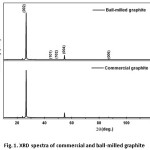
Fig. 1 represents the XRD spectra obtained for commercial (raw) graphite with an average particle size (d50) of 111 mm and ball-milled graphite with an average particle size (d50) of 37 mm respectively. The well-defined characteristic sharp peak for graphite is appeared at 2q ~ 26º with the d-spacing (interlayer spacing) of 3.36 Å in both samples. The sharp XRD peaks in both indicate that they are highly crystalline, and there is no influence for crystalline nature of graphite upon the size reduction. The crystal size of graphite calculated using the Scherrer equation considering the (002) plane, is 37.5 nm.
Figure 1: XRD spectra of commercial and ball-milled graphite
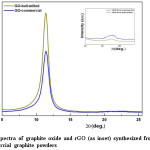
Fig. 2 represents the XRD spectra of GO synthesized from ball-milled and commercial graphite powder. It shows high intensity peak for GO from ball-milled graphite than the GO synthesized from commercial graphite. This may attribute to the fact that reduced particles size of ball-milled graphite has more reactions sites than that of larger particles of commercial graphite. Therefore, oxidation reactions take place more efficiently, leading to effective conversion of graphite to GO than commercial graphite. Characteristic diffraction peak of GO is appeared at around 2q ~ 11.40° due to ~ 7.7 Å basal spacing. It has been reported that the layer distance between 5.9 and 6.7 Å corresponds to dry nature of GO, where as the layer distance for the fully hydrated GO will vary up to 12 Å.36 In addition, it has also been reported that depending on the conditions of oxidation, GO may contain variable amounts of oxygen containing functional groups. GO consists of hydrophilic oxygenated graphene sheets bearing oxygen functional groups on the basal planes and the edges, and removing water completely is not possible.36-37 In one of the study, it shows that the layer distance (d-spacing) of about 8.3 Å is corresponding to an approximately one molecule-thick layer of water that is presumably hydrogen-bonded between the graphene-oxide sheets.37 However, the recorded value in this study (~7.7 Å) is smaller than the previously recorded value in literature, which implies there are certain factors that can reduce the inter-planer distance of GO layers. It may be as a result of drying at 80-90 0C for about 12 hours which would remove the water molecules in the GO layers.
Figure 2: XRD spectra of graphite oxide and rGO (as inset) synthesized from (a) ball-milled and (b) commercial graphite powders
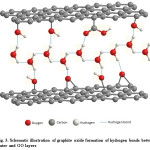
In fact, water molecules can hold the adjacent graphite oxide layers intact via hydrogen bonding thus greatly reduce the inter-planer distance of two adjacent GO layers. Fig. 3 is the schematic representation of the nature of GO/water interactions through hydrogen bonding.
Figure 3: Schematic illustration of graphite oxide formation of hydrogen bonds between water and GO layers
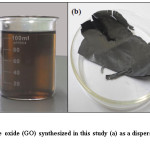
GO formed in the present study can be considered as highly oxidized with various functional groups as shown later. The synthesized GO is brown in color when it gets dispersed in water, see fig. 4 (a). The paper-like film as shown in fig. 4 (b) was also prepared for the purpose of analysis and characterization.
Figure 4: Graphite oxide (GO) synthesized in this study (a) as a dispersion, and (b) as a paper-like film
In recent times, the method of thermal reduction has been found to be an effective way of producing reduced graphene oxide or graphene and has been considered as a green technique, because it involves no hazardous reductants or chemicals as of the chemical reduction. 32 Therefore, in this study the GO synthesized from ball-milled and commercial graphite were thermally reduced at the optimum temperature of 475 0C under in Argon for 30 min to obtain rGO. The XRD spectra obtained for rGO (inset in figure 2) clearly shows that reduction of GO to rGO through the disappearance of the corresponding peaks for GO. This conversion changes the brown color of GO to black. Even though, the peak corresponding to graphite appears at about 2θ = 26° is sharp and intense, the corresponding peak for rGO appears as a broad peak in the 2θ angles ranging from 23° to 28°, which has even low intensity in rGO synthesized from ball-milled graphite. It is a common feature of rGO with few layers to give a broader and less intense peak in the XRD spectrum.38 As observed, there is a difference in broadness and sharpness in rGO, where the rGO from commercial graphite gives a broad peak in the region of 2θ angles ranging from 21° to 28° and rGO from ball-milled graphite gives the particular peak in the region of 2θ angles 25° to 26.7°. The peak position and shape determine the proximity of crystallinity of rGO since the intensity can be changed with the test conditions. Therefore, the comparison is solely based on the peak position and the shape. Considerable change on peak position can be observed for the rGO from ball-milled than that from commercial graphite and the peak shape may have the same influence as a result narrow peak is observed for the rGO from ball-milled graphite. Reduction of particle size increase the surface area available for reaction, thus enhancing the oxidation and reduction process in effective manner. This phenomenon controls the retaining or removing of different functional groups such as COC, COOH, and C-OH in rGO structure and therefore this will lead to the difference in broadness, sharpness, and the diffraction angle of particular peak of the XRD spectrum.
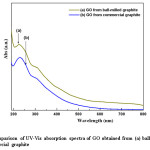
Figure 5: Comparison of UV-Vis absorption spectra of GO obtained from (a) ball-milled and (b) commercial graphite
UV-Vis characterization
Fig. 5 shows the UV-Vis spectra obtained for GO prepared from commercial and the ball-milled graphite. The spectra exhibit a maximum absorption peak at the region of 225-233 nm with a shoulder peak at the region of 270-316 nm. However, the maximum absorption peak for GO from ball-milled graphite appears at the wavelength of ~225 nm, where as for GO from commercial graphite appears at ~229 nm respectively. As anticipated, the reduction of particle size inevitably increases the surface area of the raw graphite. Therefore, the reaction sites of the ball-milled graphite are increased.
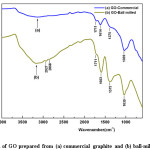
Figure 6: FTIR of GO prepared from (a) commercial graphite and (b) ball-milled graphite
A higher absorption was reported for ball-milled graphite (0.306) than that of commercial graphite (0.245). The absorption peak at about ~229 nm, corresponds to π-π* transition of aromatic C-C bonds, and the shoulder peak is due to n-π* transition of C=O.23 The formation of aromatic type C-C bonds indicates the relative abundance of C-C bonds in GO due to the oxidation process of graphite. In addition, higher absorbance value relevant to shoulder peak reflects the frequent abundance of n-π* transition of the carbonyl groups. Therefore, GO from ball-milled graphite contains comparatively high number of aromatic C-C groups and carbonyl bonds than GO from commercial graphite. Absorbance is an indication for the amount of aromatic C-C and C=O present; nevertheless the degree of conjugation can be expressed in terms of absorption wavelength where the higher wavelength values indicate that the conjugation of the system is well established and lower in energy. When comparing the wavelength values for GO from ball-milled graphite (225 nm) and commercial graphite (229 nm) it is an obvious fact that conjugation in GO from commercial graphite is better than GO from ball-milled graphite. The difference of the absorption wavelengths is an indication for the change in degree of oxidation upon the particle size variation of graphite. On the other hand the presence of higher amount of aromatic C-C bonds with relatively low conjugation means GO from ball-milled graphite contains scattered aromatic C-C bonds throughout the GO layers consequently preventing the proper conjugation and result in higher energy or shorter wavelengths during the absorption of UV. This is an evident for random oxidation throughout the graphite structure due to the reduced particle size in terms of higher surface area for GO from ball-milled graphite whereas GO from commercial graphite does not undergo such oxidation compared to ball-milled graphite due to the presence of relatively large particles. Large particles consequently prevent the access of oxygen throughout the graphite layer, instead, oxidation take place at the vicinity of nearby terminal carbon atoms. Therefore, the conjugation via double bonds is still feasible for GO from commercial graphite compared to the ball-milled graphite, since the aromatic C-C bonds are localized to a small area of graphite layers. Therefore, it would be desirable to reduce the particle size or increase the surface area, so that oxidation will take place effectively which ultimately responsible for the production of few layer graphene.
FTIR characterization
Fig. 6 shows the FTIR spectra of GO prepared from ball-milled and commercial graphite. FTIR analysis provides evidence for the presence of oxygen containing functional groups in both samples, however, the peaks appeared in the FTIR spectrum of GO synthesized from ball-milled graphite are intense, than that of commercial graphite. As shown, fairly broad and intense peak in the region around ~3700 to 3000 cm-1 is responsible for stretching vibrations of hydroxyl group, where the hydroxyl groups may be from absorbed water molecules or phenolic OH or OH from carboxylic groups.39 However, the similar peak does not appear intensely in the FTIR spectrum of GO from commercial graphite instead appeared as very broad and less intense peak. Since the large particles of commercial graphite act as a barrier for the oxidation, only small number of oxygen containing groups are retaining throughout the graphite layers. As a result the amount of water absorb will reduce to a great extent due to less polar character of GO from commercial graphite. Therefore, the characteristic OH stretching cannot be clearly seen or very weak in the spectrum of GO from commercial graphite. The two small peaks near ~2927 cm-1 and ~2868 cm-1 can be observed in GO synthesized from ball-milled graphite, which are corresponding to the hydrogen bonded OH groups of dimeric COOH groups and intra-molecular bonded O-H stretching of alcohols respectively.40 However, these bands are not clear enough to see in the FTIR spectrum of GO from commercial graphite. There is a tendency of being hydrogen bonded among OH groups in proximal vicinity, these OH groups are responsible for cumulative intensity of OH peak in addition to OH of absorbed water hence this spectral changes ensure the extensive oxidation of graphitic structure. The peak in the low frequency region close to 1603 cm−1 in GO synthesized from ball-milled graphite and 1614 cm−1 in GO from commercial graphite is attributable to O-H vibrations of water. The difference in the peak position for the two samples is believed due to the difference in the degree of hydrogen bonding and other interactions. Another intense band near ~1711 cm-1 is corresponding to the C=O stretching vibrations of conjugated acid especially in the form of dimmer appear in GO from ball-milled graphite, indicating that further breakage of larger particles would create more active sites, which are prone to oxidize easily.41 In fact, corresponding IR absorption peaks for functional groups such as C-OH (1375 cm−1), and C-O (1039 cm−1) can be clearly observed in GO from ball-milled graphite.42
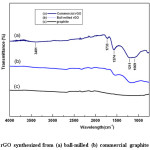
Figure 7: FTIR of rGO synthesized from (a) ball-milled (b) commercial graphite and (c) graphite
Fig. 7 shows the FTIR spectra of rGO with subsequent synthesis of GO from commercial (a) and ball-milled graphite (b). For comparison, the spectrum of graphite (c) is also included. As evident, the absence of graphite and graphite oxide peaks or shifting of peaks is a strong indication for obtaining rGO [43]. During the process of thermal reduction under inert environment these functional groups get reduced or eliminated, and remained as delaminated graphene layers. The number of oxygen containing functional groups is comparatively low in rGO synthesized from ball-milled graphite. There is hardly a peak or a band can be observed in the region of 3700-3000 cm-1 in both rGO samples, but very small band ranging from 3700 to 3000 cm−1 (O-H stretching vibration) can be observed in rGO from commercial graphite. As such, it can be implicated that the rGO thus contains very less amount of O-H groups, which are yet corresponding to structural OH groups or physically absorbed water from the atmosphere during the analysis or the completely reduced carboxylic groups to alcohols. However, the water absorption did not occur significantly due to the non-polar nature of rGO. However, the peak intensity of functional groups of rGO of ball-milled is lower than that of rGO from commercial graphite, indicating that the reduction of GO take place efficiently as a result of higher surface area with the reduced particle size. The appearance of a new peak in the region of 1569-1574 cm−1 attributes to the skeletal vibrations from un-oxidized graphitic domains (aromatic regions of GO) or graphene.40 Mineralization of oxygen functionalities in the rGO structure improves the conductivity of the material, which would be beneficial for application of energy storage devices.
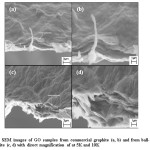
Figure 8: SEM images of GO samples from commercial graphite (a, b) and from ball- milled graphite (c, d) with direct magnification of at 5K and 10K
SEM characterization
The microstructure of GO synthesized from commercial graphite and ball-milled graphite was observed with SEM at two magnifications of 5K and 10K as shown fig. 8. It was observed that particle size reduction has significant affect on GO. As observed, the splitting of graphite stacks into layers is considerably higher in the GO from ball-milled (c & d). The layers within the layer are further disassembled and more crumpled structure is observed. This is the consequence of surface area (due to particle size reduction) that allows efficient oxidation during the process.
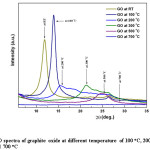
Figure 9: XRD spectra of graphite oxide at different temperature of 100 oC, 200 oC, 300 oC, 500 oC and 700 oC
The SEM images obtained for rGO from commercial and ball-milled graphite show a flower petal-like structure (or wrinkled morphology). Therefore, it has been found difficult to distinguish the difference between the two rGOs with respect to the size of rGO, when they are observed through SEM at present magnification. It was observed that both rGOs seem stacked in fewer layers. However, rGO from balled milled graphite show sharp edges compared with that from commercial graphite. The present work is limited to a preliminary characterization of rGO synthesized from two graphite sources of two particle sizes and detailed analysis of the structure will be done in future studies.
Optimization of conversion temperature of graphite oxide (GO) to reduced graphene oxide (rGO)
Optimum temperature for conversion of GO to rGO was systematically studied using XRD with the GO synthesized from ball-milled graphite. Fig. 9 shows the thermal reduction of GO under different temperatures, from room temperature (RT °C) to 300°C with 100 °C intervals in between, and 300 °C to 700°C with 200 °C intervals in between at the rate of 10°C/min. Evidence of moisture absorption nature of graphite oxide can also be confirmed by considering the outcomes of this analysis as the diffraction angles, d-spacing and intensities are drastically changed with temperature. As discussed earlier GO at room temperature contains relatively fair amount of water (as moisture) among the inter-planar spacing which typically accounts for d-spacing of 7.4 Å. Removal of moisture at fairly high temperature affects on the gradual reduction of d-spacing and display this outcome in x-ray diffraction spectra (Fig. 9, spectrum RT & 100 oC). The diffraction angle (peak position) of any particular diffraction peak increases upon the reduction of d-spacing value in accordance with Bragg’s Law. This change can be clearly observed as the d-spacing of the GO at RT (7.4 Å) gradually reduced to 6.3 Å in GO at 100 oC where the appropriate peak shift from 2q of 11.90° to 13.94° is observed. With respect to the temperature between 100 oC to 200 oC the d-spacing reduced to 5.8 Å from 6.3 Å and eventually the diffraction angle shifts to 13.94° from 11.90°. The changes occur in the shape and intensity of the XRD spectrum of GO from 100°C to 200 °C accounts for breakdown of GO structure upon the heat treatment. In fact, the disappearance of the particular peak responsible for GO at 2q of 11.90° is evidently confirm the diminution of GO structure.
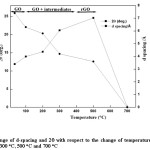
Figure 10: Change of d-spacing and 2Φ with respect to the change of temperature at RT, 100 oC, 200 oC, 300 oC, 500 oC and 700 oC
The successive spectra (spectrum 100 to 700 oC in fig. 9) for GO at high temperatures are recorded for the same sample under similar conditions hence variation of intensities indicate the material loss during the heating process. At the same time spectrum shape may also support in exemplifying the structural alternations occurred in GO during the heat treatment. Therefore, both intensity and spectrum shape can be used as the primary factors to explain the circumstances associated with the heat treatment of GO. As observed, in the temperature between 200 oC to 300 oC the d-spacing reduced to 4.2 Å from 5.8 Å and peak position shifts to 21.17° from 15.27°. With further increase of temperature from 300 oC to 500 oC the d-spacing reduced to 3.6 Å from 4.2 Å and peak position shifts to 24.60° from 21.17°,and from 500 oC to 700 oC the GO structure gets collapsed. Table 1 below clearly shows the phenomenon of particular diffraction peak position that increases upon the reduction of d-spacing due to the temperature variation.
Table 1: Change of d-spacing and 2θ (peak position) upon heat treatment
|
Reduction temperature/oC
|
d-spacing/ ~Å
|
~2θ
|
|
Room Temperature (RT)
|
7.4
|
11.90
|
|
100 °C
|
6.3
|
13.94
|
|
200 °C
|
5.8
|
15.27
|
|
300 °C
|
4.2
|
21.17
|
|
500 °C
|
3.6
|
24.6
|
|
700 °C
|
–
|
–
|
The progressive mass reduction of GO with temperature ensures the heavy consumption of terminal carbons upon oxidation. The weight loss, where the oxygen containing functional groups are detached and terminal carbon atoms escaped from the GO structure in form of its gaseous oxides such as carbon dioxide (CO2) and monoxide (CO) may be the initiative step of the exfoliation of GO layers. The collapsing of GO structure and the progressive oxidation of carbon atoms in GO result in low intensity X-ray diffraction pattern with distorted spectrum shape as in the case of spectrum 200 °C compared to the spectrum of RT & 100 °C. The corresponding XRD spectrum for the temperature of 200 °C clearly appeared as low intense shoulder peak which represents the GO and its intermediates throughout the process of heat treatment. The similar spectrum pattern can be observed at 300 °C where further shift of 2q suggested that GO structure is altered continuously upon the heating process. In fact, GO layers can apart from each other with rapid heat exchange and extensive heating may also burn the carbon present in GO. The weight loss in GO is mainly due to the reduction of number of GO layers, removal of oxygen containing functional groups and especially carbonization where the carbon get burned at higher temperature. This phenomenon can be clearly observed in the XRD spectrum at 500 °C. The broad low intensity peak appeared between 2q of 22°-27.5° is responsible for few layer graphene, though, in most of the studies, it has been shown that the disappearance of corresponding peak for GO at 2q of 11.90° and appearance of corresponding characteristic peak for graphene at 2q of ~26° were dominantly observed.44-45 However, the rGO synthesized during this study with this optimum temperature shows the corresponding 2q position at around ~25°, which is closer to the typical 2q value for graphite and graphene. Further, it has been observed that the thermal treatment of GO above the temperature of 400 °C forms the rGO of few layers, and this conversion is clearly observable in X-ray diffraction pattern at each temperature in between 400 to 520°C. However, above 600 °C there is no residual carbon remained due to the complete burning of carbon. Therefore, it is hard to observe any characteristic peak for any form of carbon in XRD pattern recorded at 700 °C. It was noticeable that rGO is formed in the temperature range of 300 oC to 500 oC. Therefore, in order to ascertain the exact temperature or the temperature range, the study was further extended in different temperature variations. The XRD spectra obtained for the temperatures of 300 oC, 400 oC, and 500 oC clearly showed that the corresponding 2q value for rGO was appearing typically in the region of 400 oC and 500 oC. For example, the peaks for 300 oC and 400 oC are broader and less intense and almost appearing at 2q range of ~ 20 o and ~28o, the given peak positions are 23.67 o and 23.51 o respectively, and the corresponding d-spacing remained almost unchanged, the values are 3.76 Å and 3.78 Å. However, the peak at the temperature of 500 oC appears at 2q range of ~ 25o and 26o, the given peak position is at about 26.02 o and the d-spacing of 3.6 Å, i.e. typical value for graphene, see table 2. Therefore, further screening of optimum temperature or the temperature range at which the GO converts to rGO was extended by narrowing down the particular temperature range into small intervals. Fig. 10 below clearly shows the change of d-spacing and corresponding 2q at each temperature from RT to 700 oC. From RT to 150 °C, the GO structure still remain, whereas from 150 °C to 400 oC the intermediate form of GO can be observed. Typical rGO formation occurred in the region of 400 to 520 °C.
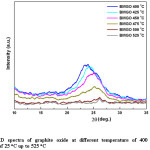
Figure 1: XRD spectra of graphite oxide at different temperature of 400 oC, with the increment of 25 oC up to 525 oC
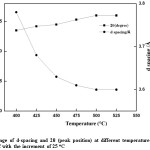
Figure 12: Change of d-spacing and 2θ (peak position) at different temperature from 400 oC up to 525 oC with the increment of 25 oC
Since no considerable change is XRD from 300°C to 400°C, the range 400°C to 500°C was taken for detail analysis. According to the XRD spectra and the d-spacing and the 2q peak as shown in fig. 11 and the table 2, it was evident that beyond the temperature of 425 oC, there is a change in both d-spacing and 2q, where d-spacing is around ~3.68 Å and diffraction angle around ~24.20o respectively. This was further enhanced when the temperature is increased to 450 oC, where the d-spacing is around ~3.63 Å and the corresponding 2q position around ~24.50o. Above this temperature (450 oC) the d-spacing shows slight reduction and remained almost the same value of 3.60 Å with the 2q value of ~26o which is the typical 2q value for graphene. And the peaks are broader and less intense than the peaks for lower temperatures, below 475 oC, indicating that the crystalline structure is in nano scale. During this study it has been found that the optimum temperature for rGO synthesis by thermal reduction under inert atmospheric condition falls in the region of ~450-500 oC, however, optimum temperature range for rGO synthesis under these conditions would be around ~475-500 oC, see table 2 and fig. 12 for further clarification. The broader and low intense peak corresponding to the rGO appears at 2q value of ~25o, and the corresponding d-spacing is around ~3.60 Å. The crystalline size of the rGO as calculated from the plane of (002) is around 1.56 nm.
Table 2: Change of d-spacing and 2θ (peak position) at different temperature from 400 oC up to 525 oC with the increment of 25 oC
|
Reduction temperature/oC
|
d-spacing/ ~Å
|
~2θ
|
|
400 °C
|
3.78
|
23.51
|
|
425 °C
|
3.68
|
24.20
|
|
450 °C
|
3.63
|
24.50
|
|
475
|
3.61
|
25.32
|
|
500
|
3.60
|
26.02
|
|
525
|
3.60
|
26.02
|
Synthesizing of single graphene sheets is not practically viable especially from chemical ways, the fact that it will yield few layers thick graphene layers. The specific surface area of single graphene sheets is as high as ~2620 m2 g−138,46. In the present study, the BET surface analysis revealed the specific surface areas of GO and rGO synthesized during the optimized process are 337 m2g-1 and 403 m2g-1 respectively. Therefore, it can be conferred that the rGO synthesized from ball-milled graphite would have ~ 2-6 layers, suggesting that the rGO synthesis process is optimized. However, as revealed by the SEM analysis of GO and then rGO shows that the exfoliation of graphite layers is promoted in ball-milled or particle size reduced graphite than the use of bulk graphite. Therefore, BET surface area analysis can be used as a supportive tool to observe the exfoliation of graphite. This low temperature thermal reduction is cost effective and process is simple with respect to other thermal reduction found in the literature, where higher temperatures, like 1050 °C are used, and they also claim that the maintain of these conditions (rapid reduction) are not easy.46-48
Conclusions
Raw materials properties such as particle size of the graphite powder greatly affect the properties of GO and rGO. The GO synthesized from reduced particle size of graphite showed efficient conversion of graphite to GO and GO to rGO through XRD, UV-Vis, FTIR and SEM. The thermal reduction temperature of GO to rGO was systematically optimized in the present study, and it was revealed that the optimum temperature for preparation of rGO is ~ 475 oC and the surface area measurements revealed that rGO formed is 2-6 layers. The results showed that oxidation process has been effectively taken place with smaller particle size. Thus the resultant rGO with less functional groups as confirmed by FTIR analysis which will be beneficial for future applications. The present systematical study on particle size and reduction temperature of GO will be useful when concern novel applications of graphene based materials.
Acknowledgment
Financial assistance by Treasury Grant 11/00/04 and NRC Grant 12-022
References
- Su C. Y.,Xu Y., Zhang W., Zhao J., Tang X., Tsai C. H., Li L. J. 2009;21:5674-5680.
- Novoselov K. S., Geim A. K., Morozov S., Jiang D., Zhang Y., Dubonos S. a., Grigorieva I., Firsov A. Science. 2004;306:666-669.
CrossRef
- Wu Z. S., Ren W., Gao L., Liu B., Jiang C., Cheng H. M. Carbon. 2009;47:493-499.
CrossRef
- Warner J. H., Schaffel F., Rummeli M., Bachmatiuk A. Newnes. 2012.
- Elias D., Nair R., Mohiuddin T., Morozov S., Blake P., Halsall M., Ferrari A., Boukhvalov D., Katsnelson M., Geim A. Science. 2009;323:610-613.
CrossRef
- Singh V., Joung D., Zhai L., Das S., Khondaker S. I.,Seal S. 2011;56:1178-1271.
- C. Knieke, A. Berger, M. Voigt, R.N.K. Taylor, J. Röhrl, W. Peukert., Carbon. 2010;48:3196-3204.
CrossRef
- D. Yang, A. Velamakanni, G. Bozoklu, S. Park, M. Stoller, R.D. Piner, S. Stankovich, I. Jung, D.A. Field, C.A. Ventrice Jr, R.S. Ruoff., Carbon. 2009;47:145-152.
CrossRef
- R. Ruoff, Graphene: Calling all chemists, Nat Nano. 2008;3:10-11.
CrossRef
- K. Novoselov, S. Morozov, T. Mohinddin, L. Ponomarenko, D. Elias, R. Yang, I. Barbolina, P. Blake, T. Booth, D. Jiang. 2007;244:4106-4111.
- D.A. Brownson, D.K. Kampouris, C.E. Banks. 2011;196:4873-4885.
- S. Gilje, S. Han, M. Wang, K.L. Wang, R.B. Kaner., Nano letters. 2007;7:3394-3398.
CrossRef
- X.-Z. Tang, W. Li, Z.-Z. Yu, M.A. Rafiee, J. Rafiee, F. Yavari, N. Koratkar., Carbon. 2011;49:1258-1265.
CrossRef
- A.K. Geim, K.S. Novoselov., Nature materials. 2007;6:183-191.
CrossRef
- A.K. Geim., Science. 2009;324:1530-1534.
CrossRef
- W. Jiang, G. Nadeau, K. Zaghib, K. Kinoshita., Thermochimica Acta. 2000;351:85-93.
CrossRef
- N.A. Kotov., Materials science: carbon sheet solutions, Nature. 2006;442:254-255.
CrossRef
- C. Berger, Z. Song, X. Li, X. Wu, N. Brown, C. Naud, D. Mayou, T. Li, J. Hass, A.N. Marchenkov. Science. 2006;312:1191-1196.
CrossRef
- W. Zhang, J. Cui, C.a. Tao, Y. Wu, Z. Li, L. Ma, Y. Wen, G. Li., Angewandte Chemie. 2009;121:5978-5982.
CrossRef
- X. Fan, W. Peng, Y. Li, X. Li, S. Wang, G. Zhang, F. Zhang., Advanced Materials. 2008;20:4490-4493.
CrossRef
- S. Niyogi, E. Bekyarova, M.E. Itkis, J.L. McWilliams, M.A. Hamon, R.C. Haddon., J. Am. Chem. Soc. 2006;128:7720-7721.
CrossRef
- M. Hirata, T. Gotou, S. Horiuchi, M. Fujiwara, M. Ohba., Carbon. 2004;42:2929-2937.
- J. Paredes, S. Villar-Rodil, A. Martinez-Alonso, J. Tascon., Langmuir. 2008;24:10560-10564.
CrossRef
- D. Li, M.B. Mueller, S. Gilje, R.B. Kaner, G.G. Wallace., Nature nanotechnology. 2008;3:101-105.
CrossRef
- V.C. Tung, M.J. Allen, Y. Yang, R.B. Kaner., Nature nanotechnology. 2009;4:25-29.
CrossRef
- A.B. Bourlinos, D. Gournis, D. Petridis, T. Szabó, A. Szeri, I. Dékány., Langmuir. 2003;19:6050-6055.
CrossRef
- S. Wang, P.J. Chia, L.L. Chua, L.H. Zhao, R.Q. Png, S. Sivaramakrishnan, M. Zhou, R.G.S. Goh, R.H. Friend, A.T.S. Wee., Advanced Materials. 2008;20:3440-3446.
CrossRef
- S. Stankovich, D.A. Dikin, R.D. Piner, K.A. Kohlhaas, A. Kleinhammes, Y. Jia, Y. Wu, S.T. Nguyen, R.S. Ruoff., Carbon. 2007;45:1558-1565.
CrossRef
- M. Zhou, Y. Wang, Y. Zhai, J. Zhai, W. Ren, F. Wang, S. Dong., Chemistry-A European Journal. 2009;15:6116-6120.
CrossRef
- S. Dubin, S. Gilje, K. Wang, V.C. Tung, K. Cha, A.S. Hall, J. Farrar, R. Varshneya, Y. Yang, R.B. Kaner., ACS nano. 2010;4:3845-3852.
CrossRef
- J. Ping, Y. Wang, K. Fan, J. Wu, Y. Ying., Biosensors and Bioelectronics. 2011;28:204-209.
CrossRef
- W. Chen, L. Yan, P.R. Bangal., Carbon. 2010;48:1146-1152.
CrossRef
- M.J. McAllister, J.-L. Li, D.H. Adamson, H.C. Schniepp, A.A. Abdala, J. Liu, M. Herrera-Alonso, D.L. Milius, R. Car, R.K. Prud’homme., Chemistry of Materials. 2007;19:4396-4404.
CrossRef
- W. Gao, L.B. Alemany, L. Ci, P.M. Ajayan., Nature chemistry. 2009;1:403-408.
CrossRef
- Sydney’s Bora Bora acquires stake in Lankan graphite mine firm – See more at: http://www.ft.lk/2014/06/26/sydneys-bora-bora-acquires-stake-in-lankan-graphite-mine-firm/#sthash.NiM1KpiK.dpuf, 2014.
- A. Lerf, A. Buchsteiner, J. Pieper, S. Schöttl, I. Dekany, T. Szabo, H.P. Boehm., J.Physics.Chem.Solids. 2006;67:1106-1110.
CrossRef
- D.A. Dikin, S. Stankovich, E.J. Zimney, R.D. Piner, G.H.B. Dommett, G. Evmenenko, S.T. Nguyen, R.S. Ruoff., Nature. 2007;448:457-460.
CrossRef
- I.R. Kottegoda, X. Gao, L.D. Nayanajith, C.H. Manorathne, J. Wang, J.-Z. Wang, H.-K. Liu, Y. Gofer., J. Mater. Sci.Technol. 2015;31:907-912.
CrossRef
- K. Wang, J. Ruan, H. Song, J. Zhang, Y. Wo, S. Guo, D. Cui., Nano Lett. 2011;6:1-8.
- T. Szabó, O. Berkesi, I. Dékány., Carbon. 2005;43:3186-3189.
CrossRef
- S. Jin, L.-s. Xie, Y.-l. Ma, J.-j. Han, Z. Xia, G.-x. Zhang, S.-m. Dong, Y.-y. Wang., Journal of Physics: Conference Series, IOP Publishing. 2009;012040.
- S. Stankovich, R.D. Piner, S.T. Nguyen, R.S. Ruoff., Carbon. 2006;44:3342-3347.
CrossRef
- M. Khenfouch, M. Ba. 2012.
- L. Tang, Y. Wang, Y. Li, H. Feng, J. Lu, J. Li., Advanced Functional Materials.2009;19:2782.
CrossRef
- I.R.M. Kottegoda, N.H. Idris, L. Lu, J.-Z. Wang, H.-K. Liu., Electrochimica Acta. 2011;56:5815-5822.
CrossRef
- P. Lian, X. Zhu, S. Liang, Z. Li, W. Yang, H. Wang., Electrochimica Acta. 2010;55:3909-3914.
CrossRef
- H.C. Schniepp, J.-L. Li, M.J. McAllister, H. Sai, M. Herrera-Alonso, D.H. Adamson, R.K. Prud’homme, R. Car, D.A. Saville, I.A. Aksay., The Journal of Physical Chemistry B. 2006;110:8535-8539.
CrossRef
- X. Li, G. Zhang, X. Bai, X. Sun, X. Wang, E. Wang, H. Dai., Nature nanotechnology. 2008;3:538-542.
CrossRef

This work is licensed under a Creative Commons Attribution 4.0 International License.