Determination of Young’s Modulus of Aluminium, Copper, Iron, Brass and Steel Alloys by Using Double Exposure Holographic Interferometry (DEHI) Technique
H. R. Kulkarni1  , S. N. Shukla2 and M. B. Dongare3
1KJEI’s KJ College of Engineering and Management Research, Pune, Maharashtra, India
2Matoshri College of Engineering and Research Center, Eklahare Nasik, Maharashtra, India
3Department of Physics, Shivaji University Kolhapur, Maharashtra, India
Corresponding author Email: hrkulkarni@rediffmail.com
DOI : http://dx.doi.org/10.13005/msri/140207
Article Publishing History
Article Received on : 22 Sept 2017
Article Accepted on : 04 Oct 2017
Article Published : 13 Oct 2017
Plagiarism Check: Yes
Article Metrics
ABSTRACT:
Double Exposure Holographic Interferometry (DEHI) technique has wide applications in the field of science and engineering. DEHI can be used to determine very small surface changes in an object at very small interval of time.
In present case, DEHI technique is used to record the hologram of the same object at different times subjected to different loads. This method has been advantageously used to determine Young’s Modulus (Y) of Aluminium, Copper, iron, brass and some steel alloys. It is found that the values of Y obtained by using DEHI technique are in close agreement with standard values of Y available for respective metals and their alloys. The method is also used to make standard relation between effect of carbon composition and Y of steel alloys.
KEYWORDS:
DEHI; Double Exposure Holographic Interferometry; Young’s Modulus
Copy the following to cite this article:
Kulkarni H. R, Shukla S. N, Dongare M. B. Determination of Young’s Modulus of Aluminium, Copper, Iron, Brass and Steel Alloys by Using Double Exposure Holographic Interferometry (DEHI) Technique. Mat.Sci.Res.India;14(2)
|
Copy the following to cite this URL:
Kulkarni H. R, Shukla S. N, Dongare M. B. Determination of Young’s Modulus of Aluminium, Copper, Iron, Brass and Steel Alloys by Using Double Exposure Holographic Interferometry (DEHI) Technique. Mat.Sci.Res.India;14(2). Available from: http://www.materialsciencejournal.org/?p=6086
|
Introduction
DEHI technique is used to record the holograms of same objects at different times.1 This method has some advantages over other techniques particularly for studying transient phenomenon. The analysis is, of course, not significantly different from analysis given for single exposure technique and the resulting interference pattern is determined by the phase difference between the object wave in first position and object wave in second position.2 This technique can be used in the study of stress-strain relation, and fluid mechanics,3 fracture mechanics for non-destructive testing.4 Hologram interferometry can also be used to show changes of shape in a specimen.5
The qualitative determination of mechanical strain[6] on surface of arbitrary shaped object through holographic interferometry requires the solution of following three basic problems.
- Relation between surface strain and surface displacement;
- Relation between derivation of the surface displacement and the interference fringes in the image plane;
- Interpolation of interference fringe pattern and quantitative determination of interference phase.
The development of practical technique for obtaining quantitative information7 from double- exposure hologram is still one of the most interesting problems in holographic interferometry. The applications of holographic interferometry techniques to non-destructive testing have received a great deal of attention in recent years. Because of its extreme sensitivity, holographic interferometry allows for the detection of small defects and anomalies in diffuse three dimensional objects.7-9 Various holographic methods are described10-12 to measure 3-D displacements of object under loading. These include viewing of surface of object through different points of hologram through various angles and counting the number of fringes that pass through the point under consideration between the two exposures is very small or less than one fringe. The success of holographic non-destructive testing13 of a material, however, depends upon the stressing technique adopted. The stressing should deform the body under test in such a manner that the ‘good’ areas are distinguished from the ‘bad’ areas simply by studying the interference generated on the holographic interferogram.
Measurement of Young’s Modulus14
Youngs modulus of material can be calculated using deflection equation of cantilever. The deflection equation of cantilever is given by,
ΔZ = (WL3) / (3YI) …..(1)
Where,
W = load applied in kg
L = effective span in cm
Y = Young’s modulus in kgF / cm2
I = moment of inertia in cm4, can be obtained from physical dimensions of
cantilever. Its value for rectangular beam of width ‘a’ and thickness ‘b’
is ab3 / 12.
Equation (1) can be written as ,
Y = (WL3) / (3 I ΔZ)……………………(2)
Where ΔZ is measured from holographic interferometry.
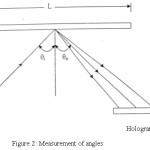
Let θi and θo be the angle defining the directions of illumination and observation respectively. These are measured from the geometry of figure as shown in Figure 2. The path difference Δ between two rays scattered from the two identical points on the object is given by,
Δ = ΔZ. n. (Cos θi + Cos θo)………………………..(3)
Where, n = refractive index, usually 1 for air.
If there are N fringes produced up to the span length L of the cantilever counted from the fixed end, then,
ΔZ = Nλ / (Cos θi + Cos θo) …………………(4).
Substituting the value of ΔZ in equation 2. Then the value of Young’s modulus can be calculated from,
Y = WL3 (Cos θi + Cos θo) / (3 I Nλ)……………(5)
Experimental Results of Y for metals and alloys
Young’s modulus has been determined for aluminium, copper, iron, brass and certain steel alloys by using DEHI technique. The samples for this purpose were obtained from Mayura Steel Industries, Kolhapur. The constitution of alloy and their composition as well as their dimensions are given in Table 1.
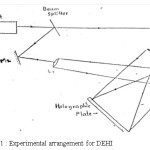
The experimental arrangement for recording double – exposure hologram with loaded objects is as shown in Figure 1.
Figure 1 : Experimental arrangement for DEHI
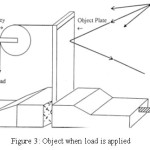
Double exposure holograms of the corresponding objects were recorded at two different situations. One at its normal state and other at deformed state due to application of load. For the application of load, string and pulley arrangement was used as shown in Figure 3.
Figure 2: Measurement of angles
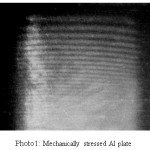
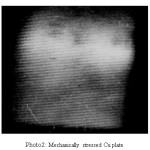
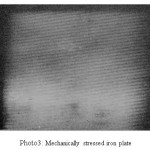
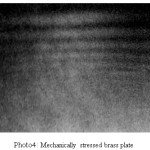
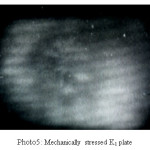
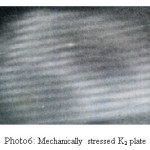
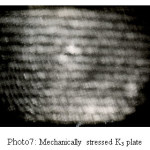
The holograms were recorded on 8E75HD holographic plate using He-Ne laser of 2mw. The two beam off axis method was used to record the holograms. The holograms were processed in usual manner. The reconstructed holograms revealed number of fringes located on the surface of metal plates. The exposure time of 7sec each was given to both the exposures. The object dimensions have been accurately measured and presented in Table 2. The number of fringes were accurately counted. These are shown in Photographs 1-7. Making the use of Equation (5), Young’s modulus of material of object has been determined. The values of Y calculated by this method have been entered in Table 2 along with object dimensions and angle of illumination and scattering of light from the object surface.
Figure 3: Object when load is applied
Photo 1: Mechanically stressed Al plate
Photo 2: Mechanically stressed Cu plate
Photo 3: Mechanically stressed iron plate
Photo 4: Mechanically stressed brass plate
Photo 5: Mechanically stressed K1 plate
Photo 6: Mechanically stressed K2 plate
Photo 7: Mechanically stressed K3 plate
Results and Discussion
With the help of DEHI technique, the calculated values of Y for Aluminium, Copper, brass, iron and steel alloys plates are given in Table 2. It is found that the values of Y calculated are in close agreement with the standard values.
In case of steel alloys K1, K2 and K3 (general titles given) value of Y found is higher than that of iron. It is mostly dependent of percentage of carbon in that alloy. This percentage of carbon is given in Table 1. The carbon content of K1, K2, and K3 is in the increasing order resulting to increase in their Young’s modulus. For sample K1, it is 1.04 times greater than that of iron and K2 it is observed 1.08 times greater while for K3 1.19 time greater that of iron. The values determined for samples K1, K2, and K3 are not available anywhere. The values of Y determined for Aluminium, Copper, brass, and iron are in close agreement with the available standard values. These results indicate DEHI technique can be used to determine the standard values of Young’s modulus of elastic material. This result confirms that the values of Y determined for samples K1, K2, and K3 are correct.
Table 1: Constituents of steel alloys
|
Constituents %
|
Steel samples
|
|
K1
|
K2
|
K3
|
|
C
|
0.184
|
0.40
|
1.17
|
|
Mn
|
0.93
|
0.090
|
13.15
|
|
Si
|
0.41
|
0.42
|
0.42
|
|
S
|
0.037
|
0.039
|
0.004
|
|
P
|
0.030
|
0.038
|
0.066
|
|
Cr
|
0.099
|
0.763
|
0.23
|
|
Ni
|
—
|
3.258
|
0.038
|
|
Mo
|
30.00
|
0.231
|
—
|
Table 2: Determined values of Y
|
Object Plate
|
Length L in cm
|
Breadth ‘a’ in cm
|
Depth ‘b’ in cm
|
Load applied W in kg
|
No of fringes located on the object
|
Angle of (in degrees)
|
Young’s Modulus Y in kgF / cm2
|
|
Illumination
θi
|
Scattering
θo
|
Determined values
|
Standard Values
|
|
Al
|
3.00
|
3.00
|
0.110
|
0.007
|
10
|
6˚ 30’
|
46˚
|
0.672 x 10⁶
|
0.70 x 10⁶
|
|
Cu
|
1.80
|
3.00
|
0.110
|
0.650
|
11
|
6˚ 00’
|
44˚ 30’
|
1.240 x 10⁶
|
1.240 x 10⁶
|
|
Iron
|
3.00
|
3.00
|
0.120
|
0.140
|
36
|
5˚ 30’
|
48˚
|
2.130 x 10⁶
|
2.00 x 10⁶
|
|
Brass
|
3.00
|
3.00
|
.011
|
0.015
|
15
|
6˚ 30’
|
44˚ 30’
|
0.970 x 10⁶
|
0.90 to 1 x 10⁶
|
|
K1
|
2.40
|
3.00
|
0.380
|
3.00
|
12
|
4˚ 30’
|
48˚
|
2.230 x 10⁶
|
——
|
|
K2
|
2.40
|
2.90
|
0.353
|
3.00
|
15
|
7˚ 00’
|
46˚
|
2.311 x 10⁶
|
——
|
|
K3
|
2.50
|
3.00
|
0.310
|
1.800
|
13
|
4˚ 30’
|
48˚
|
2.549 x 10⁶
|
——
|
References
- Helfinger L. O., Brooks R. E and Wuerker R. F. J. Appl. Phys. 1966;37:642.
- Tanner L. H. J. Sci. Instrum. 1967;44:1015.
CrossRef
- Dudderar T. D. Exp. Mech. 1969;9:281.
CrossRef
- Steel W. H. Interferometry, Cambridge University Press. 1968;188.
- Dandliker R., Eliasson B., Ineichen B., Motterer F. M. The engineering use of Coherent Optics, Cambridge University Press, Cambridge. 1976;99-117.
- Marom E., Friesem A. A.,Avnear W. E. Applications of Holography and Optical data processing, Pergamon Press, London. 1977;225.
- Robertson E. R. The Engineering Uses of Coherent Optics, Cambridge University Press. 1976.
- Erf R. K. Holographic Non-destructive Testing, Academic Press, New York. 1974.
- Hariharan P. Optical Holography, Principles, Techniques and Applications, Cambridge University Press. 214. 1984.
- King III P. W. Appl. Opt. 1974;13:231.
CrossRef
- Hansche B. D., Murphy G. G. Appl. Opt. 1974;13:630.
CrossRef
- Sarma A. V. S. S. S. R., Kutty G. T. G. Appl. Opt. 1978;17:3964.
CrossRef
- Mehta P. C., Mohan D.,Bhan C.,Lal P., Rhidaynath R. Optics and Laser Technology. 1982;269.
CrossRef
- Sirohi R. S. A Course of Experiments with He-Ne laser, Wiley Eastern Limited, New Delhi. 1986;67.

This work is licensed under a Creative Commons Attribution 4.0 International License.