Effect of Ag Doping on Properties of Al –Doped Zno Nanoparticles VARIES AS Zn1-X-Yagxalyo
Neha Sharma* and Sanjay Kumar
Department of Physics, Arni University, Kangra (Himachal Pradesh)
Corresponding author Email: nehasdr6600@gmail.com
DOI : http://dx.doi.org/10.13005/msri/140210
Article Publishing History
Article Received on : 09 Oct 2017
Article Accepted on : 16 Oct 2017
Article Published :
Plagiarism Check: Yes
Article Metrics
ABSTRACT:
In present study, undoped ZnO, Zn0.8Ag0.2O, Zn0.8Al0.2O and Zn0.6Al0.2Ag0.2O samples are synthesized by simple solution method. X-ray diffraction (XRD), Scanning Electron Microscopy (SEM), Energy-Dispersive X-ray spectroscopy (EDX) and UV-visible (UV-Vis) spectroscopy are used to perform the characterization of undoped, doped and codoped samples. XRD analysis is exposed that hexagonal wurtzite crystalline structure obtained for undoped, doped and codoped samples without any extra representation of impurity phases. The crystalline size is when evaluated by using Scherrer, It has 44, 49, 41and 37nm for undoped ZnO, Zn0.8Ag0.2O, Zn0.8Al0.2O and Zn0.6Al0.2Ag0.2O samples. Similarly, the crystalline size and strain are also evaluated by Williamson hall (W-H) and size strain plot (SSP) for the undoped, doped and codoped nanoparticles. The evaluated crystalline size by SSP is three times greater than the result of the scherrer method. The SEM exposes that surface morphology of nanoparticle samples, in this case is the formation of large agglomeration in spherical shape with nanocrystallites of undoped and doped ZnO with apparent and definite boundaries. EDX points out the replacement of Al2+ and Ag+ with Zn2+ in ZnO matrix and consequences in the development of single-phase Zn1−x−yAgxAlyO. The blueshift is shown in UV-Vis absorption spectra because the band gap value increases with the increase in doping, except Ag+ doped ZnO nanoparticles.
KEYWORDS:
Scherrer method; Scanning Electron Microscopy; UV-Visible spectroscopy; X-ray diffraction
Copy the following to cite this article:
Sharma N, Kumar S. Effect of Ag Doping on Properties of Al–Doped Zno Nanoparticles Varies as Zn1-X-Yagxalyo. Mat.Sci.Res.India;14(2)
|
Copy the following to cite this URL:
Sharma N, Kumar S. Effect of Ag Doping on Properties of Al–Doped Zno Nanoparticles Varies as Zn1-X-Yagxalyo. Mat.Sci.Res.India;14(2). Available from: http://www.materialsciencejournal.org/?p=6135
|
Introduction
Recently, research areas were more concentrated on the nanotechnology.1 The nanotechnology is acted as more active for new or improved properties which are exhibited by nanoparticles. The unique physical and chemical properties are shown by the particles then these particles used as in important property of the material in the development of novel nanodevices.2 In terms of nanotechnology, Zinc Oxide (ZnO) has one of advanced and unique material in optoelectronics applications because of its direct band gap and large exciton binding energy.3 The formation of ZnOnanorods,nanowires can be developed by as-prepared powders that useful and attractive in many application in the light emitting devices, transparent conducting oxides, optoelectronic devices,UV photodetectors and ferromagnetic devices.4-6 For the last few decades, most of the researchers have been focused on different transition metals such as Fe, Co, Ni, and Mn that is used in ZnO as a dopant which useful to get a advanced and modified properties of ZnO nanoparticles which is useful to make a dramatic change in most of a applications.7-9 The n-type doping in ZnO is a native defect because it acquires conductivity by Zinc interstitials and oxygen voids.10 The production of p-type ZnO is also performed by using silver doping which is effective against recent research.11 These transition metals doped and co-doped in ZnO nanoparticles were synthesized by following different routes, for example, co-precipitation, solution route, sol-gel, hydrothermal method etc12-14 Sebastian et. al. have revealed that a single phase established by the X-ray diffraction (XRD) for the co-doped ZnO nanoparticles and these samples are prepared by co-precipitation method and SEM reveals that there is no surface prediction of any impurities and EDX to verify the hope for stoichiometry15 Lojkowskiet. al. confirm that different dopant Mn2+, Ni2+, Co2+ and Cr3+ ions are doped in ZnO nanopowders that are synthesis by using a solvothermal reaction and X-ray diffraction was detected that no phases or compounds other than ZnO and as impurities content increases which responsible to decrease the grain size of doped powders samples from 20nm.16
In this present study, we have prepared the undoped, doped and co-doped ZnO nanoparticles by using chemical precipitation method and then these as-prepared nanoparticles have been characterized for the structural, optical and morphological properties.
Experimental and Methods
Zn1-x-yMxAgyO samples have been prepared by chemical precipitation method. The samples have been coded as; undoped ZnO–A, Zn0.8Ag0.2O–B, Zn0.8Al0.2O–C and Zn0.6Al0.2Ag0.2O–D. The undoped and co-doped nanoparticles samples have been found due to its different composition of solutions in the host ZnO material. All Chemicals of high purity (99%) which were used for synthesis ZnO nanoparticles. For cleaning and mixing the sample, deionized water was used instead of simple water. The accurate amount of Zinc acetate, aluminum nitrate and silver nitrate, each of three samples was mixed with 20ml of ethanol and 80 ml of deionized water separately. All the solutions were mixed well with a magnetic stirrer. Ammonia solution was prepared by adding 0.44 ratios of ammonia in deionized water. Ammonia solution was added dropwise into the above solution to adjust pH value of the solution. Added NaOH solution (4.4 gm of NaOH pallet dissolve in 20ml of ethanol and 80 ml of deionized water) till complete precipitation occurred. After that put, this solution to 600C for 60 minutes in a water bath, hold the solution to room temperature. Filtered the precipitates with help of the double distilled water and ethanol. All the samples were dried in the oven at 5000C, for 80 minutes
Material characterization
In XRD studies were performed with PANalytical X’Pert PRO to identify structural properties in range 20°≤2θ≤90° by using with Cu-Kα and difference in each step having a size of 0.013°/min at room temperature. Then after analysing the structural parameters were evaluated from two different (Scherrer method, W-H plot and SSP) methods which helpful for getting the different parameters like crystallite size and lattice strain for all doped ZnO NPS. Morphology was checked by scanning electron microscopy (JSM- 6610LV, JEOL) for the gold-coated palettes. The energy-dispersive X-Ray spectra (EDX) study was performed with SEM (Scanning electron microscopy) instrument. The ultraviolet-visible spectrometer (Hitachi UV-3300) was used to identify the optical parameters in the range 200–800 nm.
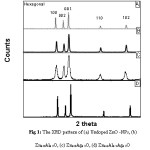
Figure 1: The XRD pattern of (a) Undoped ZnO -NPs, (b) Zn0.8Al0.2O, (c) Zn0.8Ag0.2O, (d) Zn0.6Al0.2Ag0.2O
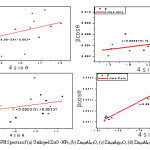
Figure 2: WH Spectra of (a) Undoped ZnO -NPs, (b) Zn0.8Al0.2O, (c) Zn0.8Ag0.2O, (d) Zn0.6Al0.2Ag0.2O
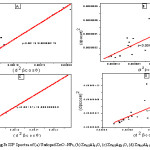
Figure 3: SSP Spectra of (a) Undoped ZnO -NPs, (b) Zn0.8Al0.2O, (c) Zn0.8Ag0.2O, (d) Zn0.6Al0.2Ag0.2O
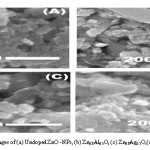
Figure 4: SEM images of (a) Undoped ZnO -NPs, (b) Zn0.8Al0.2O, (c) Zn0.8Ag0.2O,(d) Zn0.6Al0.2Ag0.2O
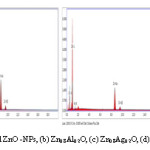
Figure 5: EDS Spectra of (a) Undoped ZnO -NPs, (b) Zn0.8Al0.2O, (c) Zn0.8Ag0.2O, (d) Zn0.6Al0.2Ag0.2O nanoparticles
Figure 6,7
Experimental Detail
Xrd Diffraction
The structural properties were analyzing the effect of addition of Ag and Al codoped ZnO nanoparticles by using to study the XRD. Fig 1 is representing the XRD series for codoped ZnO nanoparticles. The single phase is confirmed by preferred orientations (100), (002), (101) i.e. three higher most peaks (all the peaks) of hexagonal wurtzite crystalline structure of ZnO matching with ICDD card. There is no additional peaks are observed corresponding to Ag and Al nanoparticles and it indicates the purity of the samples. The Debye-Scherer’s formula are used to calculate the average nanocrystalline size ( D = Kλ/βDcosθ) where D (nm) is the crystalline size, k is a constant (equal to 0.94) λ and is the wavelength (equal to 1.542 Å), βD is full width at the half maximum intensity, and is position of peak.
The intensity of XRD peaks increased compared to the undoped ZnO, Al-, and (Ag–Al) co-doped ZnO samples. This was reason for the occurrence of strain because of insertion of Ag-, Al-, and Ag–Al elements change by Zn ions in the ZnO pattern, which is also reported in literature.17 Ag- doped ZnO sample shows an opposite pattern because the Ag+ with ionic radii (1.15 Å) which is larger than ionic radii of the Zn2+ (0.74 Å) element, it resulted in tensile strain in ZnO lattice and thus lattice parameters increase for Ag doped ZnO nanoparticles. But for Al doped ZnO, the ionic radii of the host element i.e. Zn2+ (0.74Å) which is greater than the ionic radii of doped material i.e. Al3+ (0.54Å). Therefore, compressible strain exists ZnO lattice and thus lattice parameters decreases. The crystalline size was evaluated by the scherrer method of undoped, doped and co-doped NPs as shown in Table 1.
Table 1: The structure parameter of un-doped, Zn0.8Ag0.2O, Zn0.8Al0.2O and Zn0.6Al0.2Ag0.2O doped ZnO NPs
|
Sample
label
|
Lattice parameter
|
V
|
Scherrer
|
W-H Method
|
Size strain plot(nm)
|
|
a =b
|
c
|
D(nm)
|
D(nm)
|
ε
|
D(nm)
|
ε
|
u
|
|
|
Undoped ZnO
|
3.248
|
5.202
|
47.41
|
44
|
58
|
1.23
|
121
|
1.73
|
51.4
|
123
|
|
Zn0.8Ag0.2O
|
3.249
|
5.213
|
47.54
|
49
|
67
|
3.45
|
130
|
2.23
|
63.9
|
133
|
|
Zn0.8Al0.2O
|
3.247
|
5.194
|
47.46
|
41
|
43
|
3.12
|
91
|
3.58
|
69.5
|
154
|
|
Zn0.6Al0.2Ag0.2O
|
3.242
|
5.181
|
47.46
|
37
|
32
|
4.79
|
68
|
4.93
|
74.8
|
194
|
where D (nm) is the crystalline size, k (equal to 0.94) is a constant and λ (equal to 1.542 Å) is the wavelength, βD is full width at the half maximum intensity, and The intensity of XRD peaks was increased by angles as compare to the undoped ZnO, Al-, and Ag–Al i.e codoped ZnO samples. This was reason for the occurrence of strain because of insertion of Ag-, Al-, and Ag–Al elements change by Zn ions in the ZnO pattern, which also clearly similar as shown in literature.12 For Ag- doped ZnO sample was shown an opposite pattern because the Ag+ was showed the ionic radii (1.15 Å) which smaller than ionic radii of the Zn2+ (0.74 Å) element so tensile strain show existence in ZnO lattice and then lattice parameters increases for Ag doped ZnO nanoparticles. But for Al doped ZnO, the ionic radii of the host element i.e. Zn2+ (0.74Å) which is greater than the ionic radii of doped material i.e. Al3+ (0.54Å) so compresssible strain show existence in ZnO lattice and then for Ag doped ZnO nanoparticles, lattice parameters increases. The crystalline size was evaluated by the scherrer method for undoped, doped and codoped NPs as shown in Table 1.
Williamson–Hall (W–H) methods
The W-H connection is able to get through by following equation13:
βhkl = βs+βD (1)
Which means both crystallite size (D) and lattice strain (ԑ) was an evaluated by the value of βhkl of a Bragg peak.Due to crystal imperfections and distortion reasons that obtained βD value arising are related by € = βs/tan θ. Because of small crystallite size, the Bragg peak broadening happens due to Debye-Scherrer formula (D=kλ/βs Cosθ) then substitute in equation (1) we get.
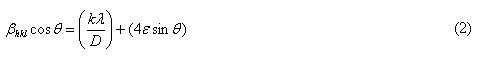
From this equation (2), ε is inversely proportional to the crystalline size. The graph plotted between the values of βhkl Cosθ and sinθ. the crystallite size value was calculated by the value of y-intercept and strain by slope obtained from the graph. The outcomes of W-H plot were evaluated for undoped, doped and codoped NPs as shown in Table 1.
Size- Strain plot method
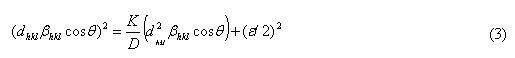
In this case of size-strain parameter can be found that both the crystalline size and the microstrain get together. From equation (3), the graph plotted between (dhklβhkl cosθl)2 VS (d2hklβhkl) The crystalline size was calculated by using slope of the linearly fitted data and strain get by y- intercept, as from equation (3). For undoped, doped and codoped NPs, the results were evaluated for SSP method as shown in Table 1.
Scanning Electron Microscope Analysis
The scanning electron microscope (SEM) analysis is used to find out the morphology of undoped, doped and co-doped samples studies. The particles are spherical in shape with large agglomeration. The aggregation is approximately controlled and smaller in size in case of undoped ZnO but large aggregation trends follow Ag-doped ZnO, Al-doped ZnO, co-doped (Ag, Al) samples which are shown in a reliable and identical shape. It clearly indicated that the crystalline size is relatively same as that of the SEM measurement. The particle size goes on increasing because of dopant Ag as shown in Fig 4(B) and Fig 4(C), Al-doped NPS are of smaller particles size i.e. it both the cases both dopants disperse equally in the different sites. SEM micrograph shows that for undoped ZnO nanoparticles size is smaller than the co-doped ZAAlO nanoparticles, which is also confirmed by the XRD results. Wu et. al. has also reported on SEM images for undoped Al-doped ZnO that effects by Ag nanoparticles as Ag/Zn = 0.05 (b), 0.10 (c) and 0.15 (d) at.%, which indicate the almost similar effect of doping particles as shown in studies.19
The undoped, doped (Ag, Al) and co-doped nanoparticles are studied by EDX for finding the detail of elemental composition as shown in Fig 5(a)-(d). The EDX analysis confirms the presence of Ag, Al, O, and Zn in differently doped samples (as evaluated in Table 2), without any extra interpretation of another impurity element [20]. In case of co-doped (Zn1-x-yAgxAlyO) samples are to hold Ag, Zn, Al, and O elements concluded by EDX spectrum. The EDX spectral peaks of O shown at 0.4keV; Zn come into existence at 0.5, 8.4, and 9 keV; as Ag signal indicted its appearance at 0.4, and 5keV, Al peak comes at 0.75keV respectively. The EDX results additionally to confirm XRD results, which reveal that Ag- and Al-co-doped ZnO is effective as prepared by the chemical precipitation method.
Table 2: Atomic and weight percentage of Zn1−x−yAgxAlyO nanoparticles
|
Compound
|
Wavelength (nm)
|
Band gap (eV)
|
Urbach energy (eV)
|
weight percentage
|
Atomic percentage
|
|
Zn
|
Ag
|
Al
|
O
|
Zn
|
Ag
|
Al
|
O
|
|
undoped ZnO
|
403
|
3.07
|
2.045
|
87.9
|
——
|
—–
|
12.1
|
77.5
|
—-
|
—–
|
22.5
|
|
Zn0.8Al0.2O
|
398
|
3.10
|
1.656
|
73.0
|
——
|
0.16
|
26.8
|
71.8
|
—-
|
0.17
|
28.03
|
|
Zn0.8Ag0.2O
|
398
|
3.11
|
1.863
|
64.3
|
0.15
|
—–
|
35.5
|
60.2
|
0.18
|
—–
|
39.62
|
|
Zn0.6Al0.2Ag0.2O
|
396
|
3.13
|
0.953
|
51.9
|
0.2
|
0.19
|
47.7
|
59.7
|
0.2
|
0.2
|
39.9
|
Table 3: Variations of band gap and Urbach energy (eV) with increase in concentration of co-doped elements in ZnO
|
Compound
|
Wavelength (nm)
|
Band gap (eV)
|
Urbach energy (eV)
|
|
| |
|
undoped ZnO
|
398
|
3.10
|
1.656
|
|
|
Zn0.8Al0.2O
|
398
|
3.11
|
1.863
|
|
|
Zn0.8Ag0.2O
|
403
|
3.07
|
2.045
|
|
|
Zn0.6Al0.2Ag0.2O
|
396
|
3.13
|
0.953
|
|
Optical Studies
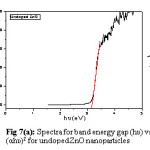
The UV-Vis spectrophotometer is used to analyse the optical properties of these undoped, doped and codoped ZnO (Zn1-x-yAgxAlyO) nanoparticles, against as a function of wavelength varies with absorption having range 200-800nm at room temperature. The following relationship is used to determined the energy band gap for absorption
α =A (hv-Eg)n (4)
Where hv= energy, α=absorption coefficient (α=4πK/λ; k is the absorbance, λ is wavelength), Eg= band gap, A= constant, n=2 for allowed direct band gap. The plot shows the variation between the direct Vs photon energy for doped ZnO nanoparticles. This variation has been help to analyse, the band gap and Urbach energy value. Suwanboon et. al. also find out optical band value for al doped ZnO nps.15 The Urbach energy (eV) was also used find out the disorder of these ZnO nanoparticles shown in table 1, which express in this relation.
From figure 2, the value of band gap increases with increases in the concentration of silver doping. The opposite result is shown for Urbach energy (eV) of Zn1-x-yAgxAlyO nanoparticlesfor all samples as compile in table 2 i.e. it value decrease with increase the silver content. This reveals that blue shifted occur for ZnO samples which are indicate by representation of increase occur in the band gap value. These band gap values are acquire by doped and codoped samples, which will be effective as in optoelectectronic properties.
Conclusions
In this study, the undoped, doped and codoped ZnO nanoparticles were studied to find out their structural, morphological, optical properties that were synthesised by using a chemical precipitation route. The structure and crystalline size of samples is calculated by X-ray diffraction (XRD). XRD analysis shows that the prepared samples are single phase and have hexagonal wurtzite structure phase in the range of 20-600. The crystallite size is decreased for undoped, Al doped and codoped ZnO nps except for Ag doped ZnO nps as increased with concentration of dopant concentrations, which is determined using Scherrer, Williamson hall method and size strain plot (SSP) method. The SEM micrographs are showing that agglomeration forms in spherical shape for undoped, doped and codoped ZnO. EDS has shown the formation of doped and codoped (Al2+ and Ag+) in ZnO matrix. The blueshift was indicated for undoped, doped and codoped ZnO in case of UV-Vis absorption spectra.
References
- Tsukazaki A., Ohtomo A., Onuma T., Ohtani M., Makino T., Sumiya M & Ohno H. Nat. mat. 2005;4:42.
CrossRef
- Nomura K., Ohta H., Ueda K., Kamiya T., Hirano M & Hosono H. Sci. 2003;300:1269-1272.
CrossRef
- Lee S. Y., Shim E. S., Kang H. S., Pang S. S & Kang J. S. Thi. Sol. Fil. 2005;473:31-34.
CrossRef
- Kshirsagar S. D., Inamdar D., Gopalakrishnan I. K., Kulshreshtha S. K & Mahamuni. Sol. Stat. Comm. 2007;143:457-460.
CrossRef
- Zhang S. B., Wei S. H & Zunger A. Phys. Rev. B. 2001;63:075205.
CrossRef
- Look D. C & Claflin B. Phys. Stat. sol. (b). 2004;241:624-630.
CrossRef
- Ryu Y. R., Zhu S., Look D. C., Wrobel J. M., Jeong H. M & White H. W. J. Crys. Grow. 2000;216:330-334.
CrossRef
- Chauhan R., Kumar A & Chaudhary R. P. Arch. of Appl. Sci. Res. 2010;2:378-385.
CrossRef
- Karunakaran C., Rajeswari V & Gomathisankar P. Mater. Sci. Semicond. Proces. 2011;14:133-138.
- Sebastian K. C., Chawda M., Jonny L & Bodas D. Mat. Lett. 2010;64:2269-2272.
CrossRef
- Lojkowski W., Gedanken A., Grzanka E., Opalinska A., Strachowski T., Pielaszek R & Kurzydłowski K. J. J. Nanopart. Res. 2009;11:1991-2002.
CrossRef
- Zeferino R. S., Flores M. B & Pal U. J. appl. Phys. 2011;109:014308.
CrossRef
- Bindu P & Thomas S. J. Theore & Appl. Phys. 2014;8:123-134.
- Wu K. Y., Wang C. C & Chen D. H. Nanotech. 2007;18:305604.
CrossRef
- Suwanboon S., Amornpitoksuk P., Haidoux A & Tedenac J. C. J. Allo & Comp. 2008;462:335-339.
CrossRef

This work is licensed under a Creative Commons Attribution 4.0 International License.