Electrochemical Corrosion Behavior, Microstructure and Soldering Properties of Tin Based Alloys
Abu Bakr El-Bediwi* , Reham Samir and Mustafa Kamal
Metal Physics Lab., Physics Department, Faculty of Science, Mansoura University, Egypt
Corresponding author Email: baker_elbediwi@yahoo.com
DOI : http://dx.doi.org/10.13005/msri/150102
Article Publishing History
Article Received on : 3 October 17
Article Accepted on : 5 January 17
Article Published : 01 Feb 2018
Plagiarism Check: Yes
Article Metrics
ABSTRACT:
Microstructure, thermal behavior, wettability and electrochemical corrosion parameters of Sn82Bi15Zn3, Sn77Bi15Zn3Sb5, Sn79Bi15Zn3Ag3 and Sn81.3Bi15Zn3Cu0.7 [Jagadeees1] alloys have been studied and analyzed. The contact angles of used alloys varied from 21° to 31° which is less than 90° (low contact angle). That is meant, wetting process of these alloys are very favorable and the fluid will spread over a large area of the surface. Melting temperature values of Sn82Bi15Zn3, Sn77Bi15Zn3Sb5, Sn79Bi15Zn3Ag3 and Sn81.3Bi15Zn3Cu0.7 [Jagadeees2] alloys are lower than tin based eutectic solder alloys, (Sn- Zn or Sn- Cu or Sn- Sb), by 11% to 22%. Scanning electron microscope, x-ray analysis and differential scanning calorimetry graphs show that, the used alloys contained different phases. Corrosion rate of Sn82Bi15Zn3 alloy in HCl varied after adding alloying elements. Sn77Bi15Zn3Sb5 alloy has lowest corrosion rate value.
KEYWORDS:
Corrosion parameters; Wettability; Microstructure; Thermal behavior; Tin based alloys
Copy the following to cite this article:
El-Bediwi A. B, Samir R, Kamal M. Electrochemical Corrosion Behavior, Microstructure and Soldering Properties of Tin Based Alloys. Mat.Sci.Res.India;15(1)
|
Copy the following to cite this URL:
El-Bediwi A. B, Samir R, Kamal M. Electrochemical Corrosion Behavior, Microstructure and Soldering Properties of Tin Based Alloys. Mat.Sci.Res.India;15(1). Available from: http://www.materialsciencejournal.org/?p=6807
|
Introduction
Soldering is a low temperature metallurgical joining process. Solder joining is a wetting process followed by a chemical reaction. The chemical reaction following wetting is between the molten solder and the joining metallurgy to form an intermetallic phase region at the interface. Solder alloys are characterized by the melting temperature being a strong function of composition. Microstructure, elastic modulus, thermal behavior and contact angle of Sn96.5Ag3.5 alloy varied after adding bismuth content.1 Melting temperature, elastic modulus and contact angle values of Sn99.3Cu0.7 alloy decreased after adding bismuth or bismuth-indium.2[Jagadeees1] The elastic modulus, internal friction, contact angle, melting temperature and specific heat of Sn91Zn9 alloy decreased after adding indium.3 Also melting temperature, elastic modulus and thermal diffusivity of Sn96Zn4 alloy decreased after adding bismuth.4 Strength of bismuth-tin-zinc alloy increased after adding alloying elements such as silver or indium5 Microstructure, thermal parameters, internal friction, wettability and electrochemical corrosion behavior of Bi30Sn50Sb10Al5Zn3Cu2, Bi25Sn61Sb5Zn4Al3Ag2, and Bi20Sn60Sb7Al5Zn3Cd3Cu2, alloys have been studied.6 Microstructure, wettability behavior, corrosion parameters, thermal properties of quaternary bismuth- tin based alloy have been studied using different experimental techniques.7 Tin- zinc eutectic alloy has been considered as a candidate for lead free solder materials because of its low melting point, excellent mechanical properties and low cost8–10. Also mostly solders are based on Sn-containing binary and ternary alloys as alloying elements such as Zn, Bi, Cu, Ag, Sb and so on. 11-13 Tin- zinc eutectic solder alloy is poor wettability, reliability, strength, easy oxidation and microvoid formation. Some researchers14-17 operated to improve the properties of Sn-Zn alloy by adding small amount of Bi, Cu, In, Ag, Al, Ga, Sb, Cr, Ni, Ge elements to develop Pb free alloys. The aim of our work is to improve soldering properties (melting temperature and contact angle) and corrosion behavior of tin based lead free solder alloys compared to tin eutectic, (Sn- Zn or Sn- Cu or Sn- Sb) alloys or lead- tin commercial solder alloy by changing their composition by adding different alloying elements.
Materials and methods
Tin, bismuth, zinc, antimony and copper metals with purity more than 99.9 % were used[Jagadeees1] to prepare Sn82Bi15Zn3, Sn77Bi15Zn3Sb5, Sn79Bi15Zn3Ag3 and Sn81.3Bi15Zn3Cu0.7 [Jagadeees2] alloys. Each alloy composition has a weight of 20 gram by using the digital milligram scale and the metals were added according to their weight per cent (wt. %) in the specimen. These alloys were melted and then normal casted on graphite substrate[Jagadeees3] . The samples were prepared in convenient shape for all tests such as microstructure, thermal parameters and corrosion behavior. Microstructure of used alloys was performed using Shimadzu X–ray Diffractometer, (Dx–30, Japan) Cu–Ka radiation with l=1.54056 Å at 45 kV and 35 mA and Ni–filter, in the angular range 2q ranging from 0 to 100° in continuous mode with a scan speed 5 deg/min and scanning electron microscope (JEOL JSM-6510LV, Japan). The polarization studies were performed using Gamry Potentiostat/Galvanostat with a Gamry framework system based on ESA 300. Gamry applications include software DC105 for corrosion measurements, and Echem Analyst version 5.5 software packages for data fitting. The differential scanning calorimetry (DSC) thermographs were obtained by Universal V4. 5A TA Instrument [Q20 (V24. 11 Build 124)] with heating rate 10 k/min in the temperature range 0-400 °C.
Results and Discussion
Microstructure
X-ray analysis
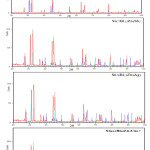
Figure 1 shows x-ray diffraction patterns of Sn82Bi15Zn3, Sn77Bi15Zn3Sb5, Sn79Bi15Zn3Ag3 and Sn81.3Bi15Zn3Cu0.7 alloys which have sharp lines corresponding to tetragonal β-Sn phase, hexagonal Bi phase, Zn phase and small lines represented undetected intermetallic compounds with dissolved atoms (Cu or Sb or Ag) in matrix formed a solid solution. The details of x-ray analysis of usedalloys which comes from the x-ray device (2θ, Int. %, d Å, FHWM and area) and x-ray cards (phase and Miller indices) are listed in Table 1. The x-ray analysis show that, the feature of formed phases such as crystallinity (peak intensity), crystal size (peak broadness) and orientations (peak position, 2θ) for Sn82Bi15Zn3 alloy changed after adding antimony, silver and copper. That is because these elements atoms dissolved in matrix alloy formed a solid solution with undetected phases that agree with pervious work6,7 and other.8- 10
Figure 1: x-ray diffraction patterns of used alloys
Table 1: x-ray diffraction analysis of used alloys
|
X- ray analysis of Sn82Bi15Zn3 alloy
|
|
2q
|
d Å
|
Phase
|
hkl
|
Int. %
|
FWHM
|
Area
|
|
27.7026
|
3.22025
|
Bi
|
012
|
14.14
|
0.1968
|
7.77
|
|
31.1119
|
2.87471
|
Sn
|
101
|
55.11
|
0.1968
|
30.27
|
|
32.5097
|
2.75423
|
Sn
|
101
|
100
|
0.2165
|
60.42
|
|
38.5038
|
2.33814
|
Bi
|
104
|
5.82
|
0.1968
|
3.2
|
|
40.1776
|
2.24451
|
Bi
|
110
|
6.68
|
0.2165
|
4.04
|
|
44.2828
|
2.0455
|
Bi
|
015
|
16.9
|
0.1968
|
9.28
|
|
45.2954
|
2.0021
|
Sn
|
211
|
67.56
|
0.2165
|
40.81
|
|
49.2336
|
1.85078
|
Bi
|
202
|
3.6
|
0.2755
|
2.77
|
|
55.7043
|
1.65015
|
Sn
|
301
|
14.33
|
0.1771
|
7.09
|
|
62.8549
|
1.47854
|
Sn
|
112
|
25.84
|
0.1771
|
12.77
|
|
64.059
|
1.45362
|
Sn
|
400
|
6.84
|
0.1771
|
3.38
|
|
64.8801
|
1.4372
|
Sn
|
321
|
17.48
|
0.1771
|
8.64
|
|
72.6214
|
1.3019
|
Sn
|
420
|
4.32
|
0.1968
|
2.37
|
|
73.3889
|
1.29017
|
Sn
|
411
|
9.72
|
0.1574
|
4.27
|
|
79.7631
|
1.20233
|
Sn
|
312
|
22.21
|
0.1771
|
10.98
|
|
89.6001
|
1.09409
|
Bi
|
306
|
7.06
|
0.1771
|
3.49
|
|
95.6897
|
1.03908
|
Sn
|
332
|
6.29
|
0.192
|
4.55
|
|
X- ray analysis of Sn77Bi15Zn3Sb5 alloy
|
|
2q
|
d Å
|
Phase
|
hkl
|
Int. %
|
FWHM
|
Area
|
|
27.7042
|
3.22007
|
Bi
|
012
|
17.16
|
0.2558
|
11.31
|
|
31.1312
|
2.87297
|
Sn
|
101
|
57.74
|
0.1968
|
29.29
|
|
32.4757
|
2.75703
|
Sn
|
101
|
100
|
0.2362
|
60.88
|
|
38.4274
|
2.34261
|
Bi
|
104
|
9.83
|
0.2558
|
6.48
|
|
40.1071
|
2.2483
|
Bi
|
110
|
7.81
|
0.1968
|
3.96
|
|
44.2389
|
2.04743
|
Bi
|
015
|
22.19
|
0.1968
|
11.26
|
|
45.2974
|
2.00202
|
Sn
|
211
|
66.53
|
0.2362
|
40.5
|
|
46.432
|
1.95571
|
Bi
|
021
|
2.28
|
0.4723
|
2.78
|
|
49.2009
|
1.85193
|
Bi
|
202
|
6.04
|
0.1968
|
3.07
|
|
55.6878
|
1.6506
|
Sn
|
301
|
17.09
|
0.2755
|
12.14
|
|
56.5179
|
1.62831
|
Bi
|
024
|
3.33
|
0.2362
|
2.03
|
|
62.8382
|
1.47889
|
Sn
|
112
|
22.52
|
0.1771
|
10.28
|
|
64.1038
|
1.45272
|
Sn
|
400
|
5.66
|
0.2755
|
4.02
|
|
64.869
|
1.43742
|
Sn
|
321
|
18.33
|
0.2362
|
11.16
|
|
72.6852
|
1.30091
|
Sn
|
321
|
6.48
|
0.3149
|
5.26
|
|
73.3804
|
1.2903
|
Sn
|
411
|
10.83
|
0.1574
|
4.4
|
|
79.7308
|
1.20274
|
Sn
|
312
|
20.74
|
0.1771
|
9.47
|
|
89.5697
|
1.09439
|
Bi
|
306
|
6.33
|
0.1771
|
2.89
|
|
95.7368
|
1.03955
|
Sn
|
431
|
5.62
|
0.1771
|
2.57
|
|
X- ray analysis of Sn79Bi15Zn3Ag3 alloy
|
|
2q
|
d Å
|
Int. %
|
Phase
|
hkl
|
FWHM
|
Area
|
|
27.6551
|
3.22567
|
38.81
|
Bi
|
012
|
0.2755
|
8.52
|
|
30.9967
|
2.88513
|
100
|
Sn
|
200
|
0.2952
|
23.53
|
|
32.5771
|
2.74868
|
96.75
|
Sn
|
101
|
0.3936
|
30.35
|
|
36.834
|
2.44021
|
19.43
|
Zn
|
002
|
0.2952
|
4.57
|
|
38.4397
|
2.34189
|
14.96
|
Bi
|
104
|
0.3149
|
3.75
|
|
40.1119
|
2.24804
|
12.6
|
Bi
|
110
|
0.3149
|
3.16
|
|
44.1699
|
2.05047
|
71.65
|
Bi
|
015
|
0.3149
|
17.98
|
|
45.32
|
2.00107
|
93.86
|
Sn
|
211
|
0.3542
|
26.5
|
|
49.2037
|
1.85183
|
6.58
|
Bi
|
202
|
0.4723
|
2.48
|
|
55.7294
|
1.64947
|
25.4
|
Sn
|
301
|
0.3149
|
6.38
|
|
62.8183
|
1.47931
|
55.04
|
Sn
|
112
|
0.2165
|
9.5
|
|
64.92
|
1.43641
|
37.82
|
Sn
|
321
|
0.2952
|
8.9
|
|
72.5841
|
1.30248
|
23.23
|
Sn
|
321
|
0.3936
|
7.29
|
|
73.5035
|
1.28844
|
20.42
|
Sn
|
411
|
0.3936
|
6.41
|
|
79.72
|
1.20287
|
36.48
|
Sn
|
312
|
0.2558
|
7.44
|
|
89.5297
|
1.09477
|
19.27
|
Bi
|
306
|
0.2362
|
3.63
|
|
95.5592
|
1.04015
|
9.52
|
Sn
|
431
|
0.576
|
5.91
|
|
X- ray analysis of Sn81.3Bi15Zn3Cu0.7 alloy
|
|
2q
|
d Å
|
Int. %
|
Phase
|
hkl
|
FWHM
|
Area
|
|
20.1708
|
4.40243
|
18.7
|
Bi
|
003
|
0.1378
|
4.5
|
|
20.5734
|
4.31719
|
27.91
|
Bi
|
003
|
0.2362
|
11.5
|
|
23.008
|
3.86558
|
10.11
|
Bi
|
101
|
0.3149
|
5.56
|
|
27.5571
|
3.23692
|
38.35
|
Bi
|
012
|
0.2558
|
17.12
|
|
30.9694
|
2.88761
|
98.21
|
Sn
|
200
|
0.2952
|
50.59
|
|
32.3271
|
2.76937
|
100
|
Sn
|
101
|
0.3149
|
54.95
|
|
36.834
|
2.44021
|
4.07
|
Zn
|
002
|
0.3542
|
2.52
|
|
38.3222
|
2.3488
|
11.32
|
Bi
|
104
|
0.1968
|
3.89
|
|
40.0254
|
2.2527
|
11.27
|
Bi
|
110
|
0.2755
|
5.42
|
|
43.5884
|
2.07646
|
5.37
|
Sn
|
220
|
0.3149
|
2.95
|
|
44.1079
|
2.05321
|
29.44
|
Bi
|
015
|
0.1968
|
10.11
|
|
45.1593
|
2.00782
|
71.92
|
Sn
|
211
|
0.2952
|
37.05
|
|
49.0546
|
1.85711
|
6.03
|
Bi
|
202
|
0.3149
|
3.32
|
|
55.5567
|
1.65418
|
15.86
|
Sn
|
301
|
0.2165
|
5.99
|
|
56.4327
|
1.63057
|
4.81
|
Bi
|
024
|
0.3149
|
2.64
|
|
62.7327
|
1.48112
|
24.21
|
Sn
|
112
|
0.3149
|
13.3
|
|
64.1149
|
1.45249
|
11.48
|
Sn
|
400
|
0.2755
|
5.52
|
|
64.7323
|
1.44012
|
17.05
|
Sn
|
321
|
0.3542
|
10.54
|
|
72.5751
|
1.30261
|
7.75
|
Sn
|
321
|
0.3936
|
5.32
|
|
73.3377
|
1.29094
|
11.46
|
Sn
|
411
|
0.3936
|
7.87
|
|
79.6088
|
1.20427
|
19.58
|
Sn
|
312
|
0.1771
|
6.05
|
|
89.4527
|
1.09551
|
9.83
|
Bi
|
306
|
0.2362
|
4.05
|
|
95.5354
|
1.04035
|
6.66
|
Sn
|
431
|
0.576
|
9.05
|
Scanning electron microscope analysis (SEM)
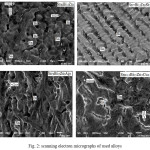
Fig. 2 shows the scanning electron micrographs of Sn82Bi15Zn3, Sn77Bi15Zn3Sb5, Sn79Bi15Zn3Ag3 and Sn81.3Bi15Zn3Cu0.7 alloys. Sn82Bi15Zn3 alloy has lamellar structure (tin phase as gray color and bismuth phase as black color) contained white color (zinc or bismuth- tin) with different shape and size. Sn77Bi15Zn3Sb5 alloy has a good symmetric lamellar structure (gray broad lamellar structure and black small width lamellar) contained white small crystals with different shape. Sn79Bi15Zn3Ag3 alloy has a mixed lamellar structure and white color along at the lamellar boundary. Sn81.3Bi15Zn3Cu0.7 alloy has a heterogeneous structure and white color as slabs with different shape, size and orientation.[Jagadeees1] From SEM graphs analysis, it obvious that, these alloys have heterogeneous structure which confirmed from x-ray and DSC results.
Figure 2: scanning electron micrographs of used alloys
Soldering properties
Thermal behavior
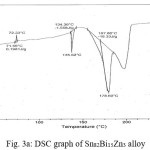
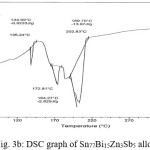
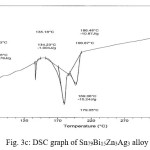
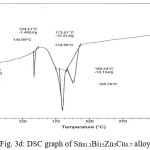
Thermal analysis depend on the nature of solid phase and on its temperature. They used to study solid state transformations as well as solid liquid reactions. The DSC thermographs were obtained with heating rate 10 °C /min in the temperature range 0- 400 °C. DSC thermographs of Sn82Bi15Zn3, Sn77Bi15Zn3Sb5, Sn79Bi15Zn3Ag3 and Sn81.3Bi15Zn3Cu0.7 alloys are shown in Figure 3 (a- d). DSC graphs show many peaks with different intensity, broadness and position. That is meant, these alloys contained many phases with different crystallinity, crystal size and orientation. The melting temperature of usedalloys as shown in Table 2 dependent on alloys composition. Also it is less than the tin eutectic based alloys and very closed with commercial lead- tin solder alloy (183 oC).
Wetting behavior
Wettability is quantitatively assessed by the contact angle formed at the solder substrate’s flux triple point. The contact angles of Sn82Bi15Zn3, Sn77Bi15Zn3Sb5, Sn79Bi15Zn3Ag3 and Sn81.3Bi15Zn3Cu0.7 alloys on pure Cu substrate are listed in Table 3. The contact angle of Sn82Bi15Zn3 alloy increased after adding Sb or Ag or Cu. That is meant the spreading of used alloys molten on pure Cu at room temperature in air dependent on alloy composition (cohesive force and adhesive force). Also these alloys have good wetting process (contact angles less than 50 oC[Jagadeees1] ) compared to its eutectic alloys.1,2,4
Table 2: melting temperature of used alloys
|
Alloys
|
Melting temperature oC
|
Based alloys
|
Melting temperature oC
|
|
Sn82Bi15Zn3
|
178.6
|
Sn91Zn9
|
199
|
|
Sn77Bi15Zn3Sb5
|
189.7
|
Sn95Sb5
|
242.06
|
|
Sn79Bi15Zn3Ag3
|
186.48
|
Sn96.5Ag3.5
|
223.81
|
|
Sn79.3Bi15Zn3Cu0.7
|
185.24
|
Sn99.3Cu0.7
|
231.55
|
Table 3: contact angles of used alloys
|
Alloys
|
Contact angle (Φ°)
|
|
(Φ°)
|
|
Sn82Bi15Zn3
|
21.25
|
Sn91Zn9
|
46
|
|
Sn77Bi15Zn3Sb5
|
26
|
Sn95Sb5
|
27
|
|
Sn79Bi15Zn3Ag3
|
27.25
|
Sn96.5Ag3.5
|
36
|
|
Sn79.3Bi15Zn3Cu0.7
|
31
|
Sn99.3Cu0.7
|
43
|
Figure 3a: DSC graph of Sn82Bi15Zn3 alloy
Figure 3b: DSC graph of Sn77Bi15Zn3Sb5 alloy
Figure 3c: DSC graph of Sn79Bi15Zn3Ag3 alloy
Figure 3d: DSC graph of Sn81.3Bi15Zn3Cu0.7 alloy
Electrochemical corrosion behavior
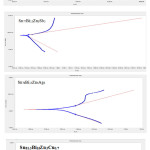
Figure 4 shows electrochemical polarization curves of Sn82Bi15Zn3, Sn77Bi15Zn3Sb5, Sn79Bi15Zn3Ag3 and Sn81.3Bi15Zn3Cu0.7 alloys in 0.25 M HCl. The corrosion potential of used alloys exhibited a negative potential. Also the cathodic and the anodic polarization curves showed similar corrosion trends. The corrosion potential (ECorr), corrosion current (ICorr) and corrosion rate (C. R) of Sn82Bi15Zn3, Sn77Bi15Zn3Sb5, Sn79Bi15Zn3Ag3 and Sn81.3Bi15Zn3Cu0.7 alloys are presented in Table 4. The corrosion rate of Sn82Bi15Zn3 alloy in 0.25 M HCl is decreased by adding Sb or Cu but it’s increased by adding Ag content. That is because adding Sb or Ag or Cu caused a heterogeneous microstructure (more phases) with dissolved atoms in matrix that effected on microsegregation and reactivity of atoms with HCl solution.
Table 4: corrosion parameters of used alloys
|
Alloys
|
Ecorr mV
|
Icorr µm
|
C.R mpy
|
|
Sn82Bi15Zn3
|
-862.0
|
841
|
348.3
|
|
Sn77Bi15Zn3Sb5
|
-578.0
|
639
|
292.1
|
|
Sn81.3Bi15Zn3Cu0.7
|
-792.0
|
650
|
297.2
|
|
Sn79Bi15Zn3Ag3
|
-949.0
|
828
|
378.2
|
Figure 4: electrochemical polarization curves of used alloys
Conclusion
In this work, it can produced lead free solder alloys with superior soldering properties (melting temperature and wettability) and corrosion resistance compared to eutectic and non-eutectic tin based solder alloys by adding different alloying elements. [Jagadeees1] Melting temperature and contact angle of tin- zinc, tin- antimony and tin- copper alloys decreased after adding bismuth content. Corrosion resistance of Sn82Bi15Zn3 alloy in 0.25 M HCl increased after adding Sb or Cu element.
Acknowledgment : The author would like to acknowledge his guide.
Funding Source: The author declares that the funding is done by author only.
Conflict of interest: The author(s) declare(s) that there is no conflict of interests regarding the publication of this article.
References
- El-Bediwi A. B., El-Shafei A., Kamal M. Journal of Advances in Physics. 2015;7:3:1939.
- El-Bediwi A. B., El-Shafei A., Kamal M. Global Journal of Physics. 2015;2:1:67.
- El-Bediwi A. B., Jubair M. M., Shalaby R. M., Kamal M. International Journal of Science and Engineering Applications. 2015;4:4:186.
CrossRef
- El-Bediwi A. B., El-Shafei A., Kamal M. MSAIJ. 2015;12:2:28.
- El-Bediwi A. B., Dawood F., Kamal M. Journal of Advances in Physics. 2015;7:3:1952.
- El-Bediwi A. B., Bader S., Khalifa F. Global Journal of Physics. 2016;4:3:480.
- El-Bediwi A. B.,Bader S., Khalifa F., IJSRSET. 2016;2;2:1267
- Yang W and Messler R. W. Jr. J. Electron. Mater. 1994;23:765
CrossRef
- Mavoori H., Chin J., Vaynman S., et al., J. Electron. Mater. 1997;41:1269
- McCormack M., Jin S and Kammlott G. W. Proceedings of the 1995 IEEE International Symposium on Electronics and the Environment, ISEE, Orlando, FL, USA. 1995;1–3:171
- Abtew M and Selvaduray G. Mater. Sci. Eng. Rep. 2000;27:95.
CrossRef
- Vincent J. H and Humpston G. GEC J. Res. 1994;11:76.
- Harrison M. R., Vincent J. H and Steen H. A. H. Sold. Surf. Mount Technol. 2001;13:21.
CrossRef
- Kim K. S., Yang J. M., Yu C. H., Jung I. O., Kim H. H., Alloy J. Compd. 2004;379:314.
CrossRef
- Anderson I. E., Foley J. C., Cook B. A., Harringa J., Terpstra R. L., Unal O. J. Electron. Mater. 2001;30:9:1050.
- McCormack M., Jin S., Kammlott G. W., Chen H. S., Appl. Phys. Lett. 1993;63:1:15.
CrossRef
- Miric A. Z., Grusd A. Surf. Mount Technol. 1998;10:1:19.

This work is licensed under a Creative Commons Attribution 4.0 International License.