Upconversion and Spectroscopic Properties of Rare Earth Codoped Lead Borate Glass Matrix
K. Krishna Murthy Goud 1*  , CH. Ramesh2 and B. Appa Rao
1Dept. of Physics, UCE (A), Osmania University, Hyderabad-500007 (T.S), India.
2Dept. of Physics, M G University, Nalgonda (T.S), India.
3Dept. of Physics, Osmania University, Hyderabad-500007 (T.S), India.
Corresponding author Email: krishnamurthy.phy@gmail.com
DOI : http://dx.doi.org/10.13005/msri/140209
Article Publishing History
Article Received on : 03 Nov 2017
Article Accepted on : 21 Feb 2017
Article Published : 12 Sep 2017
Plagiarism Check: Yes
Article Metrics
ABSTRACT:
To develop efficient upconversion laser materials in the visible region an active lead borate glasses doped with Er3+/Yb3+ rare earth ions (GEY) has been studied extensively. In this investigation characterization techniques like Optical absorption, FTIR and photoluminescence were recorded and the data was analyzed. To evaluate the values of Ω2, Ω4 and Ω6 Judd-Ofelt theory has been applied to the f ↔ f transitions. Based on Judd–Ofelt theory branching ratio (βr) oscillator strength and the radiative life time (τR) values were determined. The upconversion spectra exhibited three emission bands at around 525 nm (2H11/2 ® 4I15/2), 545 nm (4S3/2 ® 4I15/2) and 660 nm (4F9/2 ® 4I15/2). The energy transfer mechanism between Yb3+ and Er3+ was discussed very clearly. Comparing the data obtained in other Er3+/Yb3+ doped materials, the lead bismuth gallium borate glasses doped with 0.6 mol% of Er2O3/0.2 mol% of Yb2O3 ions are suitable materials for developing red upconversion lasers in the visible region.
KEYWORDS:
FTIR; Glasses; Optical absorption; Photo luminescence
Copy the following to cite this article:
Goud K. K. M, Ramesh Ch, Rao B. A. Upconversion and Spectroscopic Properties of Rare Earth Codoped Lead Borate Glass Matrix. Mat.Sci.Res.India;14(2)
|
Copy the following to cite this URL:
Goud K. K. M, Ramesh Ch, Rao B. A. Upconversion and Spectroscopic Properties of Rare Earth Codoped Lead Borate Glass Matrix. Mat.Sci.Res.India;14(2). Available from: http://www.materialsciencejournal.org/?p=5842
|
Introduction
The addition of rare earths to the base glass matrix created a great interest in the researchers because of upconversion of infrared light to visible light. This feature leads to various applications like upcoversion lasers, sensors, and optical displays.1-3 Among different oxide glass compositions, the lead borate glass matrix doped with F block elements are suitable systems for applications in optical devices of laser technology. The absorption and emission properties of rare earth ions in lead borate glass matrix are well reported in the literature4-6 Among various glass systems, heavy metal oxide glasses are good enough for the applications in non-linear optical instruments.7
The physical properties like thermal expansion coefficient, refractive index, glass transition temperature, chemical resistance and infrared transmittance of the glasses changes when heavy metal oxides like, Ga2O3 is introduced in to the glass matrix. The addition of heavy metal oxides makes the glass matrix good enough for the applications in photonic devices.8,9 Er2O3 is universally considered as an effective ion among different rare-earth ions that produce upconversion, and gives rather high efficiency. Energy transfer and excited state absorption mechanisms are most efficient in the case of Er2O3. 10 Because of efficient energy transfer from Yb3+ to Er3+ ions, the sensitization of Er3+ doped materials with Yb3+ ions is a well-known method for increasing the optical pumping efficiency.11 In this task, we presented the spectral properties of Er3+/Yb3+ codoped lead bismuth gallium borate (GEY) glasses.
Experimental
Glasses with [100-(x+y)][0.5PbO-0.25B2O3-0.20Bi2O3-0.05Ga2O3]-xEr2O3–yYb2O3with y = 0 for x = 0, 0.2 and y = 0.2 for x = 0 to 1.0 (step 0.2 mol%) are chosen for this investigation and the glass samples are marked as GE0Y0, GE2Y0, GE0Y2, GE2Y2, GE4Y2, GE6Y2, GE8Y2 and GE10Y2, respectively. All glasses were processed by universally accepted melt quenching method.
With the help of JASCO Model V-670 UV–VIS–NIR spectrophotometer, optical absorption spectra of the present glass matrix were reported in the wavelength range 350–2000 nm. The FTIR spectra of glass samples were recorded on a BRUKER OPTICS, TENSOR-27 infrared spectrometer in the range 4000 – 400 cm-1. Using JOBIN YVON Fluorolog-3 spectrofluorimeter, upconversion fluorescence spectra were obtained in the wavelength range 300-700 nm upon the incitement of 980 nm laser diode.
Results and Discussion
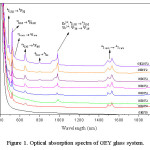
The optical absorption spectra of all prepared glasses was shown in Figure 1. The spectra exhibits intense absorption band at 980 nm because of 4I15/2 → 4I11/2 and 2F7/2 → 2F5/2 transitions of Er3+ and Yb3+, respectively. The supplementary absorption bands are due to the contribution of 4f-4f transitions of Er3+ ions from the ground (4I15/2) level to the higher levels at 488 nm (4F7/2), 521 nm (2H11/2), 545 nm (4S3/2), 652 nm (4F9/2), 798 nm (4I9/2) and 1510 nm (4I13/2).12,23 With the augmentation in the enrichment of Er3+ ions, the enhancement in the intensities of all bands was noticed to increase.
Figure 1: Optical absorption spectra of GEY glasses
The enhancement in the value of cut-off wavelength upto 0.6 mol% of Er2O3 ions and decrement beyond this concentration of Er2O3 was noticed in the Figure 1. Optical band gap energy (Eopt) and Urbach energy (ΔE) values are measured applying standard relations.13,14 From the data (Table 1) the value of Eopt was found to decrease upto 0.6 mol% of Er3+ ions and enhances thereafter with augmentation in the enrichment of Er3+ ions.
The decrement in the value of Eopt with the rise in the enrichment of Er2O3 up to 0.6 mol% refers to the amplification of bonding artifacts and NBOs in the glass network up to 0.6 mol% of Er2O3. More likely in this concentration region the Ga3+ ions may take network establish locations with GaO4 units and interchange with BO4 units. Such concatenation may incur a decrement in the firmness of the glass network and causes the decrease in the optical band gap as noticed. Judd-Ofelt theory helps in the analyzation of the radiative transitions within the confines of 4f N configuration of a rare earth ion. The Judd-Ofelt parameters Ωλ (λ = 2, 4 and 6) and different spectroscopic parameters, in particular radiative lifetime, oscillator strength and branching ratios (βr) were determined by applying standard equations.15-22 The values of various radiative parameters are presented in Table 2 and Table 3.
Table 1: Values of cut off wavelength, Eopt and ΔE of GEY glasses codoped with Er3+/Yb3+.
|
S.No.
|
Sample code
|
Cut-off
wavelength (nm)
|
Eopt (eV)
±0.01
|
ΔE (eV)
±0.001
|
|
1
|
GE0Y0
|
400
|
3.02
|
0.152
|
|
2
|
GE2Y0
|
408
|
2.96
|
0.148
|
|
3
|
GE0Y2
|
409
|
2.95
|
0.148
|
|
4
|
GE2Y2
|
419
|
2.89
|
0.144
|
|
5
|
GE4Y2
|
425
|
2.85
|
0.139
|
|
6
|
GE6Y2
|
431
|
2.80
|
0.135
|
|
7
|
GE8Y2
|
427
|
2.83
|
0.138
|
|
8
|
GE10Y2
|
423
|
2.86
|
0.141
|
The decrease in the optical band gap with the increase in the concentration of Er2O3 up to 0.6 mol% suggests increasing degree of depolymerization or concentration of bonding defects and non-bridging oxygens (NBO) in the glass network up to this concentration of Er2O3. Probably in this concentration range the gallium ions may take network forming positions with GaO4 structural units and alternate with BO4 units. Such linkages may cause a decrease in the rigidity of the glass network and leads to the decrease in the optical band gap as observed. The Judd-Ofelt theory helps in the analyzation of the radiative transitions within in the 4f N configuration of a rare earth ion. The Judd-Ofelt parameters Ω2, Ω4 and Ω615,16 can be determined by obtaining the experimental ground state oscillator strengths of the absorption transitions via an integration of the absorption coefficients for each band. The Judd-Ofelt theory has often been used to calculate the spectroscopic parameters, such as radiative lifetime, oscillator strength and branching ratios (βr) using standard equations.17-22 The results are summarized in Table 2 and Table 3.
Table 2: Radiative life time (τR) and branching ratios (βr) of Er3+ in GEY glasses
|
Transitions
|
br (%)
|
τR (ms)
|
|
2H11/2 → 4I15/2
|
14
|
0.74
|
|
4S3/2 → 4I15/2
|
16
|
0.80
|
|
4F9/2 → 4I15/2
|
52
|
2.76
|
Table 3: Experimental and evaluated oscillator strength values of Er2O3 in GEY glass system
|
Transition from 4I15/2 →
|
fexp(x10-6)
|
fcal(x10-6)
|
|
4I13/2
|
0.982
|
0.976
|
|
4I11/2
|
0.549
|
0.558
|
|
4I9/2
|
0.446
|
0.441
|
|
4F9/2
|
1.207
|
1.219
|
|
4S3/2
|
0.328
|
0.312
|
|
2H11/2
|
4.435
|
4.442
|
|
4F7/2
|
1.163
|
1.171
|
|
r.m.s. deviation
|
±0.091
|
According to literature23,24, Ω2 is associated with the symmetry of the rare earth site while Ω6 is inversely proportional to the covalency of Er-O bond. The Er-O bond is supposed to be dependent on the local basicity around the rare-earth sites, which can be adjusted by the configuration or complex of the host material. It is strongly entrenched that an emission level with βr value above 50% turn into a possible laser radiation. Based on info on radiative transitions in the present glasses, the transition 4F9/2 → 4I15/2 has the high degree of βr a partfrom different transitions. As a result this transition may be treated as a acceptable laser transition. The order of Judd-Ofelt parameters in the present glass system is Ω2>Ω4>Ω6.
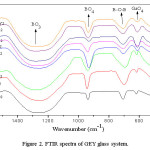
The FTIR spectra of GEY glass system codoped with Er3+/Yb3+ was shown in figure 2. The band cited at ~482 cm-1 is attributed to the bending vibrations of Bi2O3 pyramidal units and also because of the presence of PbO4 units.25 The band indicated at ~613 cm-1 is because of network forming GaO4 tetrahedral groups.26 A band was identified at ~707 cm-1, which is produced by the vibrations of B-O-B linkages. Asymmetric stretching vibrations of B-O bands in BO4 units produces a band at ~930 cm-1. The band identified at ~1250 cm-1 is because of asymmetric stretching vibrations of BO3 units.27
Figure 2: FTIR spectra of GEY glass matrix
From figure 2 it was noticed that, the intensity of band corresponding to GaO4 tetrahedral groups increases from 0 mol% of Er2O3 to 0.6 mol% of Er2O3, beyond 0.6 mol% of Er2O3 the trend is reverse. This is due to the fact that Ga3+ ions go into alternative positions with GaO4 structural units and alter the glass structure upto 0.6 mol%. Within this concentration Ga3+, separate the rare-earth ions from rare earh-O-rare earh bonds and convert into Ga-O-rare earh. Like that declustering effect leads to the large gap between rare earth ions and may favors the increment of fluorescence emission.
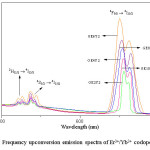
Figure 3 represents the upconversion emission spectra of present glasses obtained in the wavelength region 500 –700 nm upon the incitement of 980 nm laser source. Three emission bands at 525 nm, 545 nm and 660 nm were exhibited by the spectra. It was noticed that the upconversion luminescence intensity of red emission (660 nm) is higher than the upconversion luminescence intensity of green emission (525 and 545 nm). It was also noticed that the green radiation is feeble and red radiation is of high intense.
The results showed that the intensity of green and red radiations increases with increase in the concentration of Er2O3 upto 0.6 mol% and beyond this concentration decrease in the intensity was observed. As per literature in an upconversion, the increment in the intensity of emitted radiation (Iup) increases in proportion to the nth power of infrared excitation intensity (IIR), i.e.,
Figure 3: Frequency upconversion emission spectra of Er3+/Yb3+ codoped glasses
From the spectra it can be concluded that the intensity of green and red emissions increases with increase in the concentration of Er3+ ions upto 0.6 mol% (GE6Y2) and decreases with further increase in the concentarion of Er3+ ions in Er3+/Yb3+ codoped glass samples. In an upconversion, the emission intensity (Iup) increases in proportion to the nth power of infrared excitation intensity (IIR), i.e.,

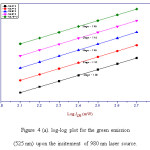
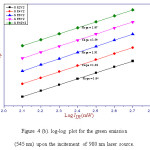
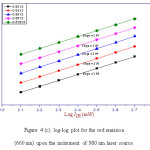
where n represents the number of infrared photons absorbed to emit one photon in the visible region [28]. The value of ‘n’ can be determined from plot of log Iup versus log IIR. This plot gives a straight line and the slope of this straight line represents the value of ‘n’. The log-log plot for the 525 nm, 545 nm and 660 nm emission was shown in figure 4 (a), (b) and (c), respectively. From figure 4 (a), (b) and (c), the value of ‘n’ for 525 nm, 545 nm and 660 nm emission bands was calculated and got around two. Hence, two photon absorption is responsible for green and red radiations.29
Figure 4 (a): log-log plot for the green emission (525 nm) upon the incitement of 980 nm laser source
Figure 4 (b): log-log plot for the green emission (545 nm) upon the incitement of 980 nm laser source.
Figure 4 (c): log-log plot for the red emission (660 nm) upon the incitement of 980 nm laser source.
codoped glasses upon the incitement of 980 nm laser source.30 The energy transfer mechanism between Er2O3 and Yb2O3 mainly involves ground state absorption (GSA), energy transfer (ET) and excited state absorption (ESA). The energy transfer mechanism which is responsible for the green and red emissions was explained in detail in our previous papers.31,32
Figure 5: Illustrates the energy transfer mechanisms for the emisions in the Er3+/Yb3+
From the Upconversion spectra, it was noticed that the intensity of green emissions centered at 525 nm and 545 nm are very small. This may be due to the radiation less transition of the erbium ions at 4S3/2 level to F9/2 level in large number.
The 4I13/2 level is populated owing to the radiation less transition from the upper 4I11/2 level. In addition to this, the radiation less transition from 4S3/2 level, which is populated by means of the mechanism explained earlier, to the 4F9/2 level also contributes to the red emission. As per the discussion made earlier, the phonon energy also plays a significant role and it can affect the upconversion intensity: with the increase of the phonon energy in Er3+/Yb3+ co-doped glasses the red emission increases more than that of green by means of the mechanism explained above. The previous researchers reported that Ga2O3 influences the increase in the intensity of red emission than that of green emission [33, 34].
Conclusions
For the investigation of spectroscopic properties at room temperature, lead bismuth gallium borate glasses were prepared with different dopant (Er3+/Yb3+) ion concentrations. The incorporation of Er3+/Yb3+ in the present glass matrix was evidenced by the studied characterization techniques. The Judd–Ofelt intensity parameters Ωt (t=2, 4, 6), oscillator strength, branching ratio (βr), and the radiative lifetime values were calculated and analyzed. For the transition 4F9/2 → 4I15/2 at 660 nm, the branching ratio (βr) showed highest value among other transitions. Therefore, this transition is considered as suitable transition for the development of upconversion lasers. The upconversion bands representing to weak green and intense red emissions at around 525 nm, 545 nm and 660 nm, respectively, were detected upon the incitement of 980 nm laser source. ESA and the ET were primarily connected with the upconversion processes. It was noticed that the increment in the energy transfer efficiency takes place with Er3+ content, and reaches maximum for the 0.6 mol% Er3+/0.2 mol% Yb3+ co-doped glass. From the upconversion spectra it was found that, the red emission is more influenced than the green emission. Two-photon absorption process is responsible for the green and red emissions. The probability of radiation less transition of Er3+ ions from 4F11/2 → 4I13/2 is enough higher than the probability of upconversion to the upper 4F7/2 level as a result of the longer lifetime of the 4I13/2 level compared to the lifetime of the 4I11/2 level, which influences the radiation less transition (4I11/2 → 4I13/2) to take place more easily. Hence, the intensity of red emission is intensified than that of green emission. With increase in the concentration of Er3+ upto 0.6 mol%, the intensity of green emission increased slightly, while the red emission intensity increases to a larger extent when compared with that of green emission. The results obtained provide useful information for choice of Er and Yb concentration as well as for modelling and optimising the performance of upconversion lasers based Er3+/Yb3+ codoped lead bismuth gallium borate glasses.
References
- Collins S. F., Baxter G. W and Wade S. A. J. Appl. Phys. 1998;84:4649.
CrossRef
- Dai S. X., Yang J. H and Xu S. Q. Chin. Phys. Lett. 2003;20:130.
CrossRef
- Zhang L. Y., Yang J. H and Hu L. L. Chin. Phys. Lett. 2003;20:1344.
CrossRef
- Kassab L. R. P., Courrol L. C., Seragioli R., Wetter N. U., Tatumi S. H and Gomes L. J. Non. Cryst. Solids. 2004;348:94.
CrossRef
- Pisarski W. A., Pisarska J., Dzik G. D and Romanowski W. R. J. Phys. Condens. Matter. 2004;16:6171.
CrossRef
- Pisarski W. A., Pisarska J., Dzik G. D czka M. M and Romanowski W. R. J. Phys. Chem. Solids. 2006;67:2452.
CrossRef
- Downing E., Hesselink L., Ralston J and Macfarlane R. A. three-color solid-state three dimensional display Science. 1996;273:1185.
CrossRef
- Branda F., Costantini A., Luciani G and Silvestri B. Phys. Chem. Glasses. 2004;45:45.
- Plucinski K. J., Gruhn W and Ebothe J. W. J. Opt. Mater. 2003;22:13.
CrossRef
- Vetrone F., John-Christopher B., Capobianco A. J. Appl. Phys. Lett. 2002;80:1753.
CrossRef
- Laporta P., Longhi S., Taccheo S., et al., Opt. Commun. 1993;100:311.
CrossRef
- Nie Q.,Lu L., Xu T., Dai S., shen X., Liang X., Zhang X and Zhang X. J. Phy. and Chem. of Solids. 2006;67:2345-2350.
CrossRef
- Sands R. H. Phys. Rev. 1995;99:1222.
CrossRef
- Davis E. A and Mott N. F. Phil. Mag. 1970;22:903.
CrossRef
- Judd B. R. Phys. Rev. 1962;127:750.
CrossRef
- Ofelt G. S. J.Chem. Phys. 1962;37:511.
CrossRef
- De la Rosa-Cruz E., Kumar G. A., Diaz-Torres L. A., Martinez A and Barbosa-Garcia O. Opt.Mater. 2001;18:321.
CrossRef
- Choi J. H., Margaryan A and Shi F. G. J. Lumin. 2005;114:167.
CrossRef
- Krupke W. F. Phys. Rev. 1966;145:325.
CrossRef
- Carnall W. T., Fields P. R and Wybourne B. G. J. Chem. Phys. 1965;42:3797.
CrossRef
- Weber M. J. Phys. Rev. 1967;157:262.
CrossRef
- Mehta V., Aka G., Dawar A. L and Mansingh A. Opt. Mater. 1999;12:53.
CrossRef
- Rao A. V., Laxmikanth C.,Rao B. A and Veeraiah N. J. Phys. Chem. Solids. 2006;67:2263.
CrossRef
- De. Andrade J. S., Pinheiro A. G., Vasconcelos I. F., Sasaki J. M., Paiva J. A. C. D. E., Valente M. A and Sombra A .S. B. J. Phys. Condens. Matter. 1999;11:4415.
- Hung W. H., Ray C. S and Ray D. E. J. Am. Ceram. Soc. 1994;77:1071.
- Yeh D. C., Sibley W. A and Suscavage M. J. Appl. Phys. 1987;62:266.
CrossRef
- Huang L. H., Liu X. R., Xu W., Chen B. J and Lin J. L. J. Appl. Phys. 2001;90:5550–5553.
CrossRef
- Lin H., Meredith G., Jiang S., Peng X., Luo T., Peyghambarian N and Pun E. Y. B. J. Appl. Phys. 2003;93:186–191.
CrossRef
- Adam J. L. J. Fluorine Chem. 2001;107:265.
CrossRef
- Cantelar E and Cussó F. J. Lumin. 2003;102:525.
CrossRef
- Yamauchi H and Ohishi Y. Opt. Mater. 2005;27:679.
CrossRef
- Nie Q., Jiang C., Wang X., Xu T and Li H. Spectrochim. Acta Part A. 2007;66:278.
CrossRef
- Xu S., Wang G., Dai S., Zhang J., Hu L and Jiang Z. J. solid state chem. 2004;177:3127-3130.
CrossRef

This work is licensed under a Creative Commons Attribution 4.0 International License.

![Figure 5. Energy level diagram of Er3+/Yb3+ codoped GEY glass system under the excitation of 980 nm laser diode [35].](http://www.materialsciencejournal.org/wp-content/uploads/2017/09/Vol14_No2_Fre_Kris_Fig5-150x150.jpg)
