Mahua Karmakar1*, P. S. Mazumdar1 and SK. Azharuddin2
1Department of Physics, Acharya Prafulla Chandra College, New Barrackpore, Kolkata - 700131, India.
2Raipur Sri Sri Ramkrishna Amrita Vidyalaya,Dakshin Raipur, Nodakhali- 743318, 24 Parganas, West Bengal, India.
DOI : http://dx.doi.org/10.13005/msri/080221
Article Publishing History
Article Received on : 10 Nov 2011
Article Accepted on : 29 Dec 2011
Article Published :
Plagiarism Check: No
Article Metrics
ABSTRACT:
Heating rate associated with any heating scheme is of prime importance in any kind of thermoluminance (TL) measurement. A class of methods known as various heating rates method involve heating rate in the determination of activation energy. In this article we critically analyse different variants of various heating rates method in view of different effects such as thermal quenching, temperature lag of the heating element together with effect of heating rate with kinetic parameter.
KEYWORDS:
Thermoluminescence; Heating rate; Glow curve
Copy the following to cite this article:
Karmakar M, Mazumdar P. S, Azharuddin SK. On Some Considerations on Heating Rate in Thermoluminescence Measurements. Mat.Sci.Res.India;8(2)
|
Copy the following to cite this URL:
Karmakar M, Mazumdar P. S, Azharuddin SK. On Some Considerations on Heating Rate in Thermoluminescence Measurements. Mat.Sci.Res.India;8(2). Available from: http://www.materialsciencejournal.org/?
|
Introduction
Thermoluminescence (TL) is a luminescence phenomenon of a semiconductor or insulator which can be observed when the solid is thermally stimulated after being irradiated by some ionizing radiation. In TL experiments, a sample, after irradiation is heated in a oven according to some pre-programmed temperature profile. Among the heating schemes applied, linear heating scheme is the most widely used though some others like hyperbolic heating scheme and exponential heating schemes are there. In linear heating scheme, the temperature is increased according to T (t) = T0 + βt ,where T0 is the initial temperature and β is a constant. There is a relationship in between heating rate â and the temperature corresponding to maximum intensity of glow peaks. This led the researchers to develop a number of methods for calculating the activation energy. In that sense heating rate (H. R.) is of great importance in any kind of thermoluminance measurements. The most remarkable observation on this experimental parameter is discussed here .
Gorbics et al.,¹ reported studies on thermal quenching of TL by varying the H.R. between 0.07 and about 110C/Sec. They found that
The maximum glow peak temperature, Tm is shifted to higher temp as H.R. increases.
The TL intensity increases as the HR decreases.
Kelly and his co workers2 discussed about the validity of the TL kinetic theories when high heating rates are involved. They found that the high heating rates upto 105 0C/sec do not invalidate the Shockley- Read statistics on which kinetic theories are based.
Different groups of workers namely Kathuria et al.,3, Vana et al.,4, Gartia et al.,5, Azorin et al.,6, Dorenbos et al.,7, Sakurai et al.,8, Trinkler et al.,9, Spooner et al.,10, Yazici et al.,11, Ogmdare et al.,12 worked on different materials and reported similar results. The experimental evidence of the reduction of the TL as a function of HR is thus almost general phenomenon.
The H.R. effect on TL glow peaks has been largely discussed by G. Kitis13
He considered HR as a dynamic parameter rather than a simple experimental setup variable. His study has been carried out on single well-separated glow peaks. He considered the variation of M T (Temperature corresponding to maximum peak intensity), FWHM ( Full width at half maximum), Peak intensity and peak integral.
For Al2O3 : C, the variations of the factors under investigation with temperature are depicted in the following figures.
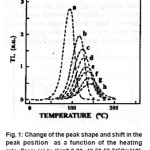
Figure 1: Change of the peak shape and shift in the peak position as a function of the heating rate From (a) to (h)=2,8,20, 40,50,57,710C/s[13]
The experimental results follow exactly aneqn. of the form =αβ γ M T where β =H.R.; & αγ are constants. α stands for the M value obtained with the lower HR. The same equation can fit the value of 1 T and 2 T which are the low and high maximum temperature respectively. The theoretical behavior is obtained by using the general order equation for HR
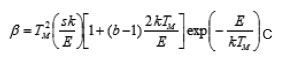
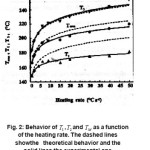
Here ‘b’ is the order of kinetics, ‘k’ is Boltzman constant and ‘E’ is the activation energy. Fig. 2 shows discrepancy between the experimental behavior and the one expected from theoretical model.
Figure 2: Behavior of 1 T , 2 T and M T as a function of the heating rate. The dashed lines show the theoretical behavior and the solid lines the experimental one
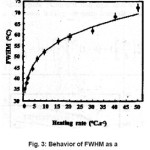
Fig. 3 shows the behavior of FWMH for the peak in α- Al2O3 :C as a function of HR. Here also the experimental points can be fitted by an equation similar to the earlier FWMH = αβ γ with = 36.5 & = 0.165
Figure 3: Behavior of FWHM as a function of heating rate[14]
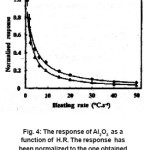
Another important data reported by G. Kitis is the variation of integral and peak height with HR. Here TL response of α- Al2O3 :C is normalized to the response at lower HR (0.6OC/S). Here • is for integral and Δ is for peak height (Fig. 4 )
Figure 4: The response of Al2O3 as a function of H.R. The response has been normalized to the one obtained with lowest heating rate [14]
So, the reduction of TL with increasing HR is an established fact. . This reduction has been attributed to thermal quenching, whose efficiency increases as the temperature increases [1]. Since the glow peak shifts to higher temperature, it suffers from thermal quenching. The results indicate that the thermal quenching (increase of probability of non-radiative transition over radiative transition ) can be a very good explanation of the TL reduction with the heating rate.
On the contrary, the reverse experimental observation have also been reported. A.S. Pradhan,15 M.S.Akselrod16,17 have reported experimental observation revealing increase of glow peak height with increasing HR. Recently Rasheedy and Zahran18 have studied the effect of different heating rates on TL glow curves for BeO (Thermolux) in time and temperature plots for linear heating rate. They have raised the issue of non conservation of area in TL vs temperature plots. Munish Kumar et al.,19 has sorted out this problem. They have divided the TL intensity ( I ) by the respective heating rate. This lead to the decrease in glow peak height in I/p vs. temperature plot, which is the artifact of normalization process. This was supported by the fact,20 that during their experiment the integrated counts displayed on digital panel meter (DPM) were the same (within statistical fluctuation) for the TL glow curves recorded at different heating rates at same dose (no thermal quenching). According to them, it is better to present the normalized and unnormalised TL counts and temperature plots when TL glow curves are recorded at various HR even though the imparted radiation dose is the same. But according to Rasheedy and Zahran21 this is not the physical reason to conserve the area, rather it represents a way of normalization while the original areas before normalization process still increases with the heating rate. Ege et al.,22 investigated the effect of different heating rates on kinetic parameters of β irradiated Li2B4O7 :Cu, Ag, P in nitrogen atmosphere for thermoluminescence measurements. Theynoted a slight decrease of the sensitivity of the dosimeter approximately of the order of 20% for the highest heating rate applied (40K/sec) compared to the lowest one applied (1K/sec). Exhaustive research work of Taylor et al.,23, Ogundare et al.,12, Kitis et al.,24, supports the fact that different heating rates cause different TL intensities which in turn give rise to a change in the trapping parameters namely activation energy E and frequency factors.
Recently Gokee et al.,24, has studied the effect of HR on kinetic parameters of Mg2 SO4: Tb integrated TL intensities as a function of HR indicates effect of thermal quenching and clustering on the TL process.
A serious problem when heating rate is considered is the difference of HR in the heater element and the sample due to non-ideal thermal contact between them. This is called temperature lag. The effect of temperature lag and thermal gradients in the thermoluminescence measurements are the subject of many workers namely Taylor et al.,23, Gotlib et al.,26, Betts et al.,27, Peters et al.,28, Facey et al.,29 etc . Piters and Bos28 found theoretically the effect of Temperature Lag and the thermal gradients and found that after a transitional period, the rate of heating of the sample (βeff) is smaller than the rate of heating ( ) of the heating element. They found that the temperature lag for LiF: Mg, Ti during linear heating is where is the temperature of the heating element and is the temperature of the surroundings. The slope 1.7 β is in very good agreement with the slope of the lines obtained by a new method to determine the temp. lag proposed by G Kitis and Tuyn.24 They suggested a good linear relation of temperature lag with the real rate of heating(β) as . Preliminary experimental tests of the proposed equation are performed on LiF : Mg, Ti and α- Al2O3 :C . VHR method is very sensitive to for evaluation of activation energy . So calculated by the suggested method should not be employed for exact evaluation of E.
The experimental results of Gokee et al .,25 on Mg2SiO4 : Tb obtained by various heating rate (VHR) method and glow curve slope method indicate that the calculated kinetic parameters are strongly affected by the difference of temperature between the heating strip and the emissive surface of the TL sample . In order to minimize the temperature lag , one should use the lowest possible heating rate.
The conventional 1st, 2nd and general order equations30,31,32 describe the TL intensity in its time dependent form. But there is a distinction between I(t) and I(T); the relevant equation for, is not adequate for comparison with the experimental results, where the TL intensity is recorded against temperature. This equation therefore must be replaced by an expression of I(T). As a result of this replacement, some characteristic of the theoretically generated glow peaks are changed to match the characteristic of the experimental glow peaks.
Thermoluminescence materials are being widely used in personnel and clinical dosimetry and also for environmental monitoring. And any reliable dosimetric study of new thermoluminescent material should include the determination of kinetic parameters namely order of kinetics, activation energy and frequency factor. To obtain these parameters from TL glow curves, different techniques are developed for which heating rate is one of the most important variables. It has been found that different heating rates cause different TL intensities which in turn may give rise to change in the trapping parameters.
However, a higher heating rate is advantageous in dosimetry applications as it improves the signal-to-noise ratio (LLD as well) and decreases the recording time of TL glow curve. Further, if any glow curve exhibits thermal quenching, it may not be suitable for dosimetric application as unnecessary correction factor may be required which may enhance the overall errors in any dosimetry programme. However, if a glow curve does not exhibit thermal quenching, then the highest heating rate achieved practically may be best suited for dosimetry application.
In this paper, we have made an elaborate study on effect of heating rate on trapping parameters and geometrical shape factor related with TL peak. We plan to incorporate the observations made in the present article into our future work on various heating rate method.
References
- Gorbics S.G. , Nash A.E. and Attrix F.H. , Proc. 2nd Int. on Lum. Dos. ,Gatlinburg , TN, USA,587(1968)
- Kelly P. , Braunlich P. , Abtani A. , Jones S.C.and deMurica M., Rad. Prot. Dos., 6: 25 (1984).
CrossRef
- Kathuria S.P. and Sunta C.M. , J.Phys. D :Appl.Phys., 15: 497 (1982)
CrossRef
- Vana M. and Ritzinger G. , Rad. Prot. Dos., 6:29 (1984)
CrossRef
- Garta R.K., Singh S.J., Mazumdar P.S., Phys Stat. Sol(a),106: 291 (1988).
CrossRef
- Azorin J. and Gutierrez A., Nucl. Tracks , 11:159 (1986).
CrossRef
- Dorenbos P.,Van Eijk C.W.E , Bos A.J.J. andMelcher C.L.,J.Phys. :Condens Matter, 6:4167 (1994).
CrossRef
- Sakurai T. and Gartia R.K. , J. Phys. D : Appl.Phys., 29: 2714 (1996).
CrossRef
- Trinkler L. , Cristensen P. , Larsen N.A. and Berzina B., Radiat . Meas., 29: 341 (1998).
CrossRef
- Spooner N.A. and Franklin A.D., Radiat Meas., 35: 59 (2002).
CrossRef
- Yazici A.N. , Nucl. Instrum. Methods B , 215:174 (2004).
CrossRef
- Ogundare F.O., Balogun F.A. and HussainL.A., Radiat Meas., 40: 60 (2005)
CrossRef
- Kitis G.,Spiropulu M.,Papadopoulos J.and Caralambous S., Nucl. Instrum. Methods, 73: 367(1993)
CrossRef
- Kitis G .,Papadouloulos J. , Charalambous S. and Tuyn J.W.N., Rad. Prot. Dos.,55(3),183(1991)
- Pradhan A.S., Radiat. Prot. Dosim., 33: 73(1996)
CrossRef
- Akselrod M.S. , Kortov V.S. Kravetsky D.J.and Gotlib V.I., Radiat. Prot. Dosim., 33: 119 (1990)
CrossRef
- Akselrod M.S., Larsen N.S. Whitley V. and McKeever S.W.S. , J.Appl. Phys., 84: 3364 (1998)
CrossRef
- Rasheedy M.S.and Zahran E.M., Phys. Scr.,73: 98 (2006)
CrossRef
- Munish Kumar , Prasad L.C. and Kher R.K.,Phys. Scr., 74: 273 (2006)
- Munish Kumar , Chourasiya G. , Kher R.K. ,Bhatt B.C. and Sunta C.M., Ind. J. of Pure and Appl. Phys., 47: 402 (2009)
- Rasheedy M.S.and Zahran E.M., Phys. Scr., 74: 295 (2006)
CrossRef
- Ege A. , Ekdal E., Karali T. and Prokie M.,Meas Sci Technol., 18: 889 (2007).
CrossRef
- Taylor G.C. and Lilley E. , J.Phys. D :Appl. Phys., 15: 2053 (1982).
CrossRef
- Kitis G. and Tuyn J.W.N., J.Phys. D :Appl. Phys,31: 2065 (1998).
CrossRef
- Gokee M.,Oguz K.F. , Karah T. and Prokie M.,J.Phys. D :Appl. Phys, 42: 105412 (2009).
CrossRef
- Gotlib V.I. ,Kantorovich L.N. ,Grebenshikov V.L. ,Bichev V.R.and Nemiro E.A. , J.Phys. D : Appl. Phys., 17: 2097 (1984).
CrossRef
- Betts D.S. and Townsend P.D. , J.Phys. D :Appl.Phys., 26: 849 (1993).
CrossRef
- Piters T.M. and Bos A.J.J., J.Phys. D :Appl Phys. , 27: 1747 (1994).
CrossRef
- Facey R.A., Health Phys., 12: 720 (1996).
- Randall J.T. and Wilkins M.H.F., Proc. Roy. Soc.(London) ,A184: 366 (1945).
- Garlick G.F.C. and Gibson A.F., Proc. PhysSoc. ,60,574(1948)
CrossRef
- Chen R., J. Electrochem Soc., 116: 1254(1969)
CrossRef

This work is licensed under a Creative Commons Attribution 4.0 International License.