Spectroscopic and Thermal Analysis of Synthesized Inorganic Phosphate Glass Fertilizers: A Comprehensive Characterization Study
 , Tanmoy Das1and Goutam Hazra2*
 1Department of Chemistry, The University of Burdwan, Golapbag, Burdwan, West Bengal, India.
2Department of Chemistry, Kalna College, Kalna, Purba Burdwan, West Bengal, India.
Corresponding Author Email: goutamhazra1@gmail.com
DOI : http://dx.doi.org//10.13005/msri/220307
Download this article as:
![]()
A new class of slow-release inorganic glass fertilizer was developed using the melt- quenching fashion to enable sustained nutrient delivery for different crop species. The glass formulations were melted at a temperature range of 750 – 760 °C, with a soaking period of 30 minutes. Their amorphous structure was verified by X-ray Diffraction (XRD). Fourier Transform Infrared (FTIR) spectroscopy, conducted in the 400 – 4000 cm⁻¹ range, revealed crucial optical phonon modes characteristic of the phosphate matrix, with notable absorption bands observed at 413, 471, 551, 760, 879, 920, 1087, 1110, 2193 – 2870, and 3440 – 3500 cm⁻¹. The sursurface morphology was examined using Scanning Electron Microscopy (SEM), and essential composition was assessed via X-ray fluorescence (XRF). Incorporation of MoO₃ into the phosphate glass matrix introduced Raman-active modes between 800 and 1200 cm⁻¹, attributed to symmetric and asymmetric stretching modes of molybdenum-ground polyhedral units. Specifically, the Raman peak at 996 cm⁻¹ was assigned to symmetric Mo=O stretching in distorted MoO₆ octahedra. Thermal behaviour and stability were evaluated using Differential Thermal Analysis (DTA) and Thermogravimetric Analysis (TGA). The findings emphasize the promise of phosphate-ground glass systems as effective, long-lasting, and sustainable matrices for agricultural application.
KEYWORDS:Glass fertilizer; Glass formers; Phosphate glass; Raman spectra; Thermal analysis; X-ray luminescence
Introduction
We are currently facing an environmental emergency, making the protection of our environment more critical than ever. While fertilizers play a vital role in agriculture by promoting plant growth and enhancing food production, they can also pose significant risks to the environment.1,2 Therefore, it is essential to use fertilizers judiciously and in limited quantities to ensure successful vegetation. Fertilizers should ideally dissolve quickly and supply the necessary nutrients to plants without causing contamination or environmental hazards. Today, more than 80% of global grain yield relies on fertilizers. As the world’s population continues to grow, this dependency creates new challenges, including increased soil and water pollution. Consequently, the average amount of cultivable land per capita is gradually decreasing each year, as illustrated in Fig.1.3 This trend demands that crop production per unit of land increases over time. The agricultural revolution, which has led to significant gains in crop yields per hectare, is one solution to this issue.
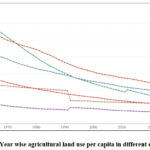 |
Figure 1: Year wise agricultural land use per capita in different continent.3 |
This challenge can be addressed in two main ways:
The development of numerous new crop varieties with higher yield potentials.
The availability of fertilizers, which are crucial for meeting the nutrient demands of crops.
Fertilizers can be classified into three categories4:
Major elements: Nitrogen (N), Phosphorus (P), and Potassium (K)
Secondary elements: Calcium (Ca), Magnesium (Mg), and Sulfur (S)
Micronutrients: Boron (B), Cobalt (Co), Copper (Cu), Iron (Fe), Manganese (Mn), Molybdenum (Mo), and Zinc (Zn)
Fertilizers often contain high levels of phosphorus, potassium, and sulfur in the form of glass, which allows for a slow release of these elements. This feature is particularly relevant for agricultural applications where controlled nutrient release is beneficial. Fertilizers, whether applied to the soil or directly to plant tissues, provide essential nutrients for plant growth and health.1 Commonly, fertilizers contain nitrogen (N), phosphorus (P), and potassium (K) as the main elements, usually in chemical compounds that can be converted by plants to meet their nutrient needs. While fertilizers are critical for agricultural success, they can have detrimental effects on the environment.2 Overuse or improper application can lead to soil degradation, the emission of greenhouse gases, and water pollution. Slow-release fertilizers have long been regarded as the best solution to mitigate the environmental problems associated with traditional, water-soluble fertilizers. These fertilizers reduce the required dosage, improve fertilizer use efficiency, and help prevent pollution.1,2 Glass fertilizers (GF) represent a new class of controlled-release fertilizers made from glass matrices. These fertilizers contain vital macro-elements like potassium, phosphorus, magnesium, sulfur, and calcium, as well as micro-elements such as boron, iron, molybdenum, copper, zinc, and manganese. These nutrients are necessary for the proper growth and development of plants, making glass fertilizers a promising option for sustainable agriculture.4-6
Materials and Methods
The glass sample, identified as GS, contains essential compounds such as Nitrogen (N), Phosphorus (P), and Potassium (K), which are crucial for crop growth. In addition, the sample includes base oxides and micro-element oxides necessary for plant development, including Iron (Fe), Zinc (Zn), Molybdenum (Mo), Boron (B), Copper (Cu), and Manganese (Mn), with each element exceeding 50 grams in quantity. Table I presents the oxide composition of GS in terms of weight (grams).
The glass batches used in this study were prepared from various raw materials, including Ammonium Dihydrogen Orthophosphate [(NH4)H2PO4], AR grade, HI Media Laboratory, Mumbai], Magnesium Oxide (MgO), and Potassium Dihydrogen Phosphate (KH2PO4, AR grade, Merck Life Science Private Ltd., Mumbai), which were used as the sources of macro-elements. To supply the necessary micro-elements, the following were added: Borax (Na2B4O7, AR grade, RANKEM, New Delhi), Ferric Oxide (Fe2O3, AR grade, Merck Life Science Private Ltd., Mumbai), Zinc Oxide (ZnO, AR grade, Merck Life Science Private Ltd., Kolkata), Molybdenum Trioxide (MoO3, AR grade, E. Merck, Germany), Manganese Oxide (MnO), and Cupric Oxide (CuO). Five glass compositions were prepared using these precursor materials which are useful as macro and micro nutrients for the plants, as outlined in Table I.
Table I: Composition of glass batches (in weight %)
| Glass ID | Composition Wight (in weight %) | |||||||
| (NH4)H2PO4 | KH2PO4 | Borax | ZnO | MnO2 | FeSO4 | MoO3 | CuO | |
| GS-A | 40 | 20 | 18 | 3 | 9 | 3 | 6 | 1 |
| GS-B | 40 | 20 | 15 | 6 | 8 | 4 | 5 | 2 |
| GS-C | 40 | 20 | 12 | 9 | 7 | 5 | 4 | 3 |
| GS-D | 40 | 20 | 9 | 12 | 6 | 6 | 3 | 4 |
| GS-E | 40 | 20 | 6 | 15 | 5 | 7 | 2 | 5 |
| GS-F | 40 | 20 | 3 | 18 | 4 | 8 | 1 | 6 |
The raw materials for the glass batches were precisely weighed using a four-decimal electronic balance (SATORIOUS, model BSA224SCW). All ingredients, in their dry form, were placed in aggregate mortars and mixed uniformly with a pestle for one hour. This mixing process was repeated three times to ensure consistency.
The glass batches were then melted using a phosphate system, as outlined in Table I. The mixture of raw materials, prepared as described above, was dried and transferred into high alumina crucibles. These crucibles were then fired in a muffle furnace, equipped with a programmer, at a temperature range of 750-760°C for a soaking period of half an hour under ambient conditions. The actual melting process lasted for two hours. Throughout this operation, both the temperature and duration of melting were critical factors that required careful monitoring.
The glass structure was verified through X-ray diffraction (XRD) analysis. The melting procedure took place in a programmable muffle furnace that was equipped with a window and temperature controller, allowing for adjustments to the temperature and melting time as needed. Table 2 provides the details of the melting conditions and time for each of the different glass batches.
Table 2: Melting point (oC) and time of Soaking period for different glass compositions
| Glass ID | M.P (±2 oC) | Soaking period (min) |
| GS-A | 750 | 30 |
| GS-B | 758 | 30 |
| GS-C | 760 | 30 |
| GS-D | 750 | 30 |
| GS-E | 760 | 30 |
The glass to be analyzed is grinded in an agate mortar, then screened through two sieves with different mesh of bore size 330 and 425 micrometer respectively. The procedure is repeated for all glass batches. All the physical properties i.e. XRD, SEM, FTIR, TGA, DTA, RAMAN and XRF of the each glass sample were measured using the 330-425 micrometer bore size glass particle.
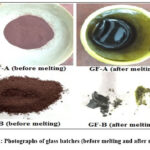 |
Figure 2: Photographs of glass batches (before melting and after melting). |
Results
The glassy state of all the samples investigated was analyzed and confirmed using X-ray Powder Diffraction (XRD) technique. As shown in Fig. 3, no crystalline peaks were observed, indicating that the synthesized glass samples are fully amorphous.
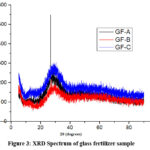 |
Figure 3: XRD Spectrum of glass fertilizer sample |
SEM images of some glass fertilizer sample were performed which has been shown in Fig. 4. The photograph indicate homogeneous nature of that the glasses formed.
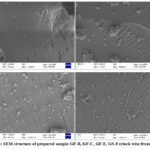 |
Figure 4: SEM structure of prepared sample GF-B, GF-C, GF-E, GS-F (clock wise from left top). |
Fig. 5(a-d) shows the FTIR spectra of the studied glasses in the range from 400 to 4000 cm-1. These spectra reveal no significant differences among the five formulas, indicating that the prepared glasses share similar chemical functional groups and bonding. In the FTIR spectra, the peaks at 736, 745, 752, and 760 cm-1 are attributed to the symmetric stretching of the P-O-P group. The absorption bands around 879, 912, and 920 cm-1 correspond to the asymmetric stretching vibrations of the P-O-P bond in linear metaphosphate chains.7-9 The peaks at 1039, 1080, 1087, and 1110 cm–¹ are associated with the asymmetric stretching between phosphorus and non-bridging oxygen, indicating the formation of terminal 2-phosphate groups (PO3–).10,11 The peak at 1627 cm-1 corresponds to the bending vibration of OH groups. The IR stretch between 2193-2870 cm-1 is attributed to P-OH stretching,7 and the range from 3440-3500 cm-1 is related to N-H stretching, while the 3600-3100 cm-1 range corresponds to O-H stretching, as phosphate glasses absorb moisture from the air.12
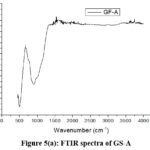 |
Figure 5(a): FTIR spectra of GS-A. |
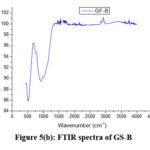 |
Figure 5(b): FTIR spectra of GS-B. |
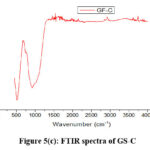 |
Figure 5(c): FTIR spectra of GS-C. |
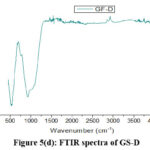 |
Figure 5(d): FTIR spectra of GS-D. |
The thermograms of the above glass samples were taken in the range 30 – 800°C. Fig. 6 shows the TGA study of the prepared glass sample and Fig. 7 shows the DTA of the same. TGA curves shows the slowly weight loss with increasing the temperature, it is due to the emission of NH3 and H2O from the glass fertilizer samples.
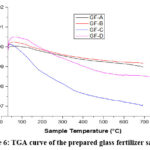 |
Figure 6: TGA curve of the prepared glass fertilizer sample. |
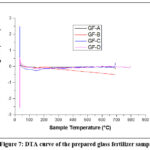 |
Figure 7: DTA curve of the prepared glass fertilizer sample. |
The experimental Raman spectrum of the glasses in the frequency region 5–3000 cm-1 is presented in Fig.8. The first low frequency peak appears at about 350 cm-1 and is related to bending vibrations of PO4 units with a cation as the modifier.13 It is well known14 that the Raman scattering bands in the 800–1200 cm-1 range are ascribed to terminal P–O stretching vibrations and those found in the 600–850 cm-1 corresponds to bridging stretching modes.15 Overlapping of bending and torsional vibrations of iron oxygen polyhedral and pyrophosphate groups (P2O7)4- can be observed at 525 cm-1. 16-19 The peaks below 600 cm-1 are in general related to different network bending modes. The peak in the range from 700 to 800 cm-1 is due to P–O–P symmetric stretch vibrations of Q2 and Q1 units. When the Q1 tetrahedrons are the majority species in iron phosphate glasses, a strong and broad band appears at 1080 cm-1 in the Raman spectrum.19 Accordingly, the observed IR and Raman scattering spectra are representative of a mixture of chain terminating Q1 species and chain forming Q2 species. The addition of iron to metaphosphate glasses causes an asymmetric broadening of the Raman scattering band at 1150 cm-1, assigned to symmetric vibration of phosphorus and nonbridging oxygen too.20 The band at 500 cm-1 has been assigned to the overlapping vibrations involving iron oxygen polyhedral and P2O7, which is a characteristic of a structure dominated by Q1 tetrahedrons.21 Low frequency bands (340 cm-1) are due to bending modes of the branched and chain network.22
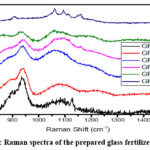 |
Figure 8: Raman spectra of the prepared glass fertilizer sample |
X-ray fluorescence (XRF) is created from a material that has been excited by bombarding with high-energy X-rays. The phenomenon is widely used for elemental analysis and chemical analysis, particularly in the investigation of metals, glass and for research in geochemistry, forensic science and archaeology. Table 3(a-f) represent the analysis data of the glass samples using the XRF technique. The data showed major elements are P, K. Mn. Fe, Cu,Zn and Mo (Qualitative Analysis). The net area and chi value, Fig. 9(a-e) are crucial in determining elemental concentrations in XRF analysis.23,24
Table 3(a): XRF data of the prepared glass sample (GF-A)
| Element | Line | Energy/keV | Cycl. | Net | Backgr. | Sigma | Chi |
| K | K12 | 3.314 | 40 | 1197 | 161 | 39 | 7.14 |
| Mn | K12 | 5.9 | 40 | 17200 | 282 | 133 | 191.83 |
| Fe | K12 | 6.405 | 40 | 14331 | 247 | 122 | 81.32 |
| Cu | K12 | 8.046 | 40 | 8220 | 311 | 94 | 114.01 |
| Zn | K12 | 8.637 | 40 | 37891 | 343 | 196 | 517.83 |
| Mo | K12 | 17.48 | 40 | 30939 | 1954 | 187 | 376.56 |
| Mo | L1 | 2.292 | 40 | 100 | 178 | 21 | 2.62 |
Table 3(b): XRF data of the prepared glass sample (GF-B).
| Element | Line | Energy/keV | Cycl. | Net | Backgr. | Sigma | Chi |
| K | K12 | 3.314 | 40 | 1417 | 206 | 43 | 4.53 |
| Mn | K12 | 5.9 | 40 | 19574 | 345 | 142 | 199.17 |
| Fe | K12 | 6.405 | 40 | 17934 | 326 | 136 | 112.75 |
| Cu | K12 | 8.046 | 40 | 16269 | 443 | 131 | 199.64 |
| Zn | K12 | 8.637 | 40 | 63284 | 487 | 253 | 816.96 |
| Mo | K12 | 17.48 | 40 | 18648 | 1951 | 150 | 202.92 |
| Mo | L1 | 2.292 | 40 | 96 | 215 | 23 | 2.13 |
Table 3(c): XRF data of the prepared glass sample (GF-C).
| Element | Line | Energy/keV | Cycl. | Net | Backgr. | Sigma | Chi |
| K | K12 | 3.314 | 40 | 1630 | 329 | 48 | 6.94 |
| Mn | K12 | 5.9 | 40 | 20973 | 549 | 149 | 218.28 |
| Fe | K12 | 6.405 | 40 | 28859 | 521 | 173 | 204.17 |
| Cu | K12 | 8.046 | 40 | 31003 | 876 | 181 | 360.37 |
| Zn | K12 | 8.637 | 40 | 121343 | 912 | 351 | 1467.04 |
| Mo | K12 | 17.48 | 40 | 30394 | 1067 | 180 | 342.23 |
| Mo | L1 | 2.292 | 40 | 102 | 328 | 28 | 2.18 |
Table 3(d): XRF data of the prepared glass sample (GF-D)
| Element | Line | Energy/keV | Cycl. | Net | Backgr. | Sigma | Chi |
| K | K12 | 3.314 | 40 | 1222 | 262 | 42 | 5.63 |
| Mn | K12 | 5.9 | 40 | 13504 | 458 | 120 | 129.87 |
| Fe | K12 | 6.405 | 40 | 25085 | 482 | 161 | 183.91 |
| Cu | K12 | 8.046 | 40 | 30266 | 784 | 178 | 361.03 |
| Zn | K12 | 8.637 | 40 | 119974 | 818 | 349 | 1438.51 |
| Mo | K12 | 17.48 | 40 | 17757 | 742 | 139 | 201.44 |
| Mo | L1 | 2.292 | 40 | 63 | 238 | 23 | 1.45 |
Table 3(e): XRF data of the prepared glass sample (GF-E).
| Element | Line | Energy/keV | Cycl. | Net | Backgr. | Sigma | Chi |
| K | K12 | 3.314 | 40 | 2043 | 427 | 54 | 9.06 |
| Mn | K12 | 5.9 | 40 | 17439 | 768 | 138 | 155.61 |
| Fe | K12 | 6.405 | 40 | 44946 | 763 | 216 | 368.73 |
| Cu | K12 | 8.046 | 40 | 54391 | 1387 | 239 | 588.25 |
| Zn | K12 | 8.637 | 40 | 214489 | 1387 | 466 | 2422.7 |
| Mo | K12 | 17.48 | 40 | 16309 | 856 | 134 | 173.06 |
| Mo | L1 | 2.292 | 40 | 45 | 433 | 30 | 1.37 |
Table 3(f): XRF data of the prepared glass sample (GF-F).
| Element | Line | Energy/keV | Cycl. | Net | Backgr. | Sigma | Chi |
| K | K12 | 3.314 | 40 | 1584 | 405 | 49 | 6.21 |
| Mn | K12 | 5.9 | 40 | 11489 | 673 | 113 | 101.63 |
| Fe | K12 | 6.405 | 40 | 41483 | 713 | 207 | 340.55 |
| Cu | K12 | 8.046 | 40 | 52419 | 1246 | 234 | 558.67 |
| Zn | K12 | 8.637 | 40 | 207214 | 1280 | 458 | 2375.99 |
| Mo | K12 | 17.48 | 40 | 8022 | 805 | 98 | 75.54 |
| Mo | L1 | 2.292 | 40 | 55 | 307 | 26 | 1.32 |
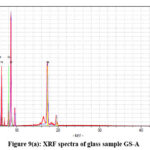 |
Figure 9(a): XRF spectra of glass sample GS-A |
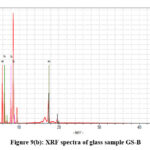 |
Figure 9(b): XRF spectra of glass sample GS-B. |
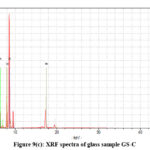 |
Figure 9(c): XRF spectra of glass sample GS-C. |
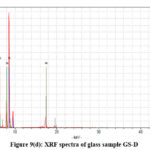 |
Figure 9(d): XRF spectra of glass sample GS-D. |
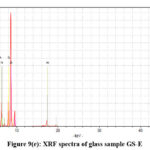 |
Figure 9(e): XRF spectra of glass sample GS-E. |
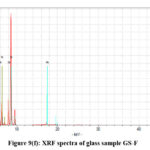 |
Figure 9(f): XRF spectra of glass sample GS-F. |
Discussion
The XRD patterns display only broad scattering peaks, known as the “halo,” with an increased background in the lower range of the 2θ angle, which is a result of X-ray scattering.7.25 The results presented in Fig. 3 are consistent with those previously published for other REO-doped phosphate glasses.26,27
In FTIR studies the feature around 1290 cm-1 is assigned to the asymmetric stretching of (PO2–) in the phosphate tetrahedron Q², with the vibration at 1155-1160 cm-1 characteristic of the symmetric stretching of (PO2–) in Q² groups [28]. The band near 1100 cm-1 is attributed to the stretching vibrations of PO32-, while the feature between 955 and 1080 cm-1 corresponds to the stretching vibration of the O-P-O bond in the phosphate tetrahedron Q¹.29 The two absorption peaks at 880 and 715 cm-1 are attributed to the asymmetric and symmetric stretching of the P-O-P bond in Q² groups, respectively. The band around 765 cm-1 is assigned to the P-O-P stretching vibrations of Q¹ species, and the bands between 550 and 480 cm-1 correspond to the bending vibrations of O-P-O and PO32- bonds, respectively.7,30,31 The FTIR bands at 555 cm-1 are linked to the stretching mode of ZnO, and the absorption peaks at 440, 580, and 620 cm-1 correspond to the stretching vibration modes of FeO bonds [28]. The absorption bands at 910 cm-1 and 857 cm-1 are attributed to the Mo-O stretching mode [31]. The band at 1189 cm-1 is associated with the B-O bond, while the peaks at 710 cm-1 and 1537 cm-1 correspond to the B-O-B and B-O+ bonds, respectively.30
The DTA (Differential Thermal Analysis) plot shows no weight changes in the sample, the resulting curves are flat lines. This indicates that no endothermic or exothermic reactions are occurring within the sample as its heated or cooled, meaning there is no phase transitions, chemical reactions, or other processes that involve heat absorption or release. The DTA measures the temperature difference between a sample and a reference material, and a flat line signifies that the sample is behaving like the reference material in terms of thermal behavior. This signifies that the sample is thermally stable within the tested temperature range and doesn’t undergo any detectable thermal events. This is due to Molybdenum (Mo) exhibits a wide range of oxidation states, from -2 to +6, and forms compounds with various coordination numbers, typically ranging from 4 to 8. Its most stable oxidation states are +4 and +6. 32, 33[32, 33]. Due to the higher coordination number at higher oxidation state Mo forms maximum number of -Mo-O-P- bonds which stabilized the glass structure.34-38
The presence of Q1 species detected by the Raman spectroscopy is confirmed in the IR spectrum, where the IR bands around 917 and 748 cm-1 correspond to asymmetrical and symmetrical P–O–P stretching modes, respectively.39 A possible explanation is that the incorporation of MoO3 into a phosphate glass produces Raman peaks in the range from 800 to 1200 cm-1 associated with the symmetric and asymmetric stretching modes of the Mo polyhedral sites. The peak at 996 cm-1 is assigned to the symmetric stretching modes of Mo=O terminal bonds in distorted MoO6 octahedra.40
The net area is directly proportional to the concentration of the analyte, while the chi-squared value helps ensure the accuracy of the measured net area by assessing the quality of the peak fitting process.41,42 A reliable net area, coupled with a good chi-squared value (i.e., a low value), provides confidence in the accuracy of the elemental concentration determination42,43 which are represented in the Table III(a-f). The experimental values nicely match with the composition of the glass samples that are also reflects in the XRF spectra, Fig. 9(a-e).
Conclusion
This study revealed the preparation of glass fertilizer by melt quenching technique; XRD and SEM morphology confirmed the glass formation. The structural bonds of the prepared glass samples has been studied through, FTIR, Raman spectra. The XRF analysis represents the presence major elements in glass fertilizer samples as taken during the glass batch preparation. SEM images of some glasses which indicate homogeneous nature of that the glasses. TGA and DTA curve show the thermal stability of glass samples and it also shows that GS-5 has high Glass transition temperature (Tg), high crystallization temperature (Tcon) and high melting temperature (Tliq). This is due to the presence of MoO3 in high percentage. The addition of MoO3 together with ZnO and Fe2O3 in the formulation provided structure rigidity and compactness, improving the mechanical properties. The density values also reflected the network features. The incorporation of MoO3 into a phosphate glass produces Raman peaks in the range from 800 to 1200 cm-1 associated with the symmetric and asymmetric stretching modes of the Mo polyhedral sites. The peak at 996 cm-1 is assigned to the symmetric stretching modes of Mo=O terminal bonds in distorted MoO6 octahedra, as found in the Raman spectrum of crystalline MoO3. The broader, lower intensity peak at 862 cm-1 is attributed to the symmetric stretching modes of Mo-O-Mo bonds between two neighborhood MoO6 octahedra. From the XRF analysis of the prepared glass sample the net area, coupled with a good chi-squared value (i.e., a low value), provides confidence in the accuracy of the elemental concentration that match with the composition of the glass samples.
Acknowledgement
The authors would like to acknowledge Late Dr. J. Mukerji, Ex. Scientist, Central Glass & Ceramic Research Institute (CSIR) and Famous Glass Technologist of the world in introducing us into this exciting field of Glass Fertilizer. They would also like to acknowledge Prof. (Dr.) D. Ray, Dept. of Chemistry, IIT, Kharagpur in performing the XRD and FTIR of the samples so also to Prof. (Dr.) T. Mandal, IACS, Jadavpur, Kolkata in performing the TGA and DTA of the samples and Sourav Pan, Scientific Officer at the Indira Gandhi Centre for Atomic Research (IGCAR) in performing the Raman spectra and to USIC, B.U. in performing the XRF of the samples.
Funding Sources
The author(s) received no financial support for the research, authorship, and/or publication of this article
Conflict of Interest
The authors do not have any conflict of interest
Data Availability Statement
This statement does not apply to this article
Ethics Statement
This research did not involve human participants, animal subjects, or any material that requires ethical approval
Informed Consent Statement
This study did not involve human participants, and therefore, informed consent was not required
Authors’ Contribution
- Sourajit Banerjee: All Experimental works and Data collection.
- Goutam Hazra: Data Analysis, Original manuscript drafting and communication with the Editor of the journal.
- Tanmoy Das: Supervision of all the work as supervisor.
References
- Hazra G. Different Types of Eco-Friendly Fertilizers: An Overview. Sustainability in Environment. 2016;1(1):54-70. https://doi.org/10.22158/se.v1n1p54
CrossRef - Hazra G. Slow or Controlled Release Fertilizers for the Holistic Approach to Economical and Environmental Issues: A Review. International Journal of Multidisciplinary Educational Research (IJMER). 2014;23(5):190-208.
- https://ourworldindata.org/land-use; Dated: 12.05.2025
- Hazra G, and Das T. A Review on Controlled Release Advanced Glassy Fertilizer. Global Journal of Science Frontier Research: B Chemistry. 2014;14(4):33-44. https://journalofscience.org/index.php/ GJSFR/article/view/1133
- Mandal B, Das T, and Hazra G. Advanced Controlled Release Glass Fertilizer: An Inner view. JETIR. 5(11):698-717.
- Saha G and Das T. Glass Fertilizer – A Historical Overview and Cult. 2023; 89(3–4):107-119. https://doi.org/10.36094/sc.v89.2023.
CrossRef - Hazra G, Mitra P, & Das T. Preparation and Properties of Lead-Iron-Phosphate Nuclear Waste Glasses. Transactions of the Indian Ceramic Society. 2019; 78(2): 69–77. https://doi.org/10.1080/ 0371750X.2019.1598281
CrossRef - Mesady IE and Alawsh S. Optical and luminescence properties of silicon doped aluminophosphate sodium glass system. J. Non-Cryst. Solids. 2018; 482: 236- 242. https://doi.org/10.1016/ j.jnoncrysol.2017.12.054
CrossRef - Nayab Rasool Sk., Moorthy LR and Jayasankar CK. Spectroscopic Investigation of Sm3+ doped phosphate based glasses for reddish-orange emission. Opt. Commun. 2013;311: 156- 162. https://doi.org/10.1016/j.optcom.2013.08.035
CrossRef - Hussin R., Salim MA, Alias NS, Abdullah MS, Abdullah S, Fuzi SAA, Hamdan S and Yusuf MN. Vibrational Studies of Calcium Magnesium Ultraphosphate Glasses. Journal of Fundamental Sciences. 2009;5: 41-53. https://doi.org/10.11113/mjfas.v5n1.286
CrossRef - Rajagukguk J, Djamal M, Hidayat R, Suprijadi S, Amminudin A, Ruangtaweep Y, Kaewkhao, J. Optical Properties of Nd3+ Doped Phosphate Glasses at 4F3/2 → 4I11/2 Hypersensitive Transitions. J. Pure and Applied Chem. Research. 2016; 5(3): 148- 156. https://doi.org/10.21776/ ub.jpacr.2016.005.03.266
CrossRef - Essien ER, Nwude DO , Okolie VE , Adams LA. Bioactive SiO2 -K2O-CaO-P2O5 glass-ceramic scaffold prepared using polyurethane foam template. Cerâmica. 2023; 69: 30-38. http://dx.doi.org/10.1590/ 0366-69132023693893391
CrossRef - X Rouse GB Jr, Miller PJ, and Risen WM Jr. Mixed alkali glass spectra and structure. Journal of Non-Crystalline Solids. 1978;28(2): 193-207. https://doi.org/10.1016/0022-3093(78)90006-6
CrossRef - Lee S, Nagata F, Kato K, Nakano T, Kasuga T. Structures and Dissolution Behaviors of Quaternary CaO-SrO-P2O5-TiO2 Materials (Basel). 2021;14(7):1736. Published 2021 Apr 1. https://doi.org/10.3390/ma14071736
CrossRef - Nelson BN, Exarhos GJ. Vibrational spectroscopy of cation‐site interactions in phosphate glasses. The Journal of Chemical Physics. 1979 Oct 1;71(7):2739-47. https://doi.org/10.1063/1.438679
CrossRef - Hudgens J, Brow RK, Tallatant DR, Martin SW. Raman spectroscopy study of the structure of lithium and sodium ultraphosphate glasses. J. Non-Cryst. Solids. 1998;223: 21- 32. https://doi.org/10.1016/S0022-3093(97)00347-5
CrossRef - Arstila H, Tukiainen M, Taipale S, Kellomäki M, & Hupa L. Liquidus temperatures of bioactive glasses. Advanced Materials Research. 2008;39-40: 287-292. http://www.scientific.net
CrossRef - Jiménez A, Crawford CL. Raman and optical spectroscopy study of iron-bearing bio-relevant phosphate glasses: Assessment of γ-ray irradiation effects. Chemical-Physics. 2023;569:111854. https://doi.org/10.1016/j.chemphys.2023.111854
CrossRef - Liang X, Li H, Wang C, Yu H, Li Z, Yang S. Physical and Structural Properties of Calcium Iron Phosphate Glass Doped with Rare Earth. Journal of Non-Crystalline Solids. 2014;402: 135–140. https://doi.org/10.1016/j.jnoncrysol.2014.05.021
CrossRef - Barik SK, Senapati A, Chakraborty S. et al.Structure and Optical Properties of Sodium Aluminium Phosphate Glass Matrix Containing Lanthanide Oxides (Ce, Pr, Nd and Gd). J Inorg Organomet Polym. 2023;33: 2093–2110. https://doi.org/10.1007/s10904-023-02645-5
CrossRef - Li H, Zou H, Sun Z, Xu Y, Wang C, Xie X, Yi J, Zhao F. Spectroscopic and Surface Crystallization Characterizations of Yttrium-Doped Phosphate Glasses. Crystals. 2022; 12(1):109. https://doi.org/10.3390/cryst12010109
CrossRef - Hsu JH, Bai K, Kim CW, Brow RK, Szabo J, Zervos A. The effects of crystallization and residual glass on the chemical durability of iron phosphate waste forms containing 40 wt% of a high MoO3 Collins-CLT waste.Journal of Nuclear Materials.2018; 500:373-380. https://doi.org/10.1016/j.jnucmat.2018.01.005.
CrossRef - Mandal B, Hazra G, Das T. Preparation and Spectroscopic Characterization of Different Glass Fertilizer. Global Journal of Enginering Science Mandal. 2019;6(4):14-26.
- Černošek Z, Chládková M, Holubová J. Chemical model of binary molybdenum phosphate glasses. Journal of Solid State Chemistry. 2021;303:122522. https://doi.org/10.1016/j.jssc.2021.122522.
CrossRef - Ahmadi F, El-Mallawany R, Papanikolaou S, Asteris PG.Prediction of optical properties of rare-earth doped phosphate glasses using gene expression programming. Rep. 2024;14:15505. https://doi.org/10.1038/s41598-024-66083-0
CrossRef - Maturi FE, Gaddam A, Brites CDS, Souza JMM, Eckert H, Ribeiro SJL, Carlos LD, and Manzani D. Extending the Palette of Luminescent Primary Thermometers: Yb3+/Pr3+ Co-Doped Fluoride Phosphate Glasses. Chem. Mater. 2023; 35(17): 7229-7238. https://doi.org/10.1021/ acs.chemmater.3c01508
CrossRef - Bellucci D, Sola A, Salvatori R, Anesi A, Chiarini L, Cannillo V. Role of magnesium oxide and strontium oxide as modifiers in silicate-based bioactive glasses: Effects on thermal behaviour, mechanical properties and in-vitro bioactivity. Mater Sci Eng C Mater Biol Appl.2017;72:566-575. https://doi.org/10.1016/j.msec.2016.11.110
CrossRef - Mandal B, Hazra G, Das T. Preparation and Spectroscopic Characterization of Different Glass Fertilizer. Global Journal of Enginering Science Mandal. 2019;6(4):14-26.
- da Silva M D C R, Bertuol DA, Lopes PP. Characterization and potential applications of new boron-phosphate glass in the CaO-P2O5-K2O-B2O3 system. Cerâmica.2022;68: 385. https://doi.org/10.1590/0366-69132022683853241
CrossRef - Radwan Sh. N. Fe3+ as the Main form of Iron Ions in Iron-Lead-Phosphate Glasses. Egypt. J. Solids. 2005;28(1): 141-149. https://doi.org/10.21608/ejs.2005.149355
CrossRef - Ghosh A, Hazra G, Mitra P, and Das T. Incorporation of Nuclear Wastes in Lead-Iron-Phospateand Uranium containing LIP Glasses. Orient. J. Chem. 2014;30(1): 87-94. http://dx.doi.org/10.13005/ojc/300111
CrossRef - Macháček J, Liška M, Hruška B. et al. Interpretation of experimental findings on the structure of glass in the CaO–MoO3–P2O5 system using a thermodynamic model including oxidation–reduction equilibria. J Therm Anal Calorim 2024;149: 11429–11442. https://doi.org/10.1007/s10973-023-12511-8
CrossRef - Znášik P. Jamnicky M. Molybdenum phosphate glasses modified by Cu2O. Journal of Thermal Analysis. 1996;46: 507–514. https://doi.org/10.1007/BF02135028
CrossRef - Gaël Poirier, Fabiola S. Ottoboni, Fábia Castro Cassanjes, Ádamo Remonte, Younes Messaddeq, and Sidney J. L Ribeiro. Redox Behavior of Molybdenum and Tungsten in Phosphate Glasses. The Journal of Physical Chemistry B. 2008;112(15): 4481-4487. https://doi.org/10.1021/jp711709r
CrossRef - QIAN M, XUE T, LI Z, et al. Effect of Molybdenum on Structure of Iron Phosphate Glasses. Journal of the Chinese Ceramic Society, 2022; 50(10): 2657-2667. https://doi.org/10.14062/j.issn.0454-5648.20220222
- Černošek Z, Chládková M, Holubová J. Phosphate glasses, what is the actual chemical composition and structure of these glasses? The view of a chemist. Journal of Solid State Chemistry. 2022;314: 123366. https://doi.org/10.1016/j.jssc.2022.123366
CrossRef - Zhang L, Ghussn L, Schmitt ML, Zanotto ED, Brow RK and Schlesinger ME. Thermal stability of glasses from the Fe4(P2O7)3-Fe(PO3)3 system. Journal of Non-Crystalline Solids. 2010; 356(52): 2965-2968. http://dx.doi.org/10.1016/j.jnoncrysol.2010.03.044
CrossRef - Arstila H, Tukiainen M, Taipale S, Kellomäki M, and Hupa L. Liquidus temperatures of bioactive glasses. Advanced Materials Research. 2008;39-40: 287-292. https://doi.org/10.4028/ www.scientific.net/AMR.39-40.287
CrossRef - Li H, Zou H, Sun Z, Xu Y, Wang C, Xie X, Yi J, Zhao F. Spectroscopic and Surface Crystallization Characterizations of Yttrium-Doped Phosphate Glasses. Crystals. 2022; 12(1): 109. https://doi.org/10.3390/cryst12010109
CrossRef - Lovi J, Sen S, Structure and rheological behavior of mixed-alkali molybdate and tungstate glasses and liquids. Journal of Non-Crystalline Solids.2024; 639: 123083. https://doi.org/10.1016/j.jnoncrysol.2024.123083
CrossRef - Mandal B, Hazra G, Das T. Preparation and Spectroscopic Characterization of Different Glass Fertilizer. Global Journal of Enginering Science Mandal. 2019;6(4):14-26.
- Černošek Z, Chládková M, Holubová J. Chemical model of binary molybdenum phosphate glasses. Journal of Solid State Chemistry. 2021;303:122522. https://doi.org/10.1016/j.jssc.2021.122522.
CrossRef - Holubová J, Chládková M, Brázdová S, Černošek Z. Chemical models of molybdenum-calcium phosphate glasses. Journal of Non-Crystalline Solids.2023;607: 122222. https://doi.org/10.1016/ j.jnoncrysol.2023.122222.
CrossRef
Accepted on: 06 Oct 2025
Second Review by: Dr. Naga Rajan
Final Approval by: Dr. YS Reddy


![]()
![]()
![]()
![]()