Influence of Potential Scan Rate on Corrosion Behaviour of Heat Treated AA 7075 Alloy in Sulphuric Acid Solution
Neeraj Kumar1*
1Department of Metallurgical and Materials Engineering, OP Jindal University, Raigarh, India.
2Department of Metallurgical Engineering, National Institute of Technology, Raipur, India.
Corresponding author Email: materialscience3@gmail.com
DOI : http://dx.doi.org/10.13005/msri/150111
Download this article as:
![]()
In this paper, the effect of scan rate on the corrosion parameters and electrochemical behaviour of Retrogression and Re-aging (RRA) heat treatment of 7075 aluminium alloy has been investigated by Potentiodynamic polarization (PD) and electrochemical impedance spectroscopy (EIS) methods. The Potentiodynamic polarization (PD) curves were obtained at various scan rates for aged aluminium alloys in 0.5 M H2SO4 solution. The results show that at high scan rates shows unpredicted fluctuation of charging current, whereas at lower scan rates fewer disturbances are observed. The aged samples were chemically and mechanically characterized. It was observed that the RRA at 0.7 h shown improved corrosion property as well as mechanical properties compared to T6 temper. The corrosion properties were confirmed by EIS and polarization experiments.
KEYWORDS:Alumiunm alloy; Corrosion; Heat treatment; Potentiodynamic polarization; Potential scan rate
Introduction
Aluminium alloys of 7075 kind containing Zn, Mg and Cu as major alloying elements have shown potential applications in automobile and aerospace applications.1 They possess good corrosion and mechanical properties than other Al alloys.2 These alloys show specific behaviour in Retrogression and Re-aging (RRA) heat treatments.3 The most important feature of the aluminium alloy is to form oxide on surface which act as a barrier.4 This barrier oxide breaks due to aggressive environments5 and thus study of the corrosion parameters of any alloy is required to understand to estimate the current and its reaction with a metal surface.6 The electrochemical processes consist of anodic and cathodic reactions in addition have current to voltage relationships that follow Butler–Volmer kinetics7,8, which is applicable for a corroding system and is shown in Eq. 1.

Where (E −Ecorr) is the over potential; E and Icorr are the applied corrosion potential and corrosion current density; βa is the anodic Tafel slope and βc is the cathodic Tafel slope. Eq.1 indicates that unless the over potentials are small compared to the Tafel slopes, a large potentially damaging currents can be generated on the material. When E is distant from corrosion potential, there can be a similar relationship between the corrosion current and corrosion potential as per the tafel equation.9
E = βa± βc log | i| (2)
Eq. 2 shows that the logarithm current is directly proportional to the applied potential at the high value of over potential and helpful for determining the corrosion current. The electrode in contact with aqueous solution tends to develop a potential difference across the interface. When metal dissolve to form ions, the metal becomes positively charged with respect to the solution. The positive ions in the solution form a layer of negative charged on the metallic surface. It means that this concept is analogues to the electrical behaviour of a capacitor. The charging current across the capacitor is directly proportional to the product of time derivative of the potential field (Scan rate) and interfacial capacitance. Thus, the effect of scan rate in the potentiodynamic experiment can be visualized. At very low scan rates, the charging current through the capacitor becomes small and at high scan rates, the fraction of charging current flows through the capacitor will be increased.10 This effect will cause an underestimation of corrosion rate and may be incorrect. In this case, it is very important to know the correct polarization data without any kind of disturbance of charging current. When studying the corrosion behaviour the effect of potential scan rates are ones concern as it is crucial to opt a potential scan rate value. Various studies have performed to check the effect of the scan rate on the corrosion behaviour of alloys11. But not much work is carried out on the Al 7075 alloy. This paper discusses the effect of scan rates on the corrosion and electrochemical behaviour of RRA treated AA 7075 alloys in acidic environment.
Materials and Experimental Methods
Five specimens each of AA 7075 alloy in cylindrical shape of 14 mm (exposed surface area of 0.785cm2) in diameter have been taken for study. All the samples were given suitable heat treatment to produce desired microstructures. Details of the heat treatment are mentioned in Table 1. All the samples were prepared using conventional metallographic up to 0.25 micron diamond polishing. Etching was carried to reveal the microstructures using Keller’s reagent (95 vol.% H2O, 2.5vol.% HNO3,1.5 vol.% HCl and 1.0 vol. % HF).
Table 1: Details of Heat treatment on aluminium alloy samples
|
S. No |
Sample |
Heat Treatment Processes |
|
1 |
T6 |
470°C /1 h+water Quenching+120°C /6 h |
|
2 |
SHT |
470°C/2 h |
|
3 |
RRA .5 h |
470°C/2 h+ water Quenching+120°C/24 h+200°C/0.5h+120°C /24 h |
|
4 |
RRA.7 h |
470°C/2 h+ water Quenching+120°C/24 h+200°C/0.7h+120°C /24 h |
|
5 |
RRA .9h |
470°C/2 h+ water Quenching+120°C/24 h+200°C/0.9h+120°C /24 h |
The Potentiodynamic Polarization (PD) and Electrochemical Impedance Spectroscopy (EIS) are measured using electrochemical characterization techniques (PGSTAT203N AUTOLAB).The three electrodes are immersing into electrolyte for electrochemical measurements. The saturated calomel electrode (SCE) as reference electrode, platinum electrode used as the counter electrode, and the aged sample served as the working in 0.5 M H2SO4 solution. An optical microscope (ZESIS inbuilt AXIO VISION Rel.4.8 software) used to capture the microstructure of aged samples. Hardness is measured by Vickers microhardness tester (Shimadzu-HMV-2E) with the applied load of 1kgf.
Results and Discussions
Metallography Examination
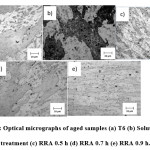
The optical micrographs of the various aged samples are shown in Fig.1. Microstructure of the aged aluminium alloys shows, elongated grains in all the directions, which is because of rolling condition and shows wide and tiny grains. The wide grains may be un-recrystallized and small grains related to recrystallized, which look like pancake structure.12 The microstructure shows dark and light regions, which is attributed to the presence of intermetallic particles (dark) uniformly, distributed in the aluminium matrix (bright).13
Figure 1: Optical micrographs of aged samples (a) T6 (b) Solution Heat treatment (c) RRA 0.5 h (d) RRA 0.7 h (e) RRA 0.9 h
 Click on image to enlarge |
Hardness Measurements
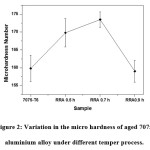
Fig. 2 shows the micro hardness measurements of Aged 7075 Aluminium alloy as a function of the various tempering process. It can be depicted from the figure, that the RRA at 0.7 h shown highest hardness [14]than other samples. The reason behind the increase of hardness is due to formation of η (coherent) and η’ (semi-coherent intermediate) phases in the aluminium matrix.15 However, the rapid decrease of hardness at RRA 0.9 is due to the partially transformation of η Phases to stable η phases in the alloys. It can be understood that the decrease of hardness further 0.7 h is due to over aging.16
Figure 2: Variation in the micro hardness of aged 7075 aluminium alloy under different temper process
 Click on image to enlarge |
Electrochemical Measurements
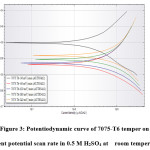
Fig. 3 shows a plot against applied potential (mV) and logarithm plot of corrosion current density (µ A/cm2) obtained for 7075-T6 aluminium alloy. The polarization experiments were carried out at varied potential scan rates from 30 mV/min to 240mV/min. The charging current across the capacitor is directly proportional to the product of time derivative of the potential field (Scan rate) and interfacial capacitance. Thus, the effect of scan rate in the Potentiodynamic experiment can be visualized. From the potentiodynamic curve, it can be clearly seen that, T6-60, T6-120, and T6 -180 specimens showed a rapid decrease in corrosion current with respect to potential. It is attributed to the formation of protective oxide film on the metal surface. On the other side, T6-30 follows the lowest corrosion rate due to the formation of uniform passive layer and show a sudden decrease in the current density. The cathodic branches for T6 -120, T6 -180 and T6 -240 exhibits a linear trend in polarization curve.
Figure 3: Potentiodynamic curve of 7075-T6 temper on different potential scan rate in 0.5 M H2SO4 at room temperature
 Click on image to enlarge |
Stern and Geary17 have simplified the kinetic expression to provide the charge transfer controlled reaction kinetics by Eq. 1 for the case of small over potentials with respect to Ecorr. The Polarization Resistance (Rp) can be calculated from slopes at Ecorr.
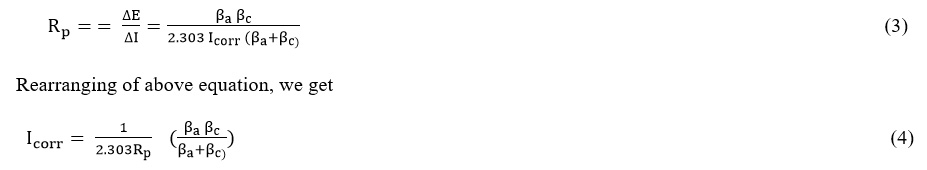
Where all the electrode parameters have their usual significance, Rp (ohm-cm2) is the polarization resistance, B is proportionality constant, corrosion potential (Ecorr) and Icorr is the corrosion current (A), EW is the equivalent weight of metal specimen (g), F is the Faraday constant (96500 C), d is the density of the metal (g /cm3). The polarization resistance values of various scan rates are determined from Stern-Geary equation17-18 and the various parameters of corrosion for aged 7075 aluminium alloys are summarized in the below Table 2.
The data show that corrosion potential (Ecorr) shifts to slightly higher negative values for low scan rate (30 mV/minutes) to high scan rate (240 mV/minutes).The change in the potential values could be possibly due to the crack of double layer on the interface.11 The difference between corrosion current and open circuit potential provides slight variation during the scan. The more difference between Ecorr and Eocp is due to the enrichment of disturbance of charging current6-19 which was observed at high scan rates. This charging current may affect both positive and negative direction. In the positive scan rate, the charging current density increase by virtue of electron flow from electrode and current will move towards anodic faradic current. The polarization will act as cathodic and similarly the direction of charging current will be considered towards cathodic faradic due to the constant flow of electrons into aged sample. It means that corrosion potential shows positive open circuit potential values at lower scan rates. The discharging current density follow the same trend at higher scan rate (180 to 240 mV/minute) but slight decrease was observed at low scan rate (30 mV/min). It has been reported in the literature that the difference between corrosion potential and open circuit potential may reflect to high disturbance of the charging current. The same was observed by Poursaee et al.11
The Potentiodynamic curve does not provide the appropriate measurement at rapid scan rate, which are representative of the system in the steady state.20 With increasing scan rate, current density slightly deviates from the steady state.11 The value of current density at 60 mV/ minute gives good agreement as compared to other results obtained at other scan rates. It can be understood by Table 2, that the electrochemical system does not achieve steady state at a high scan rate and also with very low scan rate.
Table 2: Experimental corrosion data obtained for the heat treated samples
|
Icorr (μA) |
Ecorr (mV) |
EOCP(mV) |
Ecorr-Eocp (mV) |
CR (mm/yr) |
7075-T6 |
|
2.41 X e-7 |
-0.50 |
0.05 |
1.11 |
||
|
8.08X e-8 |
-0.56 |
-0.01 |
0.01 |
||
|
5.64X e-7 |
-0.56 |
-0.55 |
-0.01 |
0.02 |
|
|
1.25X e-7 |
-0.57 |
-0.02 |
0.58 |
||
|
1.06X e-7 |
-0.58 |
-0.03 |
0.49 |
||
|
Icorr (μA) |
Ecorr (mV) |
EOCP(mV) |
Ecorr-Eocp (mV) |
CR (mm/yr) |
SHT |
|
6.4X e-7 |
-0.58 |
0.03 |
2.96 |
||
|
1.5X e-8 |
-0.62 |
-0.01 |
0.01 |
||
|
3.2 X e-8 |
-0.63 |
-0.61 |
-0.02 |
0.01 |
|
|
2.4X e-7 |
-0.62 |
-0.01 |
1.11 |
||
|
2.2X e-7 |
-0.64 |
-0.03 |
1.02 |
||
|
Icorr (μA) |
Ecorr (mV) |
EOCP(mV) |
Ecorr-Eocp (mV) |
CR (mm/yr) |
RRA0.5 h |
|
1.74X e-7 |
-0.57 |
0.01 |
0.80 |
||
|
9.8X e-8 |
-0.59 |
-0.01 |
0.01 |
||
|
1.03X e-7 |
-0.60 |
-0.58 |
-0.02 |
0.48 |
|
|
8.75X e-7 |
-0.60 |
-0.02 |
4.04 |
||
|
1.82X e-7 |
-0.61 |
-0.03 |
0.84 |
||
|
Icorr (μA) |
Ecorr (mV) |
EOCP(mV) |
Ecorr-Eocp (mV) |
CR (mm/yr) |
RRA0.7 h |
|
6.4X e-7 |
-0.55 |
0.01 |
2.96 |
||
|
5.69X e-8 |
-0.55 |
-0.01 |
0.01 |
||
|
1.53X e-7 |
-0.56 |
-0.54 |
-0.02 |
0.71 |
|
|
2.29X e-7 |
-0.58 |
-0.04 |
1.06 |
||
|
1.19X e-7 |
-0.60 |
-0.06 |
0.55 |
||
|
Icorr (μA) |
Ecorr (mV) |
EOCP(mV) |
Ecorr-Eocp (mV) |
CR (mm/yr) |
|
|
1.86X e-7 |
-0.59 |
0.02 |
0.86 |
RRA 0.9 |
|
|
6.98X e-8 |
-0.62 |
-0.01 |
0.01 |
||
|
2.27X e-7 |
-0.63 |
-0.61 |
-0.02 |
1.05 |
|
|
1.29X e-7 |
-0.63 |
-0.02 |
0.60 |
||
|
1.65X e-7 |
-0.64 |
-0.03 |
0.76 |
The data of T6 temper has been summarized from Potentiodynamic curve shown in Fig. 3. The corrosion potential, Ecorr is almost the same for T6 -60, T6-120, T6-180, and T6–240. Comparatively, T6-240 is observed to have higher potential value than other temper samples. Thus exhibiting a bit of nobility nature same as T6-30. Corrosion rates for all the samples at different scan rates (SR) follow the order: T6-30 < T6-180 < T6-240 < T6-120 < T6 -60. The lowest corrosion rate is observed for AA T6-30 (0.01 mm/year). It means that T6-30 corrodes at slower rate at minimum scan rates and this may be because promotion of oxide film on the surface.
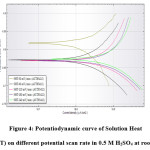
Figure 4: Potentiodynamic curve of Solution Heat Treatment (SHT) on different potential scan rate in 0.5 M H2SO4 at room temperature
 Click on image to enlarge |
Fig.4 shows the corrosion potential variation with different scan rates for a solution heat treated sample. Corrosion potential of the SHT decreases from -0.58 mV to -0.62V, as scan rate increases. Similarly, the corrosion rate of SHT-60 has lower tendency to corrode at low scan rate. It is indicated from corresponding corrosion data which clearly shows that corrosion current of film formation over the surface has significantly improved by varying scan rate. The observed sequence of corrosion rate (CR) according to the above discussion is as follows: SHT-30 >SHT-180 >SHT-240 >SHT-120 >SHT-60. In this regard, the reaction mechanism would be helpful for the formation of oxide film in presence of the sulphuric acid.
When the potential applied to the electrochemical cell, the following sequence of reaction is supposed to occur on the cathode. Sulphuric acid initiate to decompose and the hydrogen ions move to the cathode, where hydrogen gas is reduced:
2H+ + 2e− =⇒ H2 (g) (5)
Similarly, the negatively charged anions such as hydroxide, sulphate, and some other oxide ions goes to the anode side, which acts as working electrode in the cell. The dissolution of aluminium in form of positively charged aluminium ions (Al3+) moves toward the cathode. On the anode surface, they react with the oxide or hydroxide ions to form a high oxide barrier of Al2O3. The reaction on anode is mentioned below:
Apart from the Aluminium oxide, the sulphate ions also play a vital role by forming an oxide coating that contains very few percentages of sulphate ions. It is believed that the sulphate ions assist the movement of hydrogen ions and thus reducing the corrosion potential. Secondly, in the presence of acid solution, a dense even layer of oxide film is formed on the metal surface. It is the passivity that break downs when kept in the aggressive medium.5-18
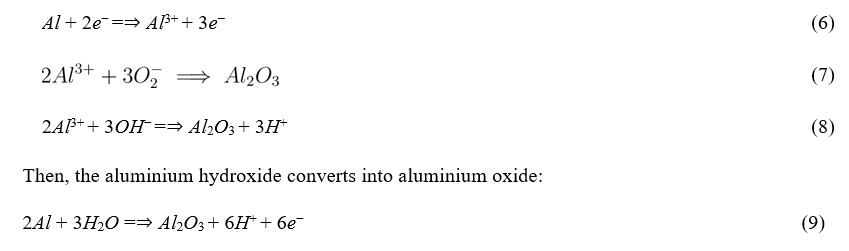
Figure 5: Potentiodynamic curve of RRA 0.5 h on different potential scan rate in 0.5 M H2SO4 at room temperature
 Click on image to enlarge |
It can be observed from Fig.5 and as well as from the corrosion data (Table 2), the corrosion of RRA-0.5h-180 is more than the RRA-0.5h -30 and RRA-0.5h -240 alloys in acidic environment. This can be confirmed by the increase of the corrosion parameters with scan rates. The values of polarization resistance obtained for aged aluminium alloys have shown an increasing trend from RRA 0.5-60 to RRA0.5- 180 with respect to scan rate. Further, the less negative shift of corrosion potential as can be seen from Fig.5 and also the corrosion rate (CR) increased in the specific scan rate. It is important to mention that the corrosion current increases nonlinearly during scan rate from 60 mV/min. to 240 mV/min. The reason behind increasing current is due to the breakdown of protective oxide film.
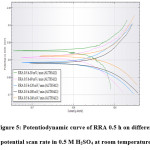
Figure 6: Potentiodynamic curve of RRA 0.7 h on different potential scan rate in 0.5 M H2SO4 at room temperature
 Click on image to enlarge |
Fig. 6 depicts that the cathodic and anodic current density show a decreasing trend within finite values of scan rate. This can be attributed to the formation of film on the metal surface and is observed to have no effect on the higher side of scan rate. The Corrosion potential (Ecorr) shifts to the less negative direction. The slightly variation in corrosion rate of the aged aluminium samples with increasing the potential scan rate are confirmed by the polarization parameters from Table 2.
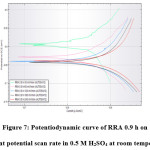
Figure 7: Potentiodynamic curve of RRA 0.9 h on different potential scan rate in 0.5 M H2SO4 at room temperature
 Click on image to enlarge |
Fig. 7 shows that anodic and cathodic current increased in one order on higher scan rate and also corrosion potential (Ecorr) shifted to negative direction. The corrosion rate (CR) decreases at RRA0.9h when at higher scan rate. This is interesting because with increasing scan rates from 30 mV/min to 240 mV/min, a correspondingly small variation of corrosion current is observed and it is due to formation of adherent film on surface.
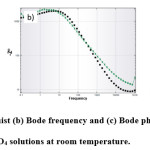
Figure 8: (a) Experimental Nyquist (b) Bode frequency and (c) Bode phase angle plots for T6 and RRA 0.7Aged alloys in 0.5 Molar H2SO4 solutions at room temperature
 Click on image to enlarge |
The Nyquist plots of aluminium alloy in 0.5 Morality of H2SO4 solution with different ageing treatments are depicted in Fig. 8. It is clearly seen in Fig.8 that only one semicircle for aged RRA0.7h in the sulphuric acid solutions is observed. The variation from ideal semi-circular shape are due to frequency distribution of interfacial impedance which probably came into existence by formation of a porous oxide layer on metal surface. The diameter of the semicircle plotted with their centre under real axis for RRA 0.7h is recorded as the highest value which indicates that the corrosion resistance for aged aluminium at 0.7 h is more than the AA 7075-T6 temper treated sample. This reveals that with increase of aging time on the material, not only the corrosion resistance is increased, but also helps to identify the favourable heat treatment required for enhancement of the corrosion properties under acid environments.21 It also discourses that there is a possibility of enhancing the corrosion properties due to distribution of precipitates in the matrix.
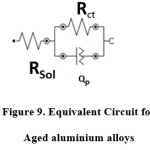
Fig. 8(c) shows the Bode phase angle plots of various Aged 7075 alloy. The equivalent circuit is shown in below Fig. 9.The electrochemical parameters are defined as the Rct charge transfer resistance, Rsol represents solution resistance, and Qp (CPEp) is the constant phase elements of double oxide layer. The CPEp is the function of frequency (Hz) and capacitance(C) which defined as the following equation.

where j2 =-1 and n range 0 -1, when n = 0, Qp will behave as resistor, when n=1, as purely capacitance with homogeneous surface.22 The fitting values of aged alloys are shown in Table 3.
Table 3: Electrochemical Fitting parameters for aged 7075 aluminium alloy in 0.5 M H2SO4
|
Temper |
Rsol |
Rct |
Qn (CPE) |
n |
|
RRA 0.5h |
8.4915 |
1417.6 |
5.869E-06 |
0.87 |
|
RRA 0.7h |
12.031 |
1814 |
1.369E-05 |
0.76 |
|
RRA 0.9h |
6.433 |
933.04 |
7.656E-06 |
0.88 |
The obtained values of n from Eq.10 are observed to be less than 1 that means it is behaving like a resistor. It can also be understood that there can be a possibility of corroding surface and the same has been reflected in the Rct values.
Figure 9: Equivalent Circuit for Aged aluminium alloys
 Click on image to enlarge |
Conclusions
The effect of potential scan rates on various corrosion parameters of heat-treated AA 7075 alloy are studied in 0.5M H2SO4 solution. Samples were subjected to Retrogression and Re-aging (RRA) treatment and Solution heat treatments. Potentiodynamic test plays a vital role in the electrochemical test, the absolute scan rate is an essential parameter to determine the corrosion rate. It affects the difference between corrosion potential and potential at an open circuit. It has been observed from the experiments that the corrosion rate is always higher at high scan rate due to more discharging current on the surface. On the other hand, if scan rate is slow, the system may deviate from correct value during the measurement and can indicate unsteady state condition. The RRA 0.7 h displays the characteristic age hardening process and attains maximum hardness value compared to the T6 temper sample. EIS measurements show that the corrosion resistance of RRA 0.7 h is more compare to T6 heat treatment process. With increase in aging time, the corrosion resistance is observed to be increased. This study clearly demonstrates that potentiodynamic studies can be used to disclose the electrochemical interaction of an alloy in an acidic environment.
Acknowledgements
The authors express their sincere gratitude to Emeritus Prof. K.A.Natarajan, Indian Institute of Science, Bangalore for valuable suggestions. The authors also wish to extend their sincere thanks to Shri Naresh Kumar Maheswari, Director, and other people in Tirumala Balaji Alloys Pvt. Ltd. for their supports in heat treatment tests. Authors, NK and MKP specially thank Dr A. K. Srivastava, OP Jindal University for his support and encouragement.
Funding Source
The author declares that the funding is done by author only.
Conflict of interest
The author(s) declare(s) that there is no conflict of interests regarding the publication of this article.
References
- Chen J., Zhen L., Yang S., Shao W & Dai S., et al. Investigation of precipitation behavior and related hardening in AA 7055 aluminum alloy. Mat. Sci and Eng. A. 2009;500:34–42.
CrossRef - Chun F., Zhi-yi L., Ai-lin N., Yan-bin Z. S. L., et al. Retrogression and re-aging treatment of Al-9.99%Zn-1.72%Cu-2.5%Mg-0.13%Zr aluminum alloy. Trans. of Non. 2006;1163–1170.
- Butler J. A. V., M. S., et al., A Kinetic Theory of Reversible Oxidation Potentials at Inert Electrodes. Trans. Faraday Soc. 1924;19;734–739.
CrossRef - Krishnan A., Raja V. S & Mukhopadhyay A., et al. K. Influence of Retrogression and Re-aging on the Exfoliation Corrosion Behavior of AA 7085 Sheets. 2016;15(4):159–165.
- Kumar N., Manoj M. K & Haldar R., et al. Effect of Re-Aging on Strength , Corrosion and Dry Sliding Wear Behavior of 7075 Aluminum Alloy. J. Mater. Sci. Nanotechnol. 2016;4(2):1–8.
CrossRef - Rout K. P., Ghosh M & Ghosh K., et al. Effect of Interrupted Ageing on Stress Corrosion Cracking (SCC) Behaviour of an Al-Zn-Mg-Cu Alloy. Procedia Materials Science. 2014;5:1214–1223.
CrossRef - Stern M and Geary A. L., Stern M and Geary A. L., et al. J. Electrochem. Soc. 1957:104:56.
CrossRef - Mccafferty E., et al. Validation of corrosion rates measured by the Tafel extrapolation method. Corros. Sci. 2005;47(12):3202–3215.
CrossRef - Oliveira A. F., de Barros M. C., Cardoso K. R & Travessa D. N., et al. The effect of RRA on the strength and SCC resistance on AA7050 and AA7150 aluminium alloys. Mat. Sci and Eng. A. 2004;379:321–326.
CrossRef - Popov K. I., Keča D. N & Andjelić M. D., et al. Electrodeposition of zinc on copper from alkaline zincate solutions. J. Appl. Electrochem. 1978.
CrossRef - Poursaee A.,, et al. Determining the appropriate scan rate to perform cyclic polarization test on the steel bars in concrete. Electrochimica Acta. 2010.
- Rendigs K. H., et al. Aluminium Structures Used in Aerospace – Status and Prospects-. Materials Science Forum. 1997;242:11–24.
CrossRef - Robert G. K., John R. S., Shoesmith D., R. G. B., et al . Electrochemical Techniques in Corros. Sci. and Eng. CRC Press.
- Lowson R. T. Aluminium corrosion studies. IV. Pitting corrosion. Aust. J. Chem. 1978;31(5):943-56.
CrossRef - Wernick S., Pinner R., P. The Surface Treatment and Finishing of Aluminum and Its Alloys. 1972.
- Sherif E. S. Corrosion and corrosion inhibition of aluminum in Arabian Gulf seawater and sodium chloride solutions by 3-amino-5-mercapto-1, 2, 4-triazole. Int. J. Electrochem. Sci. 2011;6(5):1479-92.
- Stern M., et al., Electrochemical Polarization. Journal of The Electrochemical Society. 1957.
- Su, R., Qu, Y., You, J., & Li, R., et al, Study on a new retrogression and re-aging treatment of spray formed Al–Zn–Mg–Cu alloy. Journal of Materials Research. 31(5):573–579.
- Tafel J. Über die Polarisation bei kathodischer Wasserstoffentwicklung ,Zeitschrift Für Physikalische hemie. 1905.
- Zhanga X. L., Zh H. J.,Zh P. Y., Songa Y., Z. D. W., et al. Effects of Scan Rate on the Potentiodynamic Polarization Curve Obtained to Determine the Tafel Slopes and Corrosion. Corros. Sci. 2016;581–587.
- Yan-Ping X., Qing-Lin P., Wen-Bin L., Xiao-Yan L., Y. B. H., et al. Influence of retrogression and re-aging treatment on corrosion behaviour of an Al–Zn–Mg–Cu alloy. Mater. Des. 2011;32(4):2149–2156.
CrossRef - Yang W., Ji S., Zhang Q & Wang M., et al. Investigation of mechanical and corrosion properties of an Al – Zn – Mg – Cu alloy under various ageing conditions and interface analysis of η ′ precipitate. MAter. Des. 2015;85(15):752–761.
CrossRef
Accepted on: 16 March 18


![]()
![]()
![]()