Examination Through Experimentation of the Utilization of Paper, Pulp and Waste Cloth in Concrete
 , S. Nandhini1 and K. Mohan Das2
 1Department of Civil Engineering, Tamilnadu College of Engineering, Coimbatore, Tamilnadu, India.
2Department of Civil Engineering, CMR College of Engineering and Technology, Hyderabad, Telangana, India.
Corresponding Author E-mail:pathi_seethu@yahoo.co.in
DOI : http://dx.doi.org/10.13005/msri/210105
Download this article as:
![]()
The objective is to establish relationships between these strength parameters and the incorporation of Bio-waste materials, including different proportions of paper mass and discarded textiles, in the concrete mix. Additionally, tile samples are cast to assess the impact resistance behavior. Two types of bio-concrete have been developed, and their distinctive properties, including compressive strength of cubes, Split tensile strength of cylinders, flexural strength of beam, water absorption absorptive, and surface treatment, are studied. To evaluate the potential practical applications of these materials, all the conducted tests are compared with those performed on control concrete. The bio-concrete gives equal strength compared with control conventional concrete. The BC gives 90% of results from control concrete and the weight of the concrete is very low compared with normal concrete.
KEYWORDS:Bio-Waste; bio-concrete; Concrete Mix; Pulp; Surface Treatment; Waste Cloth; Water Absorption
Introduction
General
India produces more than 300 million tons of industrial waste annually from chemical and agricultural processes. These materials have issues with waste, health risks, and visual issues. Recycled paper fibers can only be used a certain number of times before they become too weak or short to be used to produce high-quality paper. It indicates that the fragmented, inferior paper fibers are extracted and turned into waste sludge. Because silica and magnesium characteristics help the concrete set more quickly, paper sludge behaves like cement 1. Sludge content varies from mill to mill. A recycled paper mill’s sludge output is mostly determined by the kind of furniture it uses and the final product it produces. The sort of furniture being used and the final product being produced have a significant impact on the amount of sludge that a recycled paper mill produces. When making new concrete meant for affordable housing projects, paper mill sludge can be utilized as an alternate resource that is partially substituted for fine aggregates 2.
With every tone of recycled paper produced, over 300 kg of sludge are created. Paper mill sludge is heavy and produces a significant amount of sludge every day, making landfilling it unfeasible. Concrete mixtures with residuals can be made to have the same slump and strength as a reference concrete without residuals by modifying the mixture to an equivalent density 3. About 5.3 million metric tons of mill wastewater-treatment residuals (on an oven-dry basis) were produced in 1995 by the pulp and paper sector in the United States. This is equal to approximately 15 million metric tons of dewatered (wet) residuals. A quarter was burned, one eighth was put to farms or forests, one sixteenth was recycled or reused in mills, and the remaining sixteenth was utilized in other ways 4. Approximately half of this was disposed of in landfills or lagoons. The main ingredients of pulp and paper mill residual solids, commonly known as sludge, are cellulose fibers, moisture, and papermaking fillers, which are primarily calcium carbonate and/or kaolinitic clay 5. Utilizing the widely dispersed industrial wastes in civil construction practices could actually result in a major drop in the Sumit S. P. Raut, A. Balwaik, International Journal of
Technical Research and environmental contamination from the manufacturing of paper and lime wastes significantly reduce the cost of building infrastructure 6. As a landfill disposal substitute, the use of paper-mill residuals in concrete formulations has been studied 7.
Alumina and magnesium oxide are the next most common ingredients in the raw dry paper sludge, after silica and calcium oxide. The drop in compressive strength of cement mixed with 10% and 20% calcined paper sludge is less than that of the control cement 8. A Spanish study on the repurposing of paper de-inking sludge demonstrates the material’s potential as a starting point for the production of pozzolanic activity 9. When the appropriate dosage of a high-range water-reducing agent (HRWRA) was applied, the compressive strength, average residual strength, and drying shrinkage of the residual-containing concrete were likewise comparable to the reference concrete without residuals 10-11.
Literature
R. Ilakkiya, etal(2018)
India has a significant problem with trash disposal in its numerous landfills, many of which are close to or full. The state of the landfills is leading to expensive disposal expenses and possible environmental issues. In the event that trash production keeps growing at the current rate of 5% annually, landfills will be fully booked by 2020. This paper presents the findings of an experimental study on waste paper concrete, which is intended to be utilised as an additional ingredient in concrete mixes for residential projects. The mechanical strength of the waste paper concrete must be ensured. The preparation of concrete mixes with different ingredients from the paper allowed for the determination of fundamental strength parameters including splitting tensile and compressive strength.
Raunaq Singh Suri et al (2018)
To examine how waste paper affects concrete quality. Using the paper in structural concrete may prove to be an advantageous and affordable replacement for landfills. Further study on using waste paper as a modern, reusable fabric in concrete fabrication is possible. In lieu of transferring waste to landfills, an exploration was conducted into the utilization of paper mill pulp in concrete molds.
Mohammad Abu NasirRakib (2017)
The most crucial element in designing clothing for a certain function is fiber identification. Different textile fibers are identified in this study using both nontechnical and technical tests. Non-technical tests include sensation and burning tests, while technical tests include chemical and microscopic tests. Technical tests are more accurate than nontechnical tests, making them more legitimate.
T. Subramani, G. Shanmugam (2015)
states that the aim of the project was to determine the strength and durability characteristics of high strength structural concrete by using recycled coarse aggregates with papercrete, which will give better understanding on properties of concrete with recycled aggregates and to determine the compressive strength of papercrete.
In a study of “Structural properties of a new material made of waste paper” by Fuller B., Fafitis A. and Santamaria J, they have conducted some mechanical and physical parameters of papercrete to provide low cost, sustainable housing.
Seyyedeh Fatemeh Seyyedalipour et al(2014), state in their research work published in 2014 that the purpose of “Study of Utilization of pulp and paper Industry wastes in Production of Concrete” was to investigate the using of pulp and paper industry wastes in various concrete mixes containing various contents of the waste to reduce environmental effects of these wastes disposal.
A Study of Papercrete towards building sustainable and resilient Infrastructure” by Syed Kaiser Bukhari, Maqbool Yousuf and Ayaz Mahmood Dar states that the investigations show that the papercrete can be used as a very good supplement of wood as it has strengths comparable to wood. The total weight, cost and CO2 emissions during its production as compared to the normal concrete are considerably reduced. The study also concluded that the dried papercrete has rough surface which increases its surface area and provides a very strong bond from one block to the next. There are significant challenges in constructing with papercrete but also opportunities.
Material used
Following are the materials used for the present investigation of Biocrete Concrete.
Cement
Cement is a type of bonding agent that possesses cohesive and adhesive qualities, enabling it to join various construction materials and create compacted assemblies. Because of its hue and quality when it hardens like Portland stone, Joseph Aspdin gave Portland cement its name in 1824. Portland stone, found on the island of Portland in Dorset, is a white grey limestone. It consists of two main constituents viz, the main – ingredient is calcium carbonate. Various constituents (ingredients) of an “Ordinary Portland Cement (OPC) are: Cao (Lime) – 62%, Sio2 (Silica) – 22%, Al2O3 (Alumina)-5%, Calcium Sulphate – 4%, Fe2O3 (Iron Oxide ) – 37%, Mgo (Magnesium Oxide )- 2%, SO3 (Sulphur Trioxide) – 1% and Alkalis – 1%”.
Sand
Aggregates play a pivotal and essential role in concrete, constituting the predominant portion of the material, accounting for 70% to 80% of its overall volume. Concrete can be considered as a two phase material, viz., paste and aggregate phase. Coarse aggregate are usually those particles which are retained on an I.S 4.75 sieve. Aggregates below 4.75 mm. The fineness modulus of sand is 1.8.
Aggregate
Hard and durable stones like granite, ballast, and quartzite are excellent choices for coarse aggregates. In the case of reinforced concrete, only crushed aggregates with a size of 20mm are typically deemed satisfactory. The aggregate should be absolutely clean, free from organic matter and other impurities. The aggregates must be capable of resisting weather.
Water
Because it actively engages with cement, water is a crucial component of concrete. The hydrated cement gel’s binding action is primarily responsible for cement concrete’s strength.
Papermass
Initially, the used newspaper was roughly chopped into 2.5 cm by 2.5 cm pieces.The trash newspapers were soaked in tap water for two days before being ground in a wet grinder to create the paper pile. The paper mass was ground until the fiber mass was finely separated. This concrete contains additional paper mass in addition to cement mass.
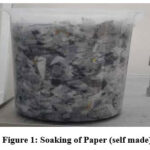 |
Figure 1: Soaking of Paper (self made). |
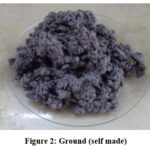 |
Figure 2: Ground (self made). |
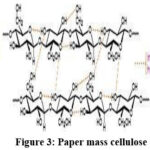 |
Figure 3: Paper mass cellulose |
Paper mass Chemistry of Cellulose
The main ingredient in paper is cellulose from wood, which is regarded as a fibrous substance. After rock, cellulose is the second most common material on the planet. It serves as the primary component of plant cell walls and forms the foundational material for numerous textiles, including paper.
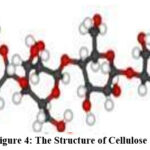 |
Figure 4: The Structure of Cellulose |
Waste Cloth
the discarded textiles gathered from the area around the tailor shop.The fabric is made of rayon, silk, polyester, and cotton. After that, the waste fabric pieces are cut into 1 to 2 cm average lengths. The material was cut and then washed with powdered detergent and dried in the sun. Waste fabric is added to the cement mass in this concrete.
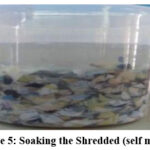 |
Figure 5: Soaking the Shredded (self made) |
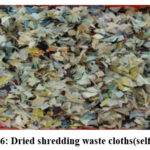 |
Figure 6: Dried shredding waste cloths(self made) |
Experimental test on materials
Physical properties
Cement
Specific gravity of the cement using pycnometer flask Procedure
Find the empty weight of the pycnometer flask, together with cap And washer (w1 in grams) Take a sample of cement that fills the flask about halfway, then weigh it using the stopper (w2 in grammes).To fill the flask with CG water until it is roughly halfway full. Using a glass rod, thoroughly mix to release trapped air. Stirring continuously, add more kerosene until the mixture reaches the graduated mark. Wet the outside and the mass (w3).
Calculate the specific gravity using the expression.
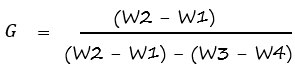
Observation and calculations
“Weight of the empty gravity bottle (W1) = 30 gm
Weight of empty gravity bottle+cement (W2) = 46 gm
Weight of the gravity bottle + cement + kerosene (W3) = 87gm
Weight of the gravity bottle+water (W4) = 76 gm
= ((W2-W1)/(W2-W1)-(W3-W4))
= ((46-30)/(42-30)-(87-76)) SPECIFIC GRAVITY (G) = 3.15”
Bulk Density of Cement
Weight of Mould = 2.72 kg
Weight of Mould + CEMENT = 6.92 kg
Weight of CEMENT = 4.200 kg
Volume of Mould = (π x 0.0752 x 0.17)
= 0.003 m3
Density of CEMENT = 4.200/ 0.003
= 1400 Kg/ m3
Table 1: Physical properties of cement.
|
Specific Gravity |
3.15 |
|
Bulk Unit Weight |
1400 m3 |
Fine aggregate
Specific gravity of the fine aggregate using pycnometer flask Procedure
Find the empty weight of the pycnometer flask, together with cap And washer (w1 in grams). Place a portion of fine aggregate into the flask, filling it up to approximately half, and record its weight with the stopper as w2 in grams. Proceed to add distilled water until the flask is filled to about halfway. Utilizing a glass rod, thoroughly stir the mixture to eliminate any trapped air. Once the water level aligns with the graduated mark, stir again and add additional water if necessary. Wet the exterior and determine the combined mass (w3). If a vacuum pump is accessible, it can be employed to release any remaining trapped air. Following the evacuation of the flask, wipe its exterior dry and measure its weight. Refill the flask with fresh water and flush it until the water reaches the graduated mark (w4).
Calculate the specific gravity using the expression.

Weight of empty pycnometer bottle(W1) = 450 grams
Weight of pyconometerbottle+fine aggregate(W2) = 781 grams
Weight of pycnometer bottle + fine aggregate + water (W3) = 1490 grams
Weight of pycnometer bottle + water (W4) = 1280 grams
Calculation:

Specific Gravity (G) = 2.73
Water absorption test on fine aggregate
“Weight of the fine aggregate before testing(W1) = 1000 gm
Weight of the fine aggregate after surface drying (W2) = 2979 gm
So the absorption of fine aggregate = ((W2-W1)/W1)X100
= ((3000-2979)/(3000))X100
= 0.7%.”
Bulk Density of Fine Aggregate
Weight of Mould = 2.27 Kg
Weight of Mould + FA = 6.965 kg
Weight of FA = 4.245 kg
Volume of Mould = (π x 0.0752 x 0.17)
= 0.003 m3
Density of FA = 4.245/ 0.003 = 1415 Kg/ m3
Table 2: Physical properties of FA
|
Specific Gravity |
2.73 |
|
Bulk Unit Weight |
1415 Kg/ m3 |
|
Water Absorption Test |
0.7% |
Coarse Aggregate
Specific gravity of the coarse aggregate using pycnometer flask Procedure:
Find the empty weight of the pycnometer flask, together with cap And washer (w1 in grams). Fill the flask with roughly half of a coarse aggregate sample, then weigh it using the stopper (w2 in grammes).To fill the flask with CG water until it is roughly halfway full. Using a glass rod, thoroughly mix to release trapped air. Once it is flush with the graduated mark, stir it again and add extra water as needed. Wet the outside and the mass (w3). If a vacuum pump is available, it can be used to release trapped air. After emptying the flask, wipe dry the exterior and weigh it, then fill it back up with fresh water and flush using the graduated mark (w4).
Calculate the specific gravity using the expression.

Observation and Calculations
“Empty weight of Mould (W1) = 0.699 Kg
Weight of mould + coarse Aggregate (W2) = 1.030 Kg
Weight of Mould + coarse aggregate + Water (W3) = 1.692 Kg
Weight of Mould + Water (W4) = 1.495 Kg
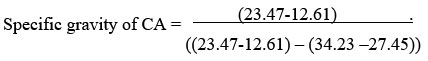
Specific gravity of CA = 2.66.”
Water absorption test on coarse aggregate
“Weight of the coarse aggregate before testing (W1) = 1000 gm
Weight of the coarse aggregate after surface drying (W2) = 1000gm
= ((W2-W1)/W1)X100
= ((1000-1000)/1000)X100
= 0 %”
Bulk Density of Coarse Aggregate
Weight of Mould = 12.60 kg
Weight of Mould + CA = 33.35 kg
Weight of CA = 20.75 kg
Volume of Mould = (π x 0.1252 x 0.305)
= 0.015 m3
Density of CA = 20.75 / 0.015
= 1383 Kg/ m3
Table 3: Physical properties of CA
|
specific gravity |
2.66 |
|
bulk unit weight |
1383 Kg/ m3 |
|
water absorption test |
0% |
Paper Pulp
Specific gravity of the paper pulp:
Procedure
Find the empty weight of the pycnometer flask, together with cap And washer (w1 in gram). Take a sample of paper pulp, filling the flask up to approximately half, and record its weight with the stopper as w2 in grams. Add water to the paper pulp in the flask until it reaches about halfway full. Utilize a glass rod to thoroughly mix the contents and eliminate any entrapped air. Continue stirring while adding more water until the level aligns with the graduated mark. Dry the exterior and determine the combined mass (w3). If a vacuum pump is accessible, it can be used to remove any remaining entrapped air. Empty the flask, clean it, refill it with clean water until it reaches the graduated mark, wipe the exterior dry, and measure the weight (w4).
Calculate the specific gravity using the expression.

“Weight of empty pycnometer bottle(W1) = 450 grams
Weight of pyconometer bottle + coarse aggregate(W2) = 600 grams
Weight of pycnometer bottle + coarse aggregate + water (W3) = 1452grams
Weight of pycnometer bottle + water(W4) = 1280grams G =1.95”
Table 4: chemical composition of paper pulp
|
S.NO |
ELEMENT |
% CONTENT |
|
1 |
Ca |
14.93 |
|
2 |
Si |
16.54 |
|
3 |
O |
15.82 |
|
4 |
S |
1.10 |
|
5 |
Mg |
3.60 |
|
6 |
k |
0.20 |
|
7 |
AL |
2.05 |
|
8 |
Na |
0.23 |
Cloth Waste
Specific gravity
Procedure
Find the empty weight of the pycnometer flask, together with cap And washer (w1 in grams). Measure out a sample of fabric waste to fill the flask halfway, then weigh it using the stopper (w2 in grammes).To fill the flask about halfway with water and add CG. To release trapped air, thoroughly mix with a glass rod. Stirring continuously, add more water until the mixture is flush with the graduated mark. Desiccate the exterior and weight (w3). If one is available, a vacuum pump can be used to release trapped air. Remove the contents from the flask, rinse it with fresh water, wipe off the exterior, and weigh it (w4).
Calculate the specific gravity using the expression.

Weight of empty pycnometer bottle(W1) = 450grams
Weight of pycnometer bottle + coarse aggregate (W2) = 554grams
Weight of pycnometer bottle + coarse aggregate + water (W3) = 1320grams
Weight of pycnometer bottle + water (W4) = 1280grams
Calculation:

Mix Design and Test
Mix proportions
The mix proportions of various percentage of waste cloth are shown in table
Table 5: Mix Proportions of Waste Cloth Concrete.
|
Mix designation |
OPC |
SAND |
COARSE AGG |
% OF WASTE CLOTH |
W/C (%) |
|
C |
1.00 |
1.5 |
2.00 |
– |
0.40 |
|
T1 |
1.00 |
1.5 |
2.00 |
1 |
0.40 |
|
T2 |
1.00 |
1.5 |
2.00 |
2 |
0.40 |
|
T3 |
1.00 |
1.5 |
2.00 |
3 |
0.40 |
|
T4 |
1.00 |
1.5 |
2.00 |
4 |
0.45 |
|
T5 |
1.00 |
1.5 |
2.00 |
5 |
0.45 |
Table 6: Mix Proportions of Papercrete
|
Mix designation |
OPC |
SAND |
COARSE AGG |
% OF WASTE CLOTH |
W/C (%) |
|
C |
1.00 |
1.5 |
2.00 |
– |
0.40 |
|
P1 |
1.00 |
1.5 |
2.00 |
2.5 |
0.40 |
|
P2 |
1.00 |
1.5 |
2.00 |
25 |
0.40 |
|
P3 |
1.00 |
1.5 |
2.00 |
7.5 |
0.40 |
|
P4 |
1.00 |
1.5 |
2.00 |
10 |
0.45 |
|
P5 |
1.00 |
1.5 |
2.00 |
12.5 |
0.45 |
|
P6 |
1.00 |
1.5 |
2.00 |
15 |
0.45 |
|
P7 |
1.00 |
1.5 |
2.00 |
17.5 |
0.50 |
Test Procedure
Cube Compression Test: (ASTM C109/C109M)
Concrete cubes measuring “100 mm x 100 mm x 100 mm” were cast and subsequently subjected to a curing period of 28 days in tap water. After the period of curing the specimens are dried in open air and tested for cube compressive strength using AIMIL compression testing under digital universal testing machine of 1000 tonne capacity at a rate of loading was so adjusted as 0.2 to 0.4 MPa /sec as per British standards specification (BS: 1881: part 116:1983).
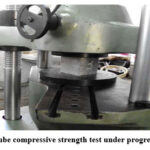 |
Figure 7: Cube compressive strength test under progress(self made). |
Cylinder Compression Test (fcy) (ASTM-39-86)
For the determination of cylinders compression of the waste cloth and paper mass concrete specimens. Cylinders of diameter to length ratio 1:2 were used with the dimensions as 50 mm diameter x 100 mm length. Specimens were dried in open air after 28 days water curing and subjected to cylinder compression test as per ASTM standards ASTMC-39-89, with the rate of loading as 0.15 to 0.34 MPa/sec.
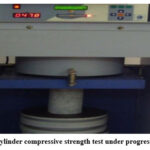 |
Figure 8: Cylinder compressive strength test under progress(self made). |
Splitting Tensile Strength Test (fsp) (ASTMC 496-90)
Cylinder specimens with a diameter of 50 mm and a length of 100 mm were chosen in order to determine the splitting tensile strength of the waste cloth and paper mass concrete examples. After 28 days of curing, the specimens were dried outdoors and put through a splitting tensile test using universal testing equipment. In accordance with ASTM C496-90, the loading rate was changed from 0.11 to 0.023 MPa/sec.
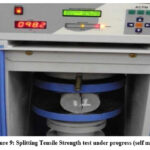 |
Figure 9: Splitting Tensile Strength test under progress (self made). |
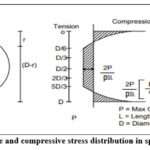 |
Figure 10: Tensile and compressive stress distribution in splitting tensile test |
Flexural Strength Test: (ASTM C 78-09)
After 28 days of curing, 50 x 50 x 300 mm beam specimens were dried in the open air and put through a flexural strength test using flexural testing equipment in order to determine the flexural strength of RPC. In accordance with ASTM C 78-09, the loading rate was changed from 0.11 to 0.023 MPa/sec.
Flexural Strength Test on Concrete Beam
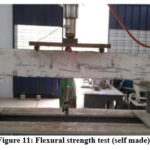 |
Figure 11: Flexural strength test (self made). |
Casting of Beams
Flexural strength tests were performed on specimens measuring 2100 x 150 x 200 mm in accordance with IS: 516-1959.When performing the flexural strength test, two point loading was used on a 400 mm span. If the material were homogenous, the flexural and tensile strengths would be equal.
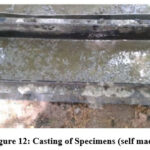 |
Figure 12: Casting of Specimens (self made). |
Modified sorptivity test
By using capillary suction, sorbtivity measures the speed at which water percolates into the pores of mortar or concrete. The preparation of the test specimens was covered in the section before this one. The graph that results from plotting the total volume of water that has permeated per unit surface area of exposure (q) versus the square root of time (t) could be roughly represented as a straight line that passes through the origin.
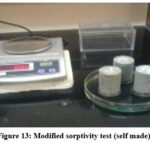 |
Figure 13: Modified sorptivity test (self made). |
Results and discussion
General
This chapter gives the results obtained from various test and a brief discussion on the reason for these values. It also contains the conclusion and further studies to be undertaken.
Results from experiments
Results for waste cloth concrete
Compression Test on Cubes
The average Cube compressive strength for ordinary concrete and waste cloth concrete for different percentages (1% to 5%) in table (3.1).From this table it can be noted that, waste cloth concrete strength is decreases compare with control concrete.
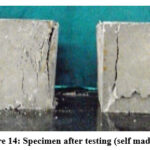 |
Figure 14: Specimen after testing (self made) |
Table 7: The compressive strength of waste cloth concrete cubes at 28 days.
|
S.NO |
Specimens |
Average load(Kn) |
Compressive strength of cubes (Mpa) |
|
1 |
Control |
630.I |
63.01 |
|
2 |
T1 |
442.4 |
44.24 |
|
3 |
T2 |
426.3 |
42.63 |
|
4 |
T3 |
373.5 |
37.35 |
|
5 |
T4 |
334.0 |
33.40 |
|
6 |
T5 |
327.6 |
32.76 |
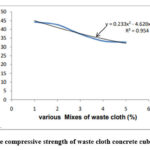 |
Graph 1: The compressive strength of waste cloth concrete cubes at 28 days. |
Cylinder Split tensile strength test
The average cylinder split tensile strength for ordinary concrete and waste cloth concrete for different percentages (1% to 5%) in table (3.2). From this table it can be noted that, waste cloth concrete in cylinder compressive strength is decreases compare with control concrete.
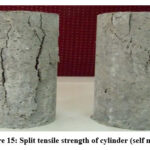 |
Figure 15: Split tensile strength of cylinder (self made) |
Table 8: The compressive strength of waste cloth concrete cylinder at 28 days.
|
S.NO |
Specimens |
Average load(kN) |
Compressive strength of cubes(Mpa) |
|
1 |
Control |
180.0 |
34.08 |
|
2 |
T1 |
140.1 |
26.53 |
|
3 |
T2 |
119.0 |
22.53 |
|
4 |
T3 |
107 |
20.38 |
|
5 |
T4 |
96.2 |
18.22 |
|
6 |
T5 |
78.5 |
14.86 |
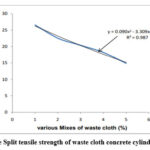 |
Graph 2: The Split tensile strength of waste cloth concrete cylinder at 28 days. |
Split Tensile Test
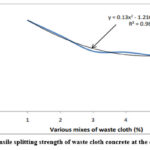
The average Splitting tensile strength for ordinary concrete and waste cloth concrete for different percentages (1% to 5%) in table (3.3). From this table it can be noted that, waste cloth concrete split tensile strength is decreased compared with control concrete. The cohesive property increases in the textile, so the failure is a ductile failure.
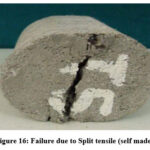 |
Figure 16: Failure due to Split tensile (self made) |
Table 9: Tensile splitting strength of waste cloth concrete at the end of 28 days
|
S.NO |
Specimens |
Average load (kN) |
Split tensile strength of Cylinder (Mpa) |
|
1 |
Control |
63.5 |
2.89 |
|
2 |
T1 |
98.2 |
4.48 |
|
3 |
T2 |
81.7 |
3.73 |
|
4 |
T3 |
64.9 |
2.96 |
|
5 |
T4 |
63.7 |
2.91 |
|
6 |
T5 |
59.3 |
2.71 |
 |
Graph 3: Tensile splitting strength of waste cloth concrete at the end of 28 days |
Design of Rcc Beam for M35 (As Per Is 456-2000)
Width of the beam, b = 150 mm
Overall depth of the beam, D = 200 mm
Length of the beam, L = 2.1 m
Effective depth, d = 200-25-12/2
= 170 mm
Provide 2#12 mm φ and 3# 8mm φ 83
Total Ast = 276.45 mm2
Mu = 0.87 FyAst d ( 1- ?????/????? )
= 0.87 x 500 x 276.45 x 170
( 1- 500 ? 276.45/150 ? 170 ? 30 )
= 16.749 kN-m.
Mu, lim = 0.133 fckbd2
= 0.133 x 30 x 150 x 1702
= 17.297 kN-m
Mu, lim>Mu Hence It is under reinforced section.
Mu = ??/3
17.295 = ??/3
= ?? 1.83/3
= 28.825 kN
Shear Force, V = 28.825 kN
τv = 1.130 N/mm2
τc = 0.690
τv>τc Hence Shear reinforcements are required
τc x b x d = 0.690 x 150 x 170 = 17.595 kN
Vus = Vu- τcbd = 28.825-17.595 = 11.23kN
Vus = Vu- τcbd = 28.825-17.595
= 11.23kN
Sv = (0.87fyAsvd) / Vus Assume 2nos of 6mm dia bar as stirrups.
ASv = 56.54mm2
= 0.87*500*56.54*170/11.23*103
= 372.37 mm 0.75d = 0.75×170
= 127.5 mm
Sv> 0.75d Hence safe.
= 17.297 kN-m
Mu, lim>Mu Hence It is under reinforced section.
Mu = ??/3
17.295 = ??/3
= ?? 1.83/3
= 28.825 kN
= 28.825 kN
τv = 1.130 N/mm2
τc = 0.690
τv>τc Hence Shear reinforcements are required
τc x b x d = 0.690 x 150 x 170
= 17.595 kN
Vus = Vu- τcbd
= 28.825-17.595
= 11.23kN
Vus = Vu- τcbd
= 28.825-17.595
= 11.23kN
Sv = (0.87fyAsvd) / Vus Assume 2nos of 6mm dia bar as stirrups.
ASv = 56.54mm2
= 0.87*500*56.54*170/11.23*103
= 372.37 mm 0.75d = 0.75×170
= 127.5 mm
Sv> 0.75d Hence safe.
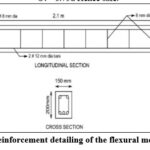 |
Figure 17: The reinforcement detailing of the flexural member (self made) |
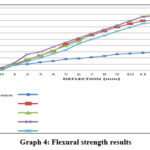 |
Graph 4: Flexural strength results |
Micro-structural properties of paper concrete
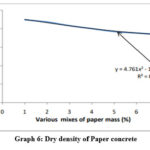
From these tables it can be noted that, Paper concrete is water absorption and deformation drastically increases compared with control concrete. The Paper is weightless material, so the Paper concrete dry density decreases compared with control concrete.
Table 10 micro structural properties of paper concrete
|
Specimens Designation |
% Paper mass |
Deformation (mm) |
Dry Density (Kg/m3) |
Saturated Density |
Water Absorption |
Coefficient of water absorption |
|
C |
– |
1.7 |
23962 |
2460 |
2.67 |
0.98 |
|
P1 |
2.5 |
3.87 |
2240 |
2564 |
14.46 |
1.18 |
|
P2 |
5 |
3.99 |
2180 |
2596 |
19.08 |
1.35 |
|
P3 |
10 |
4.30 |
2080 |
2640 |
26.92 |
1.65 |
|
P4 |
15 |
4.98 |
2000 |
2704 |
35.20 |
2.0 |
|
P5 |
20 |
5.56 |
1920 |
2720 |
41.67 |
2.63 |
|
P6 |
30 |
6.12 |
1880 |
2728 |
45.10 |
2.88 |
|
P7 |
35 |
7.45 |
1840 |
2760 |
50 |
3.83 |
 |
Graph 5: Deformation of Paper concrete |
 |
Graph 6: Dry density of Paper concrete |
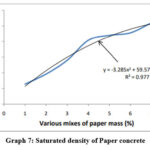 |
Graph 7: Saturated density of Paper concrete |
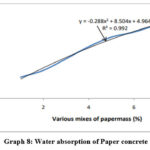 |
Graph 8: Water absorption of Paper concrete |
Coefficient of water absorption
The following table shows the initial weight and the absorbed after 75 min. The difference between these two weights is Q (i.e Q = q75 – q0). The area of the specimens are A = 1590.4mm2
Table 11: Coefficient of water absorption in paper concrete
|
Specimens |
% of Paper mass |
Area of section (mm2) |
Initial Mass (gm) |
Volume of Water Absorbed (ml) |
Coefficient of water absorption |
|
C |
– |
1590.43 |
327.71 |
1.06 |
0.98 |
|
P1 |
2.5 |
1590.43 |
327.31 |
1.16 |
1.18 |
|
P2 |
5 |
1590.43 |
327.33 |
1.24 |
1.35 |
|
P3 |
10 |
1590.43 |
315.23 |
1.37 |
1.65 |
|
P4 |
15 |
1590.43 |
308.29 |
1.51 |
2.00 |
|
P5 |
20 |
1590.43 |
288.47 |
1.73 |
2.63 |
|
P6 |
30 |
1590.43 |
265.85 |
1.81 |
2.88 |
|
P7 |
35 |
1590.43 |
277.39 |
2.09 |
3.83 |
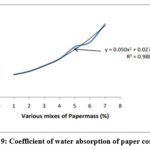 |
Graph 9: Coefficient of water absorption of paper concrete |
Sorptivity Test
The graphical representation compares the Sorptivity of various paper concrete and control concrete. The capillary force increase in 7% of paper concrete compare to others. The paper content increases in this concrete, so water absorption is increased.
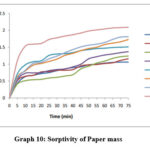 |
Graph 10: Sorptivity of Paper mass |
Conclusion
Papercrete and waste cloth concrete now have higher flexure strengths. Since it can absorb a significant amount of strain and impact energy, it can be used in situations when structural shock is anticipated. Its mechanical strengths—compression and splitting tensile—have decreased.
Light weight substance that can withstand significant deformations before cracking under strain. In seismically active areas, this material could be employed as roofing sheets and building blocks with the appropriate reinforcing. Because it absorbs energy, it is utilised in seismic zones and machine flooring.
When compared to regular concrete, this concrete absorbs a lot more water. Nevertheless, this can be avoided with the right waterproofing techniques. This material can be made to function as a substitute for wood and as a light-weight concrete for partitions, pavement blocks, and other non-structural elements.
This material is low-pollution, environmentally benign, and user-friendly. This concrete made of waste paper and linen shows great potential as a futuristic building material with numerous benefits.
Declaration
Acknowledgement
The author would like to express their gratitude towards Tamilnadu College of Engineering, Coimbatore, Tamilnadu, India. For providing the necessary infrastructure to carry out this work successfully.
Funding Sources
There is no funding Sources.
Conflicts of Interest
No conflict of interest in this manuscript.
Author Contribution
Author SF is involved in data collection, experimental study and manuscript writing. Author LP and MS was involved in conceptualization, guidance and critical review of the manuscript.
References
- Selvaraj .R and Bhuvaneshwari.B, “Waste Papers as Futuristic Building Material In Concrete”, Journal of Structural Engineering Vol. 37, No.01, and April-May 2010 Pp. 43-48.
- João Marciano Laredo dos Reis, “Effect of Textile Waste on the Mechanical Properties of Polymer Concrete”, Materials Research, Vol. 12, No. 1, 63-67, 2009.
CrossRef - Venkatesh Babu D.L., SamratMukhopadhyay & PremKumar. S,“Role of Fabric Structure on Moisture Retention and its Effect on Concrete Strength” Journal of Industrial Textiles, Vol. 36, No. 1—July 2006
CrossRef - AsgharTaramian , Kazem Doosthoseini, Sayyed Ahmad Mirshokraii and Mehdi Faezipour, “Particleboard manufacturing: An innovative way to recycle paper sludge”, Waste Management 27 (2007) 1739–1746.
CrossRef - H. YUN, H. JUNG, C. CHOE. ‘Mechanical Properties of Papercrete containing Waste Paper.’ 18th international conference on composite materials.
- T. Subramani, V. Angappan ‘Experimental Investigation of Papercrete Concrete.’ International journal of application or innovation in engineering and management, vol. 4 issue 5, May 2015. ISSN 2319-4847.
- T. Subramani, G. Shanmugam ‘Experimental Investigation of Using Papercrete and Recycled Aggregate as a Coarse Cggregate.’ International journal of application or innovation in engineering and management, vol. 4 issue 5, May 2015. ISSN 2319-4847.
- Seyyedeh Fatemeh Seyyedalipour, Daryosh Yousefi Kebria, Nima Ranjbar Malidarreh, Ghasem Norouznejad. ‘Study of Utilization of Pulp And Paper Industry Waste in Production of Concrete.’ S. F Seyyedalipour et al International Journal of Engineering Research and Application. ISSN: 2248-9622, Vol. 4, Issue 1 (version 3), January 2014.
- Joo-Hong Chung, Byoung Hoon Kim, Hyun-Ki Choe and Chang Sik Choe. ‘Development Of Papercrete Due To Paper Mixing Ratio’ Dept of Architectural Engineering, Hanyang university, Seoul Korea, 133791.
- Fuller, B, Fafitis, A., Santa Maria, J. ‘Structural Properties of a New Material Made Of Waste Paper.’ Centre for alternative building studies, dept of Civil and Environmental Engg, Arizona State university.
- R. Selvaraj, R. Priyanka, M. Amir Thavarshini, Doct. S. Prabavathi ‘Evaluation of Papercrete: An Innovative Building Material’ Interationla Journal of engineering and advanced research technology.
- Syed Kaiser Bukhari, Maqbool Yousuf, Ayaz Mohmoodar ‘A Study Of Papercrete Towards Building Sustainable and Resilient Infrastructure’ Dept. of civil engineering, Naional Institute of Technology, Srinagar, India.
- IS: 456 – code of practice for plain and reinforced concrete; IS: 383 – specifications for fine & coarse aggregate from natural sources for concrete.
- T.R. Naik, Y. Chun, R.N. Kraus, Concrete containing pulp and paper mill residuals, Report No. CBU-2003-42.1, UWM Center for ByProducts Utilization, Department of Civil Engineering and Mechanics, The University of Wisconsin-Milwaukee; 2003.
- T.R. Naik, Y. Chun, and R.N. Kraus, Paper industry fibrous residuals in concrete and CLSM, Report No. CBU-2005-10, UWM Center for ByProducts Utilization, Department of Civil Engineering and Mechanics, The University of Wisconsin- Milwaukee; November 2005.
- T.R. Naik, Y. Chun, and R.N. Kraus, Use of residual solids from pulp and paper mills for enhancing strength and durability of ready-mixed concrete, final report submitted to the US Dept. of Energy for the Project DE-FC07-00ID13867.
- Portland – Pozzolana Cement Specification. IS 1489(Part 1)-1991, Bureau of Indian Standards, New Delhi.
- Specification for Coarse and Fine Aggregates from Natural Sources for Concrete. IS 383-1970 Bureau of Indian Standards, New Delhi.
- Updegraff D.M. (1969). “Semimicro determination of cellulose in biological materials”. Analytical Biochemistry. 32 (3): 420–424. doi:10.1016/S0003-2697(69)80009-6. PMID 5361396.
CrossRef - Romeo, Tony (2008). Bacterial biofilms. Berlin: Springer. pp. 258–263. ISBN 978-3-540-75418-3.
CrossRef - Klemm, Dieter; Heublein, Brigitte; Fink, Hans-Peter; Bohn, Andreas (2005). “Cellulose: Fascinating Biopolymer and Sustainable Raw Material”. Angew. Chem.Int.Ed. 44 (22): 3358–93. doi:10.1002/anie.200460587. PMID 15861454.
CrossRef - Cellulose. (2008). In Encyclopædia Britannica. Retrieved January 11, 2008, from Encyclopædia Britannica Online.
- Chemical Composition of Wood Archived 2018-10-13 at the Wayback Machine. ipst.gatech.edu.
- https://www.sciencedirect.com/topics/engineering/splitting-tensile-test
Accepted on: 08 Apr 2024
Second Review by: Dr. Shrinidhii Annadka
Final Approval by: Dr. Tejendra Kumar Gupta


![]()
![]()
![]()