Parametric Optimization of Metal Inert Gas Welding for Hot Die Steel by Using Taguchi Approach
Vijander Kumar* and Navneet Goyal
Sant Longowal Institute of Engg. and Technology, Longowal - 148106, Punjab, India.
Corresponding author Email: dvijander@gmail.com
DOI : http://dx.doi.org/10.13005/msri/150112
Download this article as:
![]()
In present experimental study an attempt has been made to investigate the effect of three machine input parameters namely current,voltage and nozzle to plate distance (NPD) on tensile strength of weld bead and weld penetration. Three different levels (current 180, 190, 200 in ampere. Voltage 21, 24, 27 in volt and NPD 12, 16, 20 in mm) have been considered in order to evaluate the effect of these parameters on tensile strength and penetration of weld bead. Taguchi method has been employed to abate the number of experiments and analyze the effect of various parameters. Orthogonal array L9 was used for data optimization. On the basis of experimental data, the mathematical technique has been developed by using analysis of variance. Results were obtained from each parameter at different levels for tensile strength and weld bead geometry. Based on these results different parameters were identified for maximum tensile strength and maximum weld penetration. Result show that maximum tensile strength was 390.8 Mpa at 200 ampere current, 27 volt and 16 mm NPD where as maximum weld penetration was 3.20 mm at 200 ampere current, 24 volt and 12 mm NPD
KEYWORDS:GMAW; HDS Weld Strength; NPD; Taguchi
Introduction
The two similar or dissimilar materials can be joined by various method such as casting, riveting or welding etc. out of all these method welding is much faster and more economical.1 Different welding method are Gas Tungsten Arc Welding, Submerged Arc Welding, Electro Slag Welding, Laser Beam Welding , Electron Beam Welding, Metal Inert Gas Welding etc2,3 are employed based upon the requirements.In Metal inert Gas Welding process heat is supplied with the help of arc and consumable electrode to the work piece and shielded by inert gas such as argon, helium etc.
Metal Inert Gas(MIG) welding is also known as Metal
Active Gas (MAG) and as Gas Metal Arc Welding (GMAW) in USA.4 MIG is a welding process which is
mainly used for welding of ferrous and non-ferrous materials.5 The molten weld pool and the arc both are shielded from the atmosphere by a gas stream in Gas shielded arc welding. Initially GMAW was applicable to deoxidized copper, aluminum and silicon bronze.6 But later on it was also used to weld austenitic steels, ferrite and mild steel7 by using active gasses instead of inert gasses and that’s why it was termed as Metal Active Gas (MAG) welding.8 The main aim of every manufacturer is to control the input process parameters to obtained a excellent weld joint with required weld quality9
Metal Transfer Mechanism in GMAW
Metal transfer from the electrode tip to the weld pool across the arc in GMAW process is either by short-circuiting type globular, spray type or it depends upon below mentioned factors:
Figure 1: Diagram explanation of GMAW Process [10]
![Figure. 1: Diagram explanation of GMAW Process [10]](https://www.materialsciencejournal.org/wp-content/uploads/2018/03/Vol15_No1_Par_VIJ_Fig1-150x150.jpg) Click on image to enlarge |
- Welding current magnitude
- Electrode chemistry
- Electrode extension
- Current density
- Shielding Gas
There is considerable spatter with CO2 shielding11 whatever the value of welding current, current density and other factors may be. As the current increases,drops become smaller in size and directed axially and non-axially. Metal droplets move along a line in axial transfer where as in non-axial transfer droplets does not move along a line and move in other directions. Non-axial transfer occurs due to the electromagnetic repulsive force which is acting on the bottom of molten drop. Electric current which is flowing through the electrode increases many electromagnetic forces which affects the motel tip including anode reaction force (R) and pinch force (P). Pinch force increases with increase in current12 and electrode diameter leads to drop to detach. The electrode tip is not heated directly by the arc plasma rather it is heated by the arc heat which is conducted through the molten drop. Molten drop increases in size and then detaches by short circuiting, after overcoming the force R, that tends to support the drop13.
Materials and Methods
Copper coated mild steel wire was used as a electrode and hot die steel (HDS) was used as a material for the experiment Chemical composition of HDS is shown in Table 1.
When there is hike in the number of the process parameters then there are so many experiments to be performed usually if classical parameter design has to be adopted [14]. To solve this matter, Taguchi introduced a unique design of extraneous arrays to study the whole parameter space with few experiments only. Taguchi suggests the usage of the loss function to evaluate the performance features deviating from the desired result.15 Value of loss function is then translated into signal-to-noise ratio. Experimental layout for parameters used in Taguchi L9 orthogonal arrays is shown in Table 2. The aim of these parameters design is to take the innovation which has been proven to work in system design and enhance it so that it will consistently function as intended
Table No 1: Material Composition of HDS
|
Element |
C |
Si |
Mo |
V |
S |
Cr |
P |
Mn |
|
% weight |
0.32-0.45 |
0.80-1.20 |
1.10-1.75 |
0.80-1.2 |
0.30 Max |
4.75-5.50 |
0.30 Max |
0.25-0.50 |
Table No 2: Experimental layout for parameters used in Taguchi L9 ortohogonal array [16]
|
Specimen No: |
Variable 1
|
Variable 2
|
Variable 3 |
|
1. |
1 |
1 |
1 |
|
2. |
1 |
2 |
2 |
|
3. |
1 |
3 |
3 |
|
4. |
2 |
1 |
2 |
|
5. |
2 |
2 |
3 |
|
6. |
2 |
3 |
1 |
|
7. |
3 |
1 |
3 |
|
8. |
3 |
2 |
1 |
|
9. |
3 |
3 |
2 |
Trail runs are performed to find the suitable factors along with their levels for welding of the specimen. The process parameter parameters like welding current, voltage and nozzle plate distance(NPD) shows more effect on the weld strength. In the same way, factor levels were assessed with the trail runs and then reviewing the geometry of weld bead. From trail finally various parameters and their ranges selected are shown in Table 3:
Table 3 : Varius welding parameter with their levels
|
Variable |
Level 1 |
Level 2 |
Level 3 |
|
Current (Ampere) |
180 |
190 |
200 |
|
Voltage (Volt) |
21 |
24 |
27 |
|
NPD (mm) |
12 |
16 |
20 |
Experimentation
A sample of 200 mm x 100 mm x 5 mm were taken from the plate which were further polished with 400 grit emery paper to clean surface impurities and then rinsed with the help of acetone. Each experiment was repeated for three times so total 27 numbers of experiments were conducted and then average of three is taken for each level. The finally orthogonal ray with parameters and levels is mentioned in Table 4
Table 4 : Orthogonal ray with parameters and levels
|
Experiment NO: |
CURRENT (Ampere) |
VOLTAGE (Volt) |
NPD (mm) |
|
1 |
180 |
21 |
12 |
|
2 |
180 |
24 |
16 |
|
3 |
180 |
27 |
20 |
|
4 |
190 |
21 |
16 |
|
5 |
190 |
24 |
20 |
|
6 |
190 |
27 |
12 |
|
7 |
200 |
21 |
20 |
|
8 |
200 |
24 |
12 |
|
9 |
200 |
27 |
16 |
After the completion of welding process, samples were prepared for weld area and tensile strength. The cross-sections of the welded line were prepared using metallographic procedures including polishing, sectioning and etching. First of all sectioning was done in which samples having dimensions 30 x 20mm were prepared from welded pieces to calculate weld bead area. Sectioning was followed by polishing with the help of emery papers of grade 160, 220, 320, 400, 600, 800, 1000 and 1200. These papers were used in ascending order on every sample. After the use of abradant paper, Alumina Powder ,velvet Cloth and diamond paste was applied to obtained the reflecting surface. Now samples are ready for etching process. Etching helps in highlighting the weld bead and also helps in identifying microstructure features. To detect the weld bead border, etching should be done with a proper solution that acts on the metal in a way which made the specific features stand out.
For etching process, a mixture of Hydrochloric acid(HCL) and nitric acid (HNO3) was used in equal ratio of 10 ml. After that samples were dipped into the mixture for 2 minutes as a result exothermic reaction takes place in the mixture which reveales the weld bead of the sample under consideration after that the sample was washed with running water and then dried with the help of blower.
Table 5: Specimen result for tensile strength
|
Specimen No |
Current (ampere) |
Voltage (volt) |
NPD (mm) |
Tensile Strength (Mpa) |
|
1 |
180 |
21 |
12 |
284.6 |
|
2 |
180 |
24 |
16 |
300.4 |
|
3 |
180 |
27 |
20 |
302.8 |
|
4 |
190 |
21 |
16 |
298.4 |
|
5 |
190 |
24 |
20 |
328.7 |
|
6 |
190 |
27 |
12 |
340.6 |
|
7 |
200 |
21 |
20 |
333.2 |
|
8 |
200 |
24 |
12 |
360.4 |
|
9 |
200 |
27 |
16 |
390.8 |
After the complete etching of the sample, weld bead will be clearly visible. For tensile testing workpiece is cut into the 150x30x5 mm. Mark a gauge length of 100 mm on test sample with the help of dial calipers and permanent marker. Check the diameter of sample with the help of dial calipers now put the specimen in the grip of UTM and remove the slack by moving its lower crosshead and nil the extensometer and secure it with lanyard to keep it on place. If fracture come in specimen then extensometer can be removed. Unload the indicator and open the right side hydraulic valve about half turn
Results and Discussion
Samples For tensile strength and weld area has been analysis separately.
UTM test results
After conducting the experiments for each specimen results for tensile strength have been compiled in Table 5
The performance characteristics can be categoried in three categorises for the analysis of the S/N ratio, which are
- Smaller is better
- Nominal is better
- Larger is better
In smaller-the-better characteristics main objective is to reduce the measured characteristics to zero. That is it is used for instance to the porosity, vibration, the consumption of an automobile, tool wear, surface roughness, response time to customer complaints, noise generated from machine or engines, percent shrinkage, percent impurity in chemicals, and product deterioration. Whereas The nominal-the-better characteristics is one where a desire value is specified and the objective is to minimal variability around the desire value. This type of characteristics is generally considered for measuring dimensions such as diameter, length, thickness, width etc. Other examples include pressure, area, volume, current, voltage, resistance, and viscosity. Other hand The larger-the-better is one in which the ideal value is infinity. This type characteristics used for tensile strength, pull strength, car mileage per gallon of the, reliability of a device, efficiency of engines, life of components, corrosion resistance etc. Hence the larger the better is adopted for tensile strength .
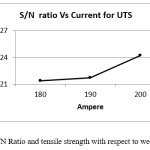
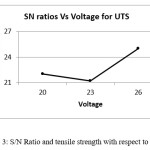
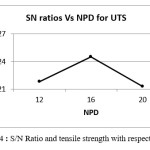
The variation of the S/N ratio and tensile strength with respect to welding current, voltage and NPD is shown by graphically in figure 2, figure 3 and figure 4 respectively
Figure 2: S/N Ratio and tensile strength with respect to welding Current
 Click on image to enlarge |
Figure 3: S/N Ratio and tensile strength with respect to Voltage
 Click on image to enlarge |
Figure 4 : S/N Ratio and tensile strength with respect to NPD
 Click on image to enlarge |
When larger is better method used then a larger S/N value is considered to a better performance. Hence the optimal level of the tensile test is the value which have the highest S/N value. Based on the analysis of the S/N ratio the maximum tensile strength is occur for current of 200 (level 3), welding voltage of 24 (level 2) and NPD of 16mm (level 2)
Weld Bead Depth of Penetration Results
After proper etching of the of the specimen, the weld bead will be visible and then getting dried by air blower. Now all the specimen were scanned with the help of scanner. These scanned images were measured for depth of penetration with the help of Adobe Acrobat Professional 11 software. These dimensions of response are analyzed in design expert 7.0.0 software.
All experimental results for each specimen for weld bead penetration have been compiled in Table 6
Table 6: Specimen result for Weld Bead penetration
|
Specimen No |
Current (ampere) |
Voltage (volt) |
NPD (mm) |
Weld Penetration (mm) |
|
1 |
180 |
21 |
12 |
2.32 |
|
2 |
180 |
24 |
16 |
2.08 |
|
3 |
180 |
27 |
20 |
2.20 |
|
4 |
190 |
21 |
16 |
2.80 |
|
5 |
190 |
24 |
20 |
2.60 |
|
6 |
190 |
27 |
12 |
3.02 |
|
7 |
200 |
21 |
20 |
2.98 |
|
8 |
200 |
24 |
12 |
3.20 |
|
9 |
200 |
27 |
16 |
3.08 |
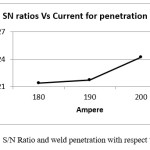
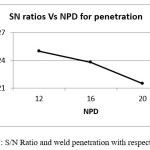
The variation of the S/N ratio and tensile strength w.r.t. to current, voltage and travel NPD is shown graphically
Figure 5: S/N Ratio and weld penetration with respect to Current
 Click on image to enlarge |
Figure: 6 S/N Ratio and weld penetration with respect to Voltage
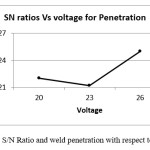 Click on image to enlarge |
Figure 7: S/N Ratio and weld penetration with respect to NPD
 Click on image to enlarge |
When larger is better method used then a larger S/N value is considered to a better performance. Hence the optimal level of the tensile test is the value which have the highest S/N value. Based on the analysis of the S/N ratio the maximum weld penetration is occur for current of 200 ampere, welding voltage of 24 volt and NPD of 12mm.
Conclusion
The welding current and NPD were the most effective parameters. From the tensile test of the samples, it was observed that ultimate tensile strength is satisfactory for many of the joints made at different levels of current, NPD , and voltage. For hot die steel optimal parametres such as current is two hundered ampere , voltage twenty seven volt and NPD is sixteen mm. It was also conclude that tensile strength increased with penetration
Acknowledgement
While bringing out this research paper to its final form, I came across a number of people whose contributions in various ways helped my field of research and they deserve special thanks. It is a pleasure to convey my gratitude to all of them. I express my sincere thanks to my wife Minakshi Dhull for providing useful support to complete this research paper
Funding Source
The author declares that the funding is done by author only.
Conflict of interest
The author(s) declare(s) that there is no conflict of interests regarding the publication of this article.
References
- Hooda A.,Dhingra A., Sharma S. Optimization of MIG Welding Process Parameters to Predict Maximum Yield strength in AISI 1040. International Journal of mechanical engineering and robotics research. 2012;1:203-213.
- Kumar R. D., Elangovan S., Shanmugam N. S. Parametric Optimisation Of Pulsed – Tig Welding Process In Butt Joining Of 304 Austenitic Stainless Steel Sheets IJRET. International Journal of Research in Engineering and Technology. 2014. eISSN: 2319-1163| pISSN:2321-7308.
- Shyu S. W., Huang H. Y., Tseng K. H and Chou C. P. Study of the Perfor-mance of Stainless Steel A-TIG Welds. JMEPEG. 2008;17:193–201. DOI: 10.1007/s11665-007-9139-7.
CrossRef - Abbasi K., Alam S and Khan Dr. M. I. An Experimental Study on the Effect of MIG Welding parameters on the Weld-Bead Shape Characteristics IRACST – Engineering Science and Technology. An International Journal (ESTIJ). 2012;2(4):2250-3498.
- Reis R. P., Scotti A., Norrish J & Cuiuri D. Investigation on welding arc interruptions in the presence of magnetic fields: Arc length, torch an-gle and current pulsing frequency influence. IEEE Transactions on Plasma Sci-ence. 2012;41(1):133-139.
CrossRef - Patil S. R. C. A. Waghmare Optimization of MIG Welding Parameters for Improving Strength of Welded Joints. International Journal of Advanced Engineering Research and Studies. 2013;2249–8974.
- Utkarsh S.,Neel P.,Mayank T M., Jignesh R. P., Prajapati B. Experimental Investigation of MIG Welding for ST-37 Using Design of Experiment. International Journal of Scientific and Research Publications. 2014 4(5):2250-3153.
- Raman R. M., Kumar V. T and Rajesha. A study of tensile strength of MIG and TIG welded dissimilar joints of mild steel and stainless steel. International Journal of Advances in Materials Science and Engineering (IJAMSE). 2014;3(2).
- Mukesh., Sharma S. Effect of Parameters on Weld Pool Geometry in 202 Stainless Steel Welded Joint Using Tungsten Inert Gas (TIG) Process International Journal of Science and Modern Engineering (IJISME). 2013;1(12).
- Satyaduttsinh P. C., Jayesh V. D., Tushar M. Patel A Review on Optimization of MIG Welding Parameters using Taguchi’s DOE Method. International Journal of Engineering and Management Research. 2014;4(1):2250-0758.
- Shukor M. S., irman M. r., Hafiz S. Y. Study On Mechanical properties and microstructure analysis of AISI 304l Stainless Steel Weldments. 2011;3(2):ISSN: 2180-1053.
- Mahdi E., Eltai E. O., Rauf A. The Impact of Metal Inert Gas Welding on the Corrosion and Mechanical behavior of AA 6061 T6. International Journal of Electrochemical Science. 2014;9:1087–1101.
- Abbasi K., Alam S and Khan Dr. M. I. An Experimental Study on the Effect of MIG Welding parameters on the Weld-Bead Shape Characteristics”,IRACST – Engineering Science and Technology. An International Journal. 2012;2(4).
- Akash B. P., Prof. Satyam P. P. The effect of activating fluxes in TIG weld-ing by using Anova for SS 321. 2014;4(5):5. ISSN : 2248-9622.
- Gopal R and Jadoun R. S. A Review on Effects of GMAW and GTAW Mechanical Properties on Weld Zone of Aluminium Alloy by Taguchi Design of Experiment Technique. International Journal For Research In Emerging Science And Technology. 2017;4(8).
- Ranjit K. R. A text book on A Primer on the Taguchi Method published by Society of Manufacturing Engineers. 2010.
Accepted on: 14 March 18


![]()
![]()
![]()