Structural, Optical and Electrochromic Investigations on Nano Crystalline Moo3 Thin Films
P. V. Kala1
and K. Srinivasarao*3 1Department of Basic Sciences and Humanities, Vignan’s Lara Institute of Technology and Science, Vadlamudi – 522 213.
2Department of Sciences and Humanities, QIS College of Engineering and Technology, Ongole, Andhra Pradesh - 523272, India
3Department of Applied Sciences and Humanities, Sasi Institute of Technology and Engineering, Tadepalligudem – 534 101, Andhra Pradesh, India
Corresponding author Email: kotarisrinu@yahoo.co.in
DOI : http://dx.doi.org/10.13005/msri/150105
Download this article as:
![]()
Thin films of MoO3 were deposited on quartz glass, Silicon (100) and Indium Tin Oxide (ITO) substrates by dc magnetron sputtering at two substrate temperatures of 300 K and 600 K and at sputtering pressures of 5 Pa and 10 Pa and at a fixed sputtering power of 50 W. The deposited films were characterized by Grazing Incidence X-ray Diffraction (GIXRD), Raman and Optical Transmittance Spectra and Cyclic Voltametry (CV) studies. The GIXRD reveales that the crystallanity of films starts at low temperature (300 K) and crystallizes in orthorhombic phase. The crystallanity increases with increase of substrate temperature. The Raman spectral studies reveals strong shift in the emission peak position for films deposited at 5 Pa and 300 K, and there is no significant peaks in case of films deposited at 10 Pa and 600 K. The optical transmittance of the films is 78 % for films deposited at 5 Pa and 300 K and is maximum (95 %) when deposited at 600 K. The transmittance is decreasing to 90 % with increase in sputtering pressure. The absorption edge is shifting towards lower wavelength with increase in substrate temperature due to increase in the reactivity of the ionic species (molybdenum ions and oxygen ions) and shifting towards higher wavelengths with sputtering pressures due to the scattering of atomic species which decreases the reactivity between ionic species. The average diffusion coefficient (D) of the films deposited at 5 Pa and 300 K is 7x10-14 cm2/sec and decreasing with increase in substrate temperature of the deposited films. With further increase in the sputtering pressure to 10 Pa and at low temperatures a large increment in the D value was observed (8.2x10⁻¹² cm2/sec) due to the enhancement in the mobility of the Li+ ions through the internal and intra grain boundaries due to low grain size of MoO3 (8 nm) of the film. The measured thickness of the films by Taly stip profilometer is 3000 Å.
KEYWORDS:Cyclic Voltametry (CV); Electrochromism;Metal oxides; Photochromism; Sputtering pressure
Introduction
Transition metal oxides are an important class of solids with n-type conductivity and find many applications in thin film form.1,5 Among transition metal oxides MoO3 exhibits an improvement in its various physical and chemical property as a nano material.6,10 Among various physical properties exhibited by MoO3 electrochromism and photochromism is an interesting physical property which find many applications in making display devices and smart windows.9,12 Recent studies also proved that MoO3 is potential as an ion conducting layer in fabrication of solar cells,13 and as recombination barrier layers in dye sensitized solar cells.14 Electrochromism is a phenomenon exhibited by a material in the form of changing colour when the electric voltage is applied to it. In case of MoO3 this is observed due to the reduction of Mo6+ to Mo5+ by application of electric field. The same MoO3 as thin film and especially as nanocrystalline exhibit an improvement in electrochromic behaviour, like enhancement in ionic conductivity, coloration efficiency, optical density, fast response etc.15 Nano crystalline MoO3 thin films which were deposited at two different substrate temperatures and sputtering pressures and studied for their structural, optical and electrochromic performance in the present investigation.
Materials and Methods
Dc magnetron sputtering was used to deposit thin films of MoO3 in a vacuum coating unit supplied by VR Technologies, Bangaluru, India. A high purity Mo target of thickness 3 mm was used to prepare thin films at various sputtering pressures and temperatures. The Ar and oxygen flow was controlled by needle valve. The sputtering power to deposit thin films were kept at 50 W. The XRD was recorded for the films deposited on Si (100) substrates at a glancing angle of 0.5o to determine their structure by using Panalytical X ray diffractometer. Raman spectra were recorded for the films deposited on Si (100) substrates in the wave number region of 50 to 1000 cm-1 by using FT-Raman spectrometer (BRUKER RFS 27) with He-Ne laser of excitation wavelength 6328 Å, power 9 mW and focusing area of 2 µm. The optical transmittance spectra of the films deposited on quartz glass substrates is recorded in the wavelength range 300 – 1100 nm using UV-VIS spectrophotometer. The thickness of the films is 3000 Å which is measured by stylus profilometer (Veeco DEKTAK 150). The cyclic voltammetric studies were performed with scan rate of 10 mV / sec for the films deposited on ITO substrates.
Results and Discussion
XRD studies
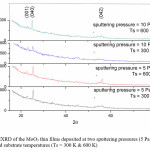
The XRD of the films was studied to understand the crystallization of the MoO3 thin films. Fig.1 shows the XRD of the films deposited at two sputtering pressures of 5 Pa and 10 Pa, and two substrate temperatures of 300 K and 600 K. It is observed that the 2Ɵ values of the films deposited at 5 Pa and at 300 K is 22.78o and 25.53o. The peak at 22.78o indicates the growth of weak hexagonal phase and at 25.53o indicates the growth of strong orthorhombic phase.16 The crystallographic orientations are (001) and (040). The intensity of these crystallographic peaks become strong when films deposited at 600 K due to the improvement in the crystallinity. Growth of low intensity (042) crystallographic phases of orthorhombic structure is also observed in case of films deposited at this temperature.
With increasing sputtering pressure to 10 Pa, and at 300 K the films again crystallizes in orthorhombic phase with predominant (040) orientation. The intensity of this orientation is increases when the films are deposited at a substrate temperature of 600 K.
For all the films the 2Ɵ of the maximum of the crystallographic peak is shifting towards lower values. The shift is more in case of films deposited at higher sputtering pressures and is due to increase in inter planar spacing (d). The ‘d’ values are calculated from the Bragg’s expression,
nλ = 2dsinϴ ——→ (1)
where n is order of the spectrum,
λ is wavelength of X-rays,
d is inter planar spacing,
ϴ is angle of diffraction.
Laser Raman spectral studies
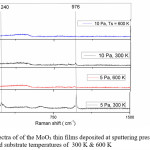
The Raman spectrum was used to analyze the modes of vibrations of MoO3 thin films. Fig 2 shows the Raman spectrum of the MoO3 thin films deposited at 5 Pa, 10 Pa and at 300 K and 600 K. The characteristic Raman bands of the MoO3 thin films were observed between 82 and 995 cm—1. The MoO3 must be considered as a layered materials in which single layers are built up from two half layers of moderately coupled chains of MoO4 tetrahedra running along the c- axis.17 In the present investigation the Raman bands were observed at 241 cm-1 which is due to the wagging mode O=Mo=O of hexagonal phase6 and 974 cm-1 is due to the stretching Mo6+ = O [18] in case of films deposited at 5 Pa and 300 K. The band at 974 cm-1 is a characteristic of layered structure of α-MoO3.19 It is also observed that a shift in band position when compared to the standard values is due to the decrease in the frequency of the vibrations of corresponding modes which is due to the formation of nano crystallites.20 The wagging mode which is observed at 241 cm-1 is not observed for films deposited at high temperatures and sputtering pressures. This may be due to the increase in the inter planar spacing.
With increasing sputtering pressure to 10 Pa and deposited at 300 K a single band is observed at 974 cm-1, which is a shift of 20 cm-1 when compared to the reported value. The observed band is due to the stretching of Mo6+ = O. Further increasing substrate temperature to 600 K the spectrum is broad without any featured Raman bands. In general the Raman spectrum does not show any bands, if films were amorphous and a broad spectrum can be observed, if crystallites breaks into smaller crystallites. But the results in the present investigation indicates the films were not amorphous (from XRD) and the observed results may be due to increase in the BET (Brunauer-Emmett-Teller) surface area of the nano crystallites.21
Optical studies
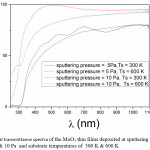
The optical transmittance spectra of the films was studied to understand the optical quality and type of electron transition in the films. In the present investigation the optical transmittance of the films deposited at 5 Pa, 10 Pa and 300 K, 600K is shown in Fig. 3. The film transmittance when deposited at 5 Pa and 300 K is 81 % and increasing with increase in substrate temperatures. The absorption edge is shifts towards lower wavelengths with increasing substrate temperature and shifting towards higher wavelength with sputtering pressure. The reason for increase in transmittance of films deposited at higher temperature is due to high reactivity between Mo and oxygen leading to stoichiometric film. More over these stochiometric films also shows the shift in absorption edge towards lower wave length due to band gap widening which further results in increment in the energy gap.15,22,23
The films optical energy gap is obtained from the following relation,24
αhv = B(hv-Eg)n, ————– (1)
where B is constant, Eg the optical band gap of the material and n is an exponent, which determines the type of electronic transition.
if, n = ½, transition is direct allowed,
n = 3/2, transition is direct forbidden
n = 2, transition indirect allowed
n = 3, indirect forbidden transition
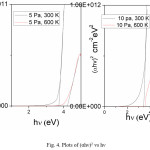
Fig. 4 shows the plots of (αhv)2 versus hv. The optical energy gap of the films is 3.7 eV and is increasing to 3.87 eV with increase in substrate temperature.
The transmittance is decreasing with increase in sputtering pressure to 10 Pa. At the same pressure with increasing substrate temperature the transmittance is increasing due to enhancement in the reactivity between the atomic species which are depositing as film. A small shift in absorption edge was observed with increasing substrate temperature. But this shift is not much large when compared to the films deposited at lower sputtering pressures of 5 Pa. Because at higher pressure, even the temperature is high due to small mean free path, the reacting ionic species will scatter out leading to the substoichiometric film.25 The estimated energy gap of the films is 3.7 eV and is increasing with increase in substrate temperature.
Electrochromic studies
The linear sweep cyclic voltametry (CV) studies were performed on the sample to find the reduction potentials and diffusion coefficient of lithium ion in MoO3 films. The CV studies of the films were performed in a three electrode cell. Platinum is used as a counter electrode, Hg / Hg2Cl2 used as a reference (SCE) and MoO3 films deposited on Indium Tin Oxide (ITO) coated substrates is used as working electrode.
The coloration and virgin states were observed due to reduction of Mo6+ to Mo5+ and oxidation of Mo5+ to Mo6+ by de-insertion of Li+ ions from the MoO3 films.
The reduction at working electrode can be written as
MoO3 + xLi+ + xe– —-→ LixMoO3
In the present investigation CV measurements were performed on the films deposited at two substrate temperatures of 300 K & 600 K and sputtering pressure of 5 and 10 Pa.
CV measurements were performed on samples in a glove bag (100 litres capacity) in Argon inert atmosphere, for 1 M LiClO4 / Propylene Carbonate (PC) solution.
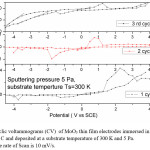
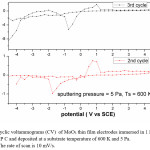
The cyclic voltagrams of films deposited at 5 Pa and at 300 K and 600 K were shown in Fig. 5 & Fig. 6. The diffusion coefficient (D) of Li+ ions in the films is calculated from the Randall – Sevick equation,
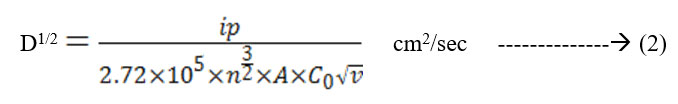
Where,
ip = current in amps
n = number of electrons transferred in the redox event
A = area of electrode in cm2
C0 = concentration in mole /cm3
ν = scan rate in volt / sec
T = temperature in K
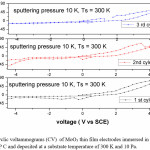
The average diffusion coefficient (D) of the films deposited at 5 Pa and 300 K is 7×10-14 cm2/sec and decreasing with increase in substrate temperature of the deposited films. This may be due to the improvement in polycrystallinity of the films. With further increase in the sputtering pressure to 10 Pa and at low temperatures a large enhancement in the D value was observed (8.2×10⁻¹² cm2/sec) due to the enhancement in the mobility of the Li+ ions through the internal and intra grain boundaries26 due to low grain size of MoO3 (8 nm) of the film.
Figure 1: GIXRD of the MoO3 thin films deposited at two sputtering pressures (5 Pa & 10 Pa) and substrate temperatures (Ts = 300 K & 600 K)
 Click on image to enlarge |
Figure 2: Rama spectra of of the MoO3 thin films deposited at sputtering pressures of 5 Pa and 10 Pa and substrate temperatures of 300 K & 600 K
 Click on image to enlarge |
Figure 3: Optical transmittance spectra of the MoO3 thin films deposited at sputtering pressures of 5 Pa and 10 Pa and substrate temperatures of 300 K & 600 K
 Click on image to enlarge |
Figure 4: Plots of (αhν)2 vs hν
 Click on image to enlarge |
Figure 5: cyclic voltammograms (CV) of MoO3 thin film electrodes immersed in 1 M LiClO4 / P C and deposited at a substrate temperature of 300 K and 5 Pa. The rate of Scan is 10 mV/s
 Click on image to enlarge |
Figure 6: Cyclic voltammograms (CV) of MoO3 thin film electrodes immersed in 1 M LiClO4 / P C and deposited at a substrate temperature of 600 K and 5 Pa. The rate of scan is 10 mV/s
 Click on image to enlarge |
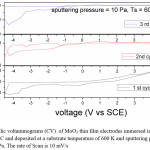
Figure 7: Cyclic voltammograms (CV) of MoO3 thin film electrodes immersed in 1 M LiClO4 / P C and deposited at a substrate temperature of 300 K and 10 Pa. The Scan rate is 10 mV/s
 Click on image to enlarge |
The reduction potential of the films deposited at 5 Pa, 300 K is -1.25 V, and shifting towards lower potentials in case of films deposited at higher deposition temperatures. The reduction potentials were further decreasing in case of films deposited at higher sputtering pressures.
These results indicate that the crystallinity and diffusion coefficient affects the oxidation and reduction potentials. In case of films deposited at high pressures and low temperatures the grain size (L) is 8 nm, which is calculated from Sherrer’s formula,
Grain size (L) = kλ/βcosθ → (3)
where k = 1
λ = wavelength of X-ray used,
β = full widhth of the crystallagraphci peak at half maximum
θ = angle of diffraction
It is observed that, if the diffusion coefficient of the films is high, enhances the mobility of Li+ ions to reach maximum number of MoO3 molecules causing low reduction potentials. 27,28
Summary and Conclusion
Thin film of Nano crystalline MoO3 were deposited by d.c. magnetron sputtering and studied for their structure, optical and electrochromic properties. The films crystallize in orthorhombic phase with predominant (040) orientation. The crystallinity of the films is strong when deposited at high temperatures and low pressures. The nano crystallites of size 8 nm were obtained at high sputtering pressues of 10 Pa and low temperatures of 300K. The optical properties reveals that the transmittance of the films is high when deposited at high temperatures and low pressures due to the high reactivity of the ionic species. The cyclic voltammetric studies reveal that the lower crystallites sizes will enchances the diffusion coefficient of lithium ions in MoO3 thin films. The study reveales that the nano crystalline MoO3 films of lowest crystallite shows improved electrochromic performance.
Figure 8: Cyclic voltammograms (CV) of MoO3 thin film electrodes immersed in 1 M LiClO4/ P C and deposited at a substrate temperature of 600 K and sputtering pressure of 10 Pa. The rate of Scan is 10 mV/s
 Click on image to enlarge |
Acknowledgements
The authors are thankful to S. N. Bose National Centre for Basic Sciences, Kolkata, India for extending GIXRD facility, the authors also thankful to IIT Guwahathi, Guwahathi, India for Raman Measurements, and Dr. B. Tirumala Rao, Scientist – F, RRCAT, Indore, India for extending optical measurements facility. The authors are extending their acknowledgment to the authorities of VFSTR deemed to be University, Vadlamudi, India for allow to prepare thin films.
Funding Source
The author declares that the funding is done by author only.
Conflict of interest
The author(s) declare(s) that there is no conflict of interests regarding the publication of this article.
References
- Sunu S. S., Prabhu E., Jayaraman V., Gnanasekhar K. I., Seshagiri T. K and
- Gnanasekharan T. Sensors and Actuators B Chemical. 2004;101:161.
- Julien C., Yebka B., Guesdon J. P. Ionics. 1995;1:316.
CrossRef - Sunkara M. K., Pendyala C., Cummins D., Meduri P., Jasinski J., Kumar V., H. B.
- Russell E. L. C and Kim J. H. J. Phys. D: Appl. Phys. 2011;44:174032.
- Ayari F., Mannei E., Nieto E. A., Mhamdi M., Ruiz, G. Delahay A. R. G., Ghorbel A.
- Reaction Kinetics. Mechanisms and Catalysis. doi.org/10.1007/s11144-018-1357-5.
- Xiang Q., Zhang D. Journal of Materials Science Materials in Electronics. 2017;28:7449.
- Atuchin V. V., Gavrilova T. A., Kostrovsky V. G., Pokrovsky L. D and Troitskaia I. B. Inorganic materials. 2008;44:622.
CrossRef - Hassan M. F., Guoa Z. P., Chenb Z and Liu H. K. J. Power Sources. 2010;195:2372.
CrossRef - Li W., Cheng F., Tao Z and Chen J. J. Phys. Chem. B. 2006;110:119.
- Lampert C. M., Granqvist C. G (Eds.). Large-area chromogenics Materials and Devices for Transmittance Control, SPIE Optical Engineering Press, Bellingham, WA. 1990
- Scarminio J.,Lourenco A and Gorenstein A. Thin Solid Films. 1997;302:66.
CrossRef - Tajima K., Hotta H., Yamada Y., Okada M & Yoshimura K. Appl. Phys. Lett. 2012;100:3691256.
- Lin S. Y., Wang C. M., Kao K. S., Chen Y. C and Liu C. C. J. Sol–Gel. Sci. Technol. 2010;53:51.
- Ali F.,Khoshsirat N., Duffin J. L., Wang H., Ostrikov K. Journal of Applied Physics. 2017;122:123105.
CrossRef - Ashok A., Vijayaraghavan S. N., Nair S. V., Shanmugam M. RSC Advances. 2017;7:48853.
CrossRef - Madhavi V., Kondaiah P., Subba S. R., Hussain O. M and Uthanna S. Materials express. 2013;135:2158.
- McCarron E., Calabrese J. J. Solid State Chem. 1991;91:121.
CrossRef - Kihlborg L., Kemi A. 1963;21:357.
- Haro-Poniatowski E., Jouanne M., Morhange J. F., Julien C., Diamant R., Fernandez-Guasti M., Fuentes G. A., Alonso J. C. Applied Surface Science. 1998;127–129:674.
- Julien C., Khelfa A.,Hussain O. M., Nazri G. A. Journal of Crystal growth. 1995;156:235.
CrossRef - Kurumada M & Ch. K. Journal of Physical Society of Japan. 2006;75:074712.
- Mest G., Srinivasa T. K. K., Knozinger H. Langmuir. 1995;11:3795.
- Lee Y. J., Nichols W. T., Kim D. G and Kim Y. D. J. Phys. D: Appl. Phys. 2009;42:115419.
- Al-Kuhaili M. F., Durrani S. M. A.,Bakhtiari I. A. Appl. Phys. A Mater. Process. 2010;98:609.
- Tauc J. Materials Research Bulletin. 1968;3:37.
- Hussain O. M.,Rao K. S., Madhuri K. V., Ramana C. V., Naidu B. S., Pai S. J. John And Pinto R. Applied Physics – A: Materials Science & Processing. 2002;75:417.
CrossRef - Loo B. H., Yao J. N., Dwain H. C., Hashimoto K., Fujishima A. Applied Surface Science. 1994;81:175.
CrossRef - McEvoy T. M and Stevenson K. J., Joseph T. Hupp, Xiaojun Dang Langmuir. 2003;19:4316.
CrossRef - Hasani A., Van Q. L., Nguyen T. P., Choi K. S., Sohn W., Kim J. K., Jang H. W and Kim S. Y. Scientific Reports. 2017;7:13258.
CrossRef
Accepted on: 20 March 18


![]()
![]()
![]()