Spray Pyrolysis Technique for the Deposition of Lead Oxide (PbO) Thin Films; its Electrochemical Behaviour and Structural and Optical Properties
Anil B Gite* G. E. Patil and G. H. Jain
SNJB’s Department of Physics, Arts Commerce and Science College Chandwad Nashik, Maharashtra, India
Corresponding author Email: gite.anil@gmail.com
DOI : http://dx.doi.org/10.13005/msri/150204
Download this article as:
![]()
Thin film of Lead oxide (PbO) was prepared by spray pyrolysis technique on glass substrate at 250°C. The cyclic voltammetry measurement was carried out to study the oxidation reduction reactions of non-aqueous lead ions at various molar concentrations which is from 0.01M to 0.09M. Elecrochemical studies were carried out with Ag/AgCl as a reference electrode , Pt as working electrode while platinum mesh as counter electrode.Lead oxide appears to be poisonous yellow or reddish yellow solid. Structural characterization of films was analyze with X- ray diffraction (XRD) and optical band gap was determined by UV-Vis Spectroscopy.
KEYWORDS:Oxidation; Pb(NO3)2; Tafel; UV; UV-Vis; Voltammetry; XRD.
Introduction
Lead oxide (PbO) find extensive application in thin film transistor, gas sensor and phototransistor, optical storage device photo thermal and photovoltaic conversion.1 PbO has two polymorphic forms and a wide band gap red α – PbO at β-PbO stable at high temperature and spray pyrolysis technique has been a major focus in the preparative investigation due to the advantages as compared to the different techniques low temperature and low coast plays important role in2 the properties of nonmaterial has the ability to produce large area high quality films attached to uniform thickness.3 Transparent conducting oxide thin films such as PbO, ZnO, SnO2 and MnO2 have been studied in detail by many.4-7 The α-PbO was obtained by spray pyrolysis and β – PbO when heat treated at 250°C in the present work prepared from spray pyrolysis decomposition of aqueous solution of lead oxide. It plays a very important role in the development of electrode active mass within lead acid batteries that are used in a variety of areas due to its high power density and also has wide application temperature range complete recycling system and relatively low price.8 Synthesis of PbO nano structures has gained importance owing to their unusual physiochemical properties leading to outstanding application as humidity sensor.9 The conductivity is generally studied as a function of temperature, and it may also depend on structural changes in the material10. As determine by X-ray crystallography, both polymorphs, tetragonal and orthorhombic feature a pyramidal four-coordinate lead center. The tetragonal shape of four Pb-O bond have the matching length but in the orthorhombic two are shorter and other two longer. The tetragonal form is typically red or orange color and the orthorhombic is usually yellow or orange in colour but the color is not a very reliable indicator of the structure of the material. The tetragonal or orthorhombic forms of PbO occur in nature as a rare minerals. The type of lead within lead glass is normally PbO and it is used broadly in making glass. The reftactive index of glass increases by using PbO depending on the type of glass and decreasing the viscosity of the glass it increase the ability of the glass to absorb x- rays. PbO was also used comprehensively in ceramic glazes for household ceramics, and it is still used, but not extensively any more. Acombination of PbO with glycerin sets to hard water-resistant cement so as to be used to join the flat glass sides and bottom of aquariums, and was also used to close up glass panels in window frame. Other less dominant application includes the vulcanization of rubber and the production of certain pigments and paints.
Table 1: represents physicochemical properties of PbO.
|
Sr.no. |
Property |
Values / remark |
|
01 |
Formula |
PbO |
|
02 |
color |
Yellow or Red |
|
03 |
Molar mass |
223.20 g/mol |
|
04 |
Density |
9.53 g/cm3 |
|
05 |
Melting point |
888 °c (1,630 °F; 1,161 k) |
|
06 |
Boiling point |
1,477 °c (2,691 °F; 1,750 k) |
|
07 |
Solubility in water |
0.017 g/L, Insoluble |
|
08 |
Structure |
Tetragonal crystal structure |
|
09 |
CAS Number |
1317-36-8 |
|
10 |
class |
Oxide |
|
11 |
Hill system formula |
O, Pb1 |
|
12 |
Magnetic susceptibility |
42.0 × 10⁻⁶ cm3/mol |
|
13 |
UN number |
3288 |
|
14 |
RTECS number |
OG1750000[n1] |
Experimental Section
Lead oxide thin film has been prepared by spray pyrolysis technique onto highly cleaned glass substrate. Cleaning of substrate was done by keeping the glass slides deep in double distilled water and a few drops of nitric acid were then added to stabilize the solution (2 hours). Then substrates were dried by infra red lamp for 30 min. A highly cleaned glass substrate with the dimension (35 × 25 × 1.35)nm3is used for the synthesis of lead oxide films. A homogenous solution of different molarities from 0.01M to 0.09M were prepared by dissolving lead nitrate compound Pb(NO3)2 by (Precursor) double distilled deionized water. The solutions were stirred for one hour with magnetic stirrer. The thin films were obtained spraying at 250°C with a flow rate of 20 ml min-1 in a vertical type spray pyrolysis reactor. The carrier gas was (compressed nitrogen) and the solution is fed into a sprayer nozzle at a pre adjusted constant atomization pressure (4.5 bar)and at a constant temperature 250°C for the selected 0.05M sample.
Electrochemical measurement of potentiostatic
The curves were obtained using a Volta lab electrochemical system with a potentiostatic klitel-2 series 1MT102 electrochemical interface connected to personal computer for data acquisition and control. The cell were Galvano statically charged and discharge in the range of 1 mA Constant current density 100 mA. Cyclic voltammetry (CV) measurement were performed by scanning rate of 10.000 mV/s and 40.000mV/s.
Results and Discussion
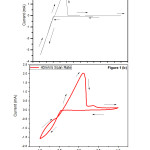
Cyclic voltammaogram of PbO nanocomposit from a pure PbO. The scan rate was 10 mV/s and 40mV/s in a Electrochemical performance of Nano-crystalline cyclic voltammaogram (CV) of Nano-crystalline PbO Figure 1(a-b).
Cyclic voltammetry studies were carried out by using Ag/AgCl as an reference electrode while point as a counter electrode for the different scan rate The variation of capacitance as function of voltage in the range of (0.1) volt. During cyclic polarization test the potential is swept in the anodic direction until localized corrosion initiates as indicated by a large increase in the applied current as shown in Figure 1(a-b) after these points the direction of the scan is reversed and the current decrease until it changes polarity it can also see that the minimum voltage -0.6 V and maximum voltage 0.6 V. cyclic voltammetry cycle is 1 and wait time 2.00 sec. The scanning voltage is carried from -0.6 V to 0.6 V with respect to Ag/AgCl electrode. Pb2+ shows the sharp oxidation peak at -0.21V giving the oxidation reaction as
Pb2+ (aq) + 2e– → Pb (s), E° = -0.13V———(Eq 1)
When the lead oxide formation takes place on the glass substrates at the temperature 250°C the reduction reaction
Pb(NO3)2 → 2PbO + 4NO2 + O————————————————–(Eq 2)
Figure 1(a-b): Cyclic voltammetry of pure Pb2+ scan rate was 10.00 mV/ s and 40.00mV/s.
 Click on image to enlarge |
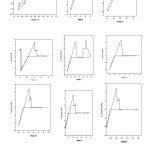
Figure 2: Cyclic voltammaogram in the solution containing 0.01M to 0.09M Pb(NO3)2 solutions at pH 8 with scan rate of 40mV/s with respect to reference electrode Ag/AgCl as a reference electrode of high stability and platinummesh counter electrode (mesh size 10mm × 10mm) having high surface area and platinum tip as an working (diameter 1mm and length 10mm).
|
|
Linear Sweep Voltammetry
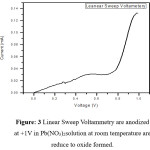
Linear sweep voltammetry electrochemical measurement have been made on polycrystalline lead and lead oxide in alkaline media in this work we present differential capacitance and fast ( LSV ) data on polycrystalline lead and electrodeposited Pb(NO3)2. 13,14 In these test the electrode are anodized at +1 V in Pb(NO3)2solution at room temperature 25°C and then the electrode potential was swept to 50,00 mv/s with 1 V scan rate to reduce the oxide formed. Figure 3 shows a typical voltammetry 0 V to 13 V at current limit 1 mA graph wait time is 2.00 sec. Linear sweep voltammetry or the lead nitrate solution was carried out at +1V anodic potential at the current limit of 1mA and wait of 2.0 sec with respect to Ag/AgCl as an reference electrode and point as an working electrode point resh as an counter electrode. The interaction of the Pb2+ ions in the solution till 0.75Vis almost linear but current increase after 0.75 V.
Figure 3: Linear Sweep Voltammetry are anodized at +1V in Pb(NO3)2solution at room temperature are reduce to oxide formed
|
|
Linear sweep voltammetry (LSV) is the one of the most commonly used method for evaluation of the electrochemical stability corrosion resistance of the Pb anodized at Pb (NO3)2solutions at 25°c for 30 min. These tests were performed by sweeping the potential at a scan rate of 40.000 mV/s from 0V to 1V and then backed to form a hysteresis loop. Open circuit potential (OCP), Chronoamperometry, Tafel corrosion for the potential amplitude was set to (Polarization V Tafel)100 mv peak to peak (AC signal) the decay curves potential versus time were recorded in an open circuit condition.
Open Circuit Potential
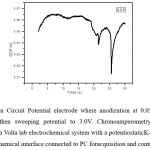
PbO is the major product of Pb anodic corrosion at high potential was chosen for the OCP (Open Circuit Potential) test, because maximum duration 30 sec is the growth potential for PbO is shown in figure 4. Working electrode were charged at 0.05 V for 1h and decay curves of potential voltage vs time were recorded in an open circuit condition at the beginning time an induction period appears in the OCP (Open Circuit Potential) curve.The box is any two terminal device such as a battery or solar cell. The two terminals are not connected to anything (an “open circuit”), so no current can flow into Voc between the terminals is the open circuit voltage of the device.”
Figure 4: Open Circuit Potential electrode where anodization at 0.05 V in 0.05 M Pb(NO3)2.and then sweeping potential to 3.0V. Chronoamperometry- curves were obtained using a Volta lab electrochemical system with a potentiostatic K-LITE 1.2 series a 1MT electrochemical interface connected to PC for acquisition and control
|
|
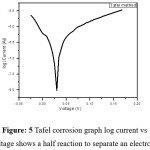
Tafel corrosion
The Tafel equation is an equation in electrochemical kinetics relating the rate and corrosion of Pb electrode with various surfaces are studied [15-20] of an electrochemical reaction to the over potential electrochemical reaction occurs in two half reaction on separate electrodes the Tafel equation is applied to each electrode separately.The Tafel equation is applicable to the region where the values of polarization, the dependence of current on polarization is usually linear and the solution of Pb2+gives the minimum current at potential of +0.030V
Figure 5: Tafel corrosion graph log current vs voltage shows a half reaction to separate an electrode
|
|
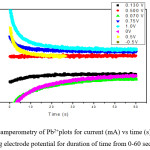
Chronoamperometry
Chronoamperometry curves for Pb2+solution in 0.05M Pb(NO3)2 for different working electrode potential is shown in fig below. The Chronoamperometry curves for Pb2+solutiondeposition from Pb (II) solution recorded ultrasonic condition and the difference ultrasound intensities final potential of -0.75V to -0.5V is shown. The experimental duration 1 min and current limit 1 mA.
Figure 6: Chronoamperometry of Pb2+plots for current (mA) vs time (s) at different fixed Platinum working electrode potential for duration of time from 0-60 sec
|
|
Structural Analysis
The X-ray diffraction data of the films were obtained by means of Philips PM 11730 diffractometer using CuK- alpha having wavelength of 1.5418 Å, radiation source.
Figure 7: XRD of film deposited on glass substrate at 2500C
|
|
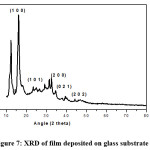
Table 2: XRD analysis of the PbO samples deposited on glass substrate at 250 0C with average crystalline size 25.62nm.
|
Glass Sustrate |
(h K l) |
Angle 2 theta degree |
d Spacing |
FWHM |
Crystallite Size (nm) |
|
(1 0 0) |
16.04 |
2.459 |
2.92 x 10⁻³ |
47.46 |
|
|
(1 0 1) |
23.52 |
2.087 |
6.54 x 10⁻³ |
21.19 |
|
|
(20 0) |
33.13 |
1.802 |
8.11 x 10⁻³ |
17.09 |
|
|
(0 2 1) |
34.20 |
1.277 |
6.22 x 10⁻³ |
22.28 |
|
|
(2 0 2) |
44.23 |
1.44 |
7.21 x 10⁻³ |
20.09 |
The obtained XRD spectra matched well with JCPDS card 05-0561 for the tetragonal PbO. In order to obtain detailed structural information, the crystallite size D calculated to the Scherer equation as D = 0.9λ/ βcosθ where D is crystallite size, β is FWHM of the observed peak λ is wavelength of the X-ray and θ is angle of diffraction. The average crystalline size for PbO films deposited on the glass substrate is 25.62nm. The values of crystallite sizes are given in Table 1.
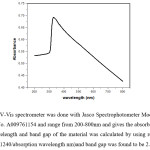
UV-Vis Spectroscopy
Figure 8 : UV-Vis spectrometer was done with Jasco Spectrophotometer Model name V- 670Serial No. A009761154 and range from 200-800nm and gives the
absorbance peak at 430nm wavelength and band gap of the material was calculated by using relation band gap (eV)= (1240/absorption wavelength nm) and band gap was found to be 2.88eV
|
|
Conclusions
PbO thin films have been deposited on glass substrates at 2500C temperatures by the spray pyrolysis technique using lead nitrate as the precursor salt. The cyclic voltammetry studies gives the oxidation peaks for the various molarities from 0.01M to 0.09M of Pb2+ ions and Linear sweep voltammetry gives the interaction of the Pb2+ ions in the solution till 0.75Vis almost linear but current increase after 0.75 V. Open Circuit potential (OCP) is maximum initially and it suddenly decreases at 25 second interval might be sudden impurities present in the precursor solution and Tafel measurements was done to find the rate of corrosion of the lead oxide and behavior of solution is plotted at constant applied potential to the platinum working electrode which gives the oxidation and reduction of lead ions with applied potentials. XRD of the films matches with the standard data and UV-Vis spectrometry gives band gap of material 2.88eV.
Acknowledgements
The authors are grateful to Principal KKHA Arts, SMGL Commerce and SPHJ Science College for providing the necessary facilities to carry out this work and excellent encouragement and support and Savitribai Phule Pune University, Department of Physics, Pune for the Characterizations facilities.
Funding Source
The author(s) declare(s) that the funding is done by author only.
Conflict of Interest
The author(s) declare(s) that there is no conflict of interests regarding the publication of this article.
References
- Mondal P. S.,Okazaki R., Taniguchi H and Terasaki I. Photo-Seebeck effect in tetragonal PbO single crystals. J. Appl. Phys. 2013;114;17.
CrossRef - Barsan N., Koziej D and Weimar U. Metal oxide-based gas sensor research: How to?,” Sensors Actuators.B Chem. 2007;121(1):18–35.
CrossRef - Patil P. S. Versatility of chemical spray pyrolysis technique.Mater. Chem. Phys. 1999;59(3):185–198.
CrossRef - Thangaraju B and Kaliannan P.Optical and structural studies on spray deposited α-PbO thin films.Semicond. Sci. Technol. 2000;15(6):542–545.
CrossRef - Shinde S. D.,Patil G. E., Kajale D. D., Ahire D. V., Gaikwad V. B and Jain G. H. Synthesis of zno nanorods by hydrothermal method for gas sensor applications. Int. J. Smart Sens. Intell. Syst. 2012;5(1):57–70.
CrossRef - Chiu H. C and Yeh C. S. Hydrothermal synthesis of SnO2 nanoparticles and their gas-sensing of alcohol. J. Phys. Chem. C. 2007;111(20):7256–7259.
CrossRef - Johnson C. S. et al., Structural and electrochemical studies of α-manganese dioxide (α-MnO2). J. Power Sources. 1997;68(2):570–577.
CrossRef - Bashir A. et al., High-performance zinc oxide transistors and circuits fabricated by spray pyrolysis in ambient atmosphere.Adv. Mater. 2009;21(21):2226–2231.
CrossRef - Ng S. H. , Wang J.,Konstantinov K.,Wexler D., Chen J and Liu H. K. Spray Pyrolyzed PbO-Carbon Nanocomposites as Anode for Lithium-Ion Batteries. J. Electrochem. Soc. 2006;153(4):A787–A793.
CrossRef - Konstantinov K., Ng S. H., Wang J. Z., Wang G. X., Wexler D and Liu H. K. Nanostructured PbO materials obtained in situ by spray solution technique for Li-ion batteries.J. Power Sources. 2006;159(1)241–244.
- https://en.wikipedia.org/wiki/Lead(II)_oxide.
- Yang J., Zhua X and Kumar R. V. Ethylene glycol-mediated synthesis of PbO nanocrystal from PbSO4: A major component of lead paste in spent lead acid battery.Mater. Chem. Phys. 2011;131(1–2):336–342.
CrossRef - Comini E. Metal oxide nano-crystals for gas sensing,” Analytica Chimica Acta. 2006;568(1–2):28–40.
CrossRef - Wriedt H. A. The O-Pb (Oxygen-Lead) system.J. Phase Equilibria. 1988;9(2):106–127.
CrossRef - Perednis D and Gauckler L. J.Thin film deposition using spray pyrolysis. J. Electroceramics. 2005;14(2):103–111.
CrossRef - Kumaravel R.,Krishnakumar V., Ramamurthi K., Elangovan E and Thirumavalavan M. Deposition of (CdO)1-x(PbO)x thin films by spray pyrolysis technique and their characterization.Thin Solid Films. 2007;515(7–8):4061–4065.
CrossRef - Hasan N. B and Mohammed M. A. Electrical properties of (PbO) 1-x (CdO) x thin films fabricated by spray pyrolysis technique. Pelagia Res. Libr. Adv. Appl. Sci. Res. 2015;6(7):116–121.
- Bashir A. et al., High-performance zinc oxide transistors and circuits fabricated by spray pyrolysis in ambient atmosphere.Adv. Mater. 2009;21(21):2226–2231.
CrossRef - Kumar V. K., Ramamurthi K and Elangovan E. Preparation of (CdO)1-x(PbO)x and (CdS)1-x(PbS)x thin films by spray pyrolysis technique and their characterization. Solid State Commun. 2004;132(10):673–677.
CrossRef - Montaser A. A., Veluchamy P and Minoura H. Structure morphology and photoelectrochemical responses of anodic PbO films formed on Pb electrodes in various concentrations of alkaline solution. J. Electroanal. Chem. 1996;419:(1)47–53.
CrossRef
Accepted on: 03-05-2018


![]()
![]()
![]()