Structural, Optical and Photoelectrochemical Properties of Cuprous Oxide Synthesized by Low Temperature Thermal Oxidation
Department of Physics, University of Nairobi, P.O. Box 30197 00100, Nairobi, Kenya,
Correspondent Author Email: ogachoa@uonbi.ac.ke
DOI : http://dx.doi.org/10.13005/msri/130101
Download this article as:
![]()
Ultrathin films (50-150nm thick) cuprous oxide (Cu2O) thin films were deposited by low temperature thermal oxidation technique. The structural, optical and photoelectrochemical properties of the thin films were investigated. X-ray diffraction (XRD) and high resolution scanning electron microscope (SEM) was used to study the phase composition and the thin films’ microstructure respectively. XRD results showed that Cu2O was the dominant phase albeit some trace CuO peaks were also observed indicating surface formation of an extremely layer of CuO probably during the cooling process following either deposition or during the annealing steps. SEM showed a highly nanostructure consisting long narrow nanorods with broadening to the surface but with extremely narrow, sharp cylindrical roots standing on the substrate. Photoelectrochemical properties of the films were studied via a standard three electrode using a saturated calomel cell (SCE).
KEYWORDS:
thermal oxidation; nanorods; cyclic voltammetry; photoelectrochemical
Introduction
Cuprous oxide (Cu2O) is generally a p-type semiconductor with direct optical energy band gap of 1.9 – 2.2 eV, hence lying within the solar rich visible spectral range ideal for photovoltaic applications. Cuprous oxide is also a nontoxic semiconductor and having a high optical absorption coefficient of the order of 105 cm-1 in the visible region [Malerba et al., 2011], making it a choice material for fabrication of thin films solar cells. Furthermore, the maximum theoretical efficiency of Cu2O solar cells is around 20% [Lingling et al., 2010]; therefore achieving 10% efficiency required for commercial grade modules is not a remote possibility.
Monocrystalline cuprous oxide thin films though difficult to synthesize, several reports indicate that they can be grown by techniques such grain growth [Toth et al., 1960], from the melt [Trivich and Pollack, 1970] etc. On the other hand, methods such as thermal oxidation [Ahalapitiya et al., 2009]; chemical oxidation [Mohd et al., 2011], electrodeposition [Rakhshani and Varghese , 1987; de Jongh et al., 2000], sputtering [Dimopoulos et al., 2014], and anodization techniques have been used in the preparation of polycrystalline Cu2O thin films [Septina et al., 2011]. Some of these techniques are reviewed by Rakhshani (1986), where it was noted that, high-temperature thermal oxidation of cuprous oxides normally results in structural defects arising due to the differences between the expansion coefficients of Cu2O and elemental copper phase. These undesired defects result in low device performances in Cu2O derived applications.
Nonetheless, thermal oxidation still has some comparative advantages in that as a technique, it is fast and fairly a cheaper way for preparing copper oxides. Using thermal oxidation technique, copper oxide thin films can be formed either on the host copper sheet or on a suitable substrate coated with metallic copper. However, the popular high temperature oxidation has a limitation in that monocrystalline Cu2O can only be formed within a narrow range of temperatures (l050-1150oC in air), a temperatures range which gives single phase Cu2O via Wagner oxidation mechanism, where copper ions migrate through the Cu2O lattice via copper atom vacancies to the surface where they react with oxygen thus forming Cu2O [Rakhshani, 1986]. However, there is a challenge to form a single phase, because during the cooling process after oxidation, formation of a thin cupric oxides (CuO) surface layer (≈10nm or less) on top of the base single phase Cu2O is unavoidable. This CuO surface layer must be etched out by a suitable post deposition procedure.
At lower temperatures, below 1000oC, polycrystalline mixture of cuprous and cupric oxides is formed. Nevertheless, low temperature synthesis of single phase Cu2O have been reported [Cruzen and Miley, 1940; Roos et al., 1983]. In this work, we report the preparation and characterizations of low temperature (500oC) thermal oxidation of single phase Cu2O on transparent conducting oxide (TCO) suitable for photovoltaic applications.
Materials and Experimental Methods
Chemical oxidation of Cu2O followed this procedure. Using a cleaned copper wire (99.999%, Alfa Aesar, Germany) copper thin films (50 – 150nm) were thermally evaporated onto a cleaned transparent conducting oxide (TCO) glass substrates (TEC15) under high vacuum conditions (10-5mbar). To do this, copper wires were placed on a tantalum boat filament in a vacuum chamber and then a current direct current (DC) was passed through the tantalum filament. The film thickness was controlled by either deposition time or by an in built thickness monitor. Then thermal oxidation of copper was then done in a quartz tube furnace at the atmospheric pressure condition at 500oC for 120–180 minutes.
Optical characterizations were conducted using UV–VIS–NIR spectrophotometer (Spec–3700 DUV; Shimadzu-Japan), structural study was done using Siemen D5000 XRD spectrometer. The morphological studies was accomplished via high resolution SEM (Zeiss/LEO 1550, USA), while the photoelectrochemical properties/stability of the films were investigated in a galvano-potentiostatic mode using a standard three-electrode cell containing 0.5M K2SO4 electrolyte. A platinum wire and an Ag/AgCl electrode in saturated KCl served as the counter electrode and the reference electrode, respectively. The surface area of Cu2O working electrode was 2.0cm2, the scan rate was 10mV/s at room temperature (23oC). The white light illumination source was a Halogen lamp (Varian Elmac, USA) / 200mW/cm2. Light chopping was done manually using an opaque cardboard shutter.
Results and Discussions
Fig. 1 shows a typical XRD spectrum of Cu2O synthesized by low temperature deposition. Two clear peak of Cu2O that is (110) and (111) crystal orientation are observed. Small peaks associated with surface CuO are also observed (at 38.3o and 52.2o) foot print was observed in the spectrum indicating that no significant CuO formed on the top of base Cu2O. The intensities of the peaks associated with cupric oxide are significantly reduced after surface etching, an indication that CuO surface layer was nearly completely etched out also implying that CuO surface layer was an extremely thin coating on top of Cu2O base layer.
Figure 1: Typical XRD of low temperature thermally oxidized Cu2O.
 Click on image to enlarge |
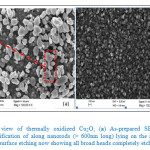
Typical high resolution SEM images of the Cu2O are shown in Fig. 2, for as-prepared (Fig. 2a) and after surface etching by 0.1M HCl for 5 minutes (Fig. 2b). It is observed that, as-prepared Cu2O were characterized by long gradually tapering broad-headed nanorods with long and very sharp ended narrow roots (≈ 25 nm or less) into the bulk (Fig. 2a). A few of these nanorods probably ejected during thermal oxidation are seen lying horizontally on the surface (Fig. 2a). After surface etching using 0.1M HCl (Fig. 2b), all the broad heads were completely chiseled out, thus exposing a densely packed narrow roots of nanorods, whose top view are seen in the high resolution SEM (Fig. 2b). This top view SEM image (Fig. 2b) shows crystallites ranging between 50 – 20 nm in diameter and less, with latter being the majority. Crystal sizes calculation using Debye-Scherrer equation gave mean crystal size between 15.70 – 16.26nm. Results, which lie within acceptable range of typical sharp tip of the nanorods, observed lying in Fig. 2a. This confirms our earlier proposed that the structure consisted of nanorods with sharp tips standing on the substrate. Even in the absence of a confirmatory cross-sectional SEM scan which was not done the ejected surface lying nanorods with broadened surface heads (Fig. 2a) is good enough evidence.
Figure 2: Top view of thermally oxidized Cu2O; (a) As-prepared SEM showing a magnification of along nanorods (> 600nm long) lying on the surface and (b) after surface etching now showing all broad heads completely etched.
 Click on image to enlarge |
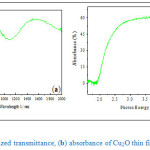
Optical characterizations of the thin films were done using transmittance spectroscopy. Fig. 3a and Fig. 3b below shows typical normalized transmission and absorbance spectra of Cu2O respectively. It is observed from the first figure that the onset of strong transmission starts well after 600nm (Fig. 3a) into the infrared spectra region, else no transmission below this wavelengths. This is consistent with the optimal band energy of Cu2O that has been reported to be 620nm (2.0eV) [Filipič and Cvelbar, 2012]. Alongside transmittance of Cu2O, Fig. 3b shows a typical absorbance spectrum of these samples, where it is observed that weak absorption started slightly below the stoichiometric Cu2O band gap energy (2.0eV). The onset of strong absorption, as shown in Fig. 3b, was at 1.6eV, which is clearly beyond CuO band edge (1.2eV). This observation is a strong indication that, the films were dominantly composed of Cu2O or CuO phase if were present, must have been extremely thin to be have significant foot print in the optical transmittance data used. The absorption witnessed below the Cu2O absorption edge can be therefore attributed to trace CuO in addition to possible interband transitions in Cu2O as a result of surface states or states associated with remnants impurities, possibly related to partial thermal oxidation of elemental copper, etc.
Using normalized transmittance data, the coefficient of absorption, α(E) of Cu2O thin films were computed with the aid of Eq. (1) in the limits of very low reflectance as is this case of a highly structured surface

where t is the film thickness and Tnorm is the normalized transmittance as a function of the incident photon energy (E).
Figure 3: (a) Normalized transmittance, (b) absorbance of Cu2O thin film (≈ 100nm thick)
 Click on image to enlarge |
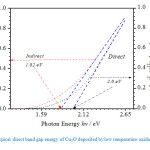
Fig. 4, is a typical plot of Plot of (αhv)n versus photon energy for a 100nm thick Cu2O film, where ‘n’ is constant assigned a values of 2 or for allowed direct transition and indirect transitions respectively. From the intercepts of the linear fits, the optical band energy gaps were estimated to be 1.82eV and 1.96eV for indirect and direction band to band transitions respectively. These results are in agreement with earlier observations reported for monocrystalline Cu2O phases synthesized by thermal oxidation at temperatures below 1000oC, albeit film thickness dependency of the energy gaps observed by Rasadujjaman and his coworkers [Rasadujjaman et al., 2012]. Rasadujjaman’s group reported a systemic reduction of Cu2O band gap with increasing film thickness.
Figure. 4: Typical direct band gap energy of Cu2O deposited by low temperature oxidation.
 Click on image to enlarge |
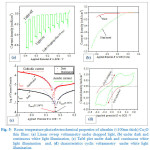
The redox properties of Cu2O thin films are presented in Figure 5. Fig. 5a & b are typical linear sweep (LSV) of Cu2O thin films immersed in 0.5M K2SO4 electrolyte at room temperature (23oC). The variation of photocurrent response to cyclic electromagnetic polarization is clearly observed. Under illumination, an increase in current density is observed at negative potentials typical of p-type Cu2O. This photocurrent response can be explained by Schottky type heterojunction formed between the electrolyte and the bulk p-type Cu2O semiconductor material, in which, negative applied potentials (equivalent of forward biasing in p-n junction diodes), decreases the junction potential barrier height enabling more carriers to cross the junction resulting in the observed increase in cathodic photocurrent density when negative potential is applied. Conversely, for positive applied potentials (reverse biased junction), the barrier height increases thereby effectively reducing the photocurrents in those regimes.
Figure 5: Room temperature photoelectrochemical properties of ultrathin (≈100nm thick) Cu2O thin films: (a) Linear sweep voltammetry under chopped light, (b) under dark and continuous white light illumination, (c) Tafel plot under dark and continuous white light illumination and, (d) characteristics cyclic voltammetry under white light illumination
 Click on image to enlarge |
Tafel plots are also shown in Fig. 5c, where a 4.3% (≈ 7mV) reduction of the thin films’ corrosion potential is observed under illumination. This photo-initiated reduction in corrosion potential is consistent with increased photoactivity due to increased photo-generated carrier densities under white light illumination.
Fig. 5d shows a typical cyclic voltammogram (CV) of a Cu2O electrode immersed in the 0.5M K2SO4 at room temperature (23oC). Within the scanned range of -450 mV to +600 mV, two peaks were observed, one an anodic and the other cathodic peak. The first anodic peak is observed at +220 mV, while the second cathodic peak is observed at -210 mV. These anodic and cathodic peaks are attributed the oxidation of Cu2O to CuO and subsequent reduction of CuO back to Cu2O according to equation below respectively [Ye et al., 2012].
Cu2O + 2OH– → 2CuO + H2O + 2e– (2)
2CuO + H2O + 2e- → Cu2O + 2OH– (3)
To avoid either dissolution of copper oxide or formation of metallic species on the surface of our oxide thin film, we opted to limit our CV scan between -450 mV and +600 mV.
The results of this study showed that low temperature deposition of a near single phase Cu2O is possible and that, post deposition cooling did not result in appreciable top CuO layer as confirmed by the X-ray diffraction spectrum and optical results. Optical based further confirmed that strong charge separation happened only in the spectral range typical of monocrystalline Cu2O phase. The SEM pictures showed a highly nanostructure formation consisting of long and extremely narrow, cylindrical and sharp rooted nanorods which are broadening towards the surface. This method therefore offers a very simpler and faster way of fabricating monocrystalline Cu2O albeit the final etching procedure to remove surface CuO phase formed during post oxidation cooling.
Acknowledgements
The authors are grateful to the University of Nairobi for granting study leave, Department of Physical Chemistry, Uppsala University, for provision of research facilities. Special thanks to my host in Uppsala University, namely Prof. Geritt Boschloo, Prof. Anders Hagfeldt and their colleagues. Their numerous and fruitful discussions during the research are appreciated. Finally, our sincere gratitude goes to the International Science Program (ISP) at Uppsala University for financial support.
References
- Jayatissa H. A., Guo K., Jayasuriya C. A. Appl Surf. Sci. 2009;255:9474.
CrossRef - Cruzen C. G and Miley H. A. J. Appl. Phys. 1940;11:631.
CrossRef - de Jongh P. E., Vanmaekelbergh D and Kelly J. J. J. Electrochem. Soc. 2000;147(2):486.
CrossRef - Dimopoulos T., Peic A., Abermann S., Postl M., List-Kratochvil E. J. W and Resel R. EP J Photovoltaics. 2014;5:50301.
CrossRef - Filipič G and Cvelbar U. Nanotechnology. 2012;23:16. doi:10.1088/0957-4484/23/19/194001.
CrossRef - Lingling W., Lok-kun T., Nathan S and Giovanni Z. J. Phys. Chem. C. 2010;114:11551.
CrossRef - Malerba C., Biccari F., Azanza L., Ricardo C., D’Incau M., Scardi P., Mittiga A. Sol. Energy Mater. Sol. Cells. 2011;95:2848.
CrossRef - Mohd R. J., Mohd S. M. S., Nor L., Hee A. C. Int. J. Electrochem. Sci. 2011;6:6094.
- Rakhshani A. E., Varghese J. Solar Energy Materials. 1987;15:237.
CrossRef - Rakhshani A. E., Solid-State Electron. 1986;29[1]:7.
CrossRef - Rasadujjaman M., Shahjahan M., Khan M. K. R., Rahman M. M. SUST J. Sci. and Techn. 2012;20[6]:1.
- Roos A., Chibuye T., Karlsson B. Sol. Energy Mat. 1983;7:453.
CrossRef - Septina W., Shigeru I., Khan M. A., Takeshi H., Ha T., Michio M., Laurence M. P. Electrochimica Acta. 2011;56:4882.
CrossRef - Toth R. S., Kilkson R., Trivich D. J. Appl. Phvs. 1960;31:1117.
CrossRef - Trivich D., Pollack G. P. J. Electrochem. Soc. 1970;117:344.
CrossRef - Ye W., Xiumei W., Hong S., Yanbo L., Ke Z., Yuhou W. Int. J. Electrochem. Sci. 2012;7:7902.
Accepted on: 19-May-2016


![]()
![]()
![]()