Structural, Dielectric, Magnetic and Optical Properties of Cerium Substituted Ni-Zn Mixed Ferrite
Lovely George 1* 
Dept. of Physics, Maharajas College, Ernakulam, Kerala, India-682011.
Dept. of Physics, Little Flower College, Guruvayoor, Thrissur, Kerala, India-680103.
Corresponding author Email: logeojomy@gmail.com
DOI : http://dx.doi.org/10.13005/msri/140208
Download this article as:
![]()
Ce3+ doped Nickel Zinc ferrites have been synthesised by sol-gel method followed by sintering at 4000C for 4 hours. Powder X-ray diffraction patterns of the prepared samples confirm the formation of single phase cubic spinel structure. Crystallite size of samples doped with Ce are smaller than that of undoped ferrite. The lattice parameters decrease with increase in doping concentration of Ce3+ ion. W-H plots are drawn to study the strain effect in crystal structure.SEM micrographs show formation of spherical shaped nanoparticles. The vibration bands corresponding to metal oxygen vibrations at tetrahedral and octahedral sites in the FTIR spectra are in the reported range suggesting Ce3+occupation on octahedral sites predominantly. The doped samples exhibited lower saturation magnetization. The relative permittivity is found to show a decreasing trend with increase in frequency for all the samples which is characteristic of normal ferrimagnetism. The AC conductivity initially increases with frequency then remains constant over a wide range of frequencies. The UV analyses give the band gap which is less than 2 eV for all the samples which show that these are semiconducting materials.
KEYWORDS:AC conductivity; Band gap; Lattice strain; Mixed ferrites; Magnetocrystalline anisotropy; Rare earth doping; Single phase cubic spinel structure; Vibration bands
Introduction
The synthesis of rare earth doped Ni-Zn mixed ferrites by sol gel method has attracted much interest in researchers. The Ni-Zn ferrites are considered as the most versatile of ferrites for their relatively higher saturation magnetization and low dielectric loss. The rare earth doping in Ni-ZN ferrites only enhances these desirable properties suitable for high frequency and magnetic storage applications (G Bate et al, 1991, Jacobo et al, 2004). Sol gel method has been reported to have the advantage of good control over stoichiometric ratio and formation of ultrafine nanoparticles . (B P Jacob et al, 2011).The properties of ferrite nanoparticles are affected by the composition and microstructure which in turn are dependent on the synthesis method. The variations in the properties of mixed ferrites prepared by sol gel method for low concentration of rare earth doping are investigated in the present work.
Experimental Details
Synthesis
Ce doped Ni-Zn mixed ferrites with formula CexNi0.6Zn0.4Fe2-xO4 with x varying from x=0.0, 0.02, 0.04, 0.06 are synthesised using sol gel method. Stoichiometric ratios of AR grade ferric nitrate, Nickel nitrate, Zinc nitrate and Cerium nitrate were added to minimum amount of ethylene glycol and stirred using a magnetic stirrer at room temperature till completely dissolved and was heated at 60oC to form a wet gel. This gel is dried at 120oC which self ignites to form an ash like product. This product was then ground well till fine powder and sintered at 400oC for 4 hours in a muffle furnace. For AC conductivity studies the samples were made into pellets by adding PVA as binder in a hydraulic press by applying a uniform pressure of 5 tons and were sintered at 250oC in the muffle furnace for 1 hour.
Characterization
The crystallographic information like average crystallite size D, lattice constant a, X-ray density Dx and porosity P are found using indexed XRD patterns of the samples. XRD patterns were recorded using X-ray powder diffractometer at room temperature using Cu-Kα radiation (λ= 1.5406 Ao) at 40kV and 35mA. The crystallite size is calculated using the Scherrer formula. For recording the FTIR spectra in the range from 400cm-1 to 3500 cm-1 at room temperature the pellets of the samples were prepared using KBr as solvent. The morphology and grain size are analysed using SEM (VEGA3TE SCAN).
Magnetic properties at room temperature were studied using VSM for upto a maximum field of 15 kOe. Pellets (10mm in diameter) were prepared and coated with silver paste to act as electrodes for measuring the dielectric properties using precision impedance analyser (WAYNE KERR 6500B) in the frequency range from 2 kHz to 6MHz. The optical absorbance of the sintered powder was recorded at room temperature in the range 200-900nm using a UV spectrophotometer.
Result and Discussion
Structural analysis
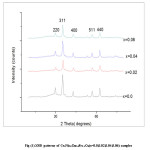
XRD patterns of Ce doped Ni-Zn mixed ferrite for x=0, 0.02, 0.04, 0.06 nanoparticles are presented in fig (1). The diffraction peaks in the patterns correspond to reflection planes of a cubic spinel crystal of Ni-Zn ferrite. Broad diffraction peaks represent the nano sized crystallites.
Figure 1: XRD patterns of CexNi0.6Zn0.4Fe2-xO4(x=0.0, 0.02, 0.04, 0.06) samples
 Click on image to enlarge |
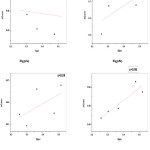
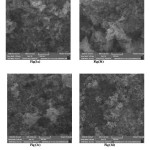
The crystallinity decreases with increase in the Ce conc. accounted by the decreased intensity in the observed peaks. However, the peak height is found to be minimum for x=0.02. Lattice constant and crystallite size decrease though not monotonously with Ce3+ doping. Similar results have been reported (R P Pant et al, 2010). Presence of Ce ions on grain boundaries causes hindrance in grain growth. In addition, the occupancy of Ce ions at octahedral sites replacing Fe3+ causes lattice strains which produce an internal stress which also hinders grain growth (I Ahmad et al, 2014). The decrease in lattice parameter could be due to the possibility of Ce3+ occupation at the tetrahedral site which leads to contraction of unit cell. Decrease in intensity of peaks suggests the difficulty in crystallisation on doping RE ions with relatively large ionic radii. Fig (2a,b,c,d) are the Williamson-Hall plots for all the samples. The plot for undoped sample shows negative slope and this points to a compressive strain in the nanoparticles. The average grain size D, average lattice constant a, X-ray density and porosity of the samples are tabulated in table (1). A sudden decrease in the lattice parameter for the sample with x= 0.02 suggests Ce3+ ion occupation at the tetrahedral sites also which results in contraction of the unit cell. SEM images as presented below in fig (3a,b,c,d) show formation of spherical and slightly agglomerated particles. The homogeneity of shape and grain size has been reported to affect electrical and magnetic properties.
Figure 2a,b,c,d: W-H plots of CexNi0.6Zn0.4Fe2-xO4(x=0.0,0.02,0.04,0.06) samples
 Click on image to enlarge |
Table 1: Structural parameters of CexNi0.6Zn0.4Fe2-xO4 samples
|
Composition |
Crystallite Size D(nm) |
Lattice Constant a (Ao) |
X-ray density Dx (g/cm3) |
Apparent Density (g/cm3) |
Porosity (%) |
|
X=0.00 X=0.02 X=0.04 X=0.06 |
16.713 12.124 14.828 13.932 |
8.43277 8.38162 8.42419 8.42278 |
5.251 5.386 5.342 5.382 |
1.226 1.44 1.079 1.173 |
76.65 73.26 79.8 78.21 |
Figure 3a,b,c,d: SEM images of CexNi0.6Zn0.4Fe2-xO4(x=0,0.02,0.04,0.06) samples
 Click on image to enlarge |
FTIR study
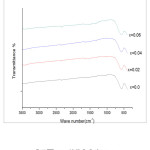
FTIR spectra taken at room temperature in the wave number range from 400cm-1 to 3500 cm-1 are shown in fig(4).
Figure 4: FTIR spectra of CexNi0.6Zn0.4Fe2-xO4 samples
 Click on image to enlarge |
Two distinct broad peaks are seen in all the spectra. While the high frequency dip around 575cm-1 (ν 1 ) is the stretching vibration of metal oxygen bond at the tetrahedral or A site , the lower frequency dip around 400cm-1 (ν 2) corresponds to the metal oxygen bond vibration at octahedral or B site. The value of ν 1 slightly increases and ν 2 shows a shift to lower frequency with increase in Ce3+ doping. The shift of ν 1 towards higher frequency side is attributed to the perturbation in the Fe3+-O2- bonds caused by the substitution of Ce3+ ions and the lattice distortion (T.J Shinde et al, 2012). Increase in site radius at B-site due to occupancy of Ce3+ ions of larger ionic radius replacing Fe 3+ ions has reduced the fundamental frequency ν 2 (K B Modi et al, 2006).
Magnetic study
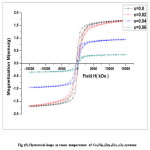
The magnetic hysteresis loops recorded at room temp for the samples using VSM is shown below in Fig (5).
Figure 5: Hysteresis loops at room temperature of CexNi0.6Zn0.4Fe2-xO4 systems
 Click on image to enlarge |
The saturation magnetisation Ms, coercivity Hc, remanence Mr and remanent ratio (Mr/ Ms) of the samples have been presented in table (2). The large decrease in Ms with Ce3+ doping is due to the lower magnetic ordering at room temperature of the localised 4f electrons of RE ions. As Ce3+ conc. increases, Ce being paramagnetic and due to its probable occupancy at B-site ( B.P.Lodgoankar et al, 2000, Jing Jiang et al, 2007), the B-site lattice magnetization decreases. Also the presence of Ce3+ at B-site diminishes A-B exchange interactions (E. Rezlescu et al, 1997). Thus the ferrimagnetic ordering in Ni-Zn ferrite is disturbed by the addition of Ce3+ ions and thus Ms decreases (W.J Nellis et al, 1969). Magnetic properties of ferrites depend on the grain size, cation substitution, A-B exchange interaction and magnetocrystalline anisotropy. The decrease in grain size and decrease of A-B super exchange interaction causes spin canting at the surface of nanoparticles that decreases the Ms (K. Singhai et al, 2006, P. Priyadharsini et al, 2009). The drastic decrease of Ms for the sample x=0.02 may be due to increase in magnetocrystalline anisotropy for the sample. The coercivity is found to decrease for the samples because coercivity depends on strain, defects, presence of non magnetic ions and magnetocrystalline anisotropy. It has been established that in the multidomain regime, coercivity depends inversely on the particle size. The remanent ratio R is a measure of the ease with which the direction of magnetization gets oriented to the nearest magnetization direction after the removal of magnetic field. Low value of R suggests isotropic nature of the material. The magnetic hysteresis loss decreases with Ce doping which may be due to decrease in magnetocrystalline anisotropy.
Table 2: Magnetic parameters of CexNi0.6Zn0.4Fe2-xO4 samples
|
Composition |
Coercivity Hc ( G) |
Magnetization Ms(emu) |
Remanence MR(emu) |
Remanence ratio R |
|
X=0.00 |
390.26 |
1.6965 |
0.52138 |
0.3073 |
|
X=0.02 |
378.49 |
1.6823 |
0.40182 |
0.2389 |
|
X=0.04 |
382.46 |
0.94985 |
0.30044 |
0.3163 |
|
X=0.06 |
367.91 |
0.34442 |
0.09508 |
0.2760 |
Dielectric properties
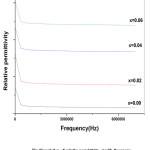
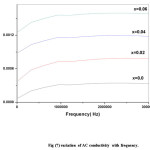
Dielectric properties which include dielectric constant, dielectric loss tangent tanδ and AC conductivity for the samples are studied in the frequency range 2 kHz to 6MHz at room temperature. Fig (6) and (7) show the variation of real part of relative permittivity є’(dielectric constant) and AC conductivity with frequency respectively. It has been suggested that the sharp decrease in magnetization may be due to a extreme change in centro-symmetric FCC structure of parent crystal caused by low concentration doping with Ce ions. It is found that relative permittivity decreases with increase in frequency initially and then becomes constant at higher frequencies. Similar results have been reported (E Pervaiz et al, 2012). The dielectric behaviour is due to electric polarization under AC field. Permittivity depends on conduction phenomenon which in turn is due to electron hopping between Fe2+ and Fe3+ ions. This hopping leads to polarization at grain boundaries as the electrons heap up at grain boundaries due to high resistance of grain boundaries (C.G.Koop’s,1951). Occupancy of Ce3+ at octahedral sites replacing Fe3+ ions decreases the hopping rate and obstructs the conduction process due to their stable valency. At high frequencies hopping lags behind the field variations thereby the relative permittivity є’ remains constant.
AC conductivity initially increases linearly with frequency. The increase is related to conduction by electron exchange between the Fe ions of different valence states. The electron exchange between A-B sites is more significant than B-B exchange. On applying the AC field, the electron exchange increases thereby resulting in an increase in the AC conductivity (K.M.Batoo , 2011).
Figure 6: variation of relative permittivity є’ with frequency
 Click on image to enlarge |
Figure 7: variation of AC conductivity with frequency
 Click on image to enlarge |
Optical study
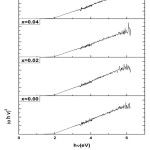
The absorbance spectra for the determination of optical band gap have been recorded. A graph (αhν)2 and hν is plotted as shown in fig(8) where α is the absorption coefficient. The band gap Eg is given by the x-intercept obtained by extrapolating the straight line to the hν axis (S N Dolia et al, 2006). The band gaps of the samples lie below 2eV which is suggestive of semiconducting nature of the prepared samples.
Figure 8: Plot between (αhν)2 and hν for CexNi0.6Zn0.4Fe2-xO4 samples
 Click on image to enlarge |
Conclusion
It can be concluded that significant changes in the properties of Ni-Zn mixed ferrites have been brought about by doping with low concentration of Ce3+ ions. Lattice constant and crystallite size decrease with doping The high percentage of porosity increases its potential use as adsorbants. FTIR study suggests that Ce3+ ions mainly occupy octahedral sites or B-site. Ce substitution has resulted in a decrease in magnetization and coercivity. The magnetic hysteresis loss is found to be influenced by Ce3+ addition. All the compositions exhibit normal ferrimagnetic behaviour. The observed decrease in dielectric constant with Ce doping can be explained in terms of decrease in the hopping rate due to cerium substitution at octahedral site replacing Fe3+ ions. The optical band gap study indicates a semiconducting nature of the samples. Thus cerium doping has resulted in reduction of dielectric constant and magnetic hysteresis losses which are desirable for high frequency applications.
Acknowledgements
The authors are indebted to the The University Grants Commission (UGC), India for the financial support for the work and also grateful to STIC, CUSAT, Kochi, Kerala, India and IIT Chennai, TN, India for their cooperation extended in carrying out the various measurements.
Conflict Of Interest
There is no conflict of interest among the authors regarding the claim of the work.
References
- Bate G., Magn J. Magn. Mater. 1991;100(1-3):413-424.
CrossRef - Jacobo E., Uhalda S. D., Bertorello H. R., Magn J. Magn. Mater. 2004;272:2253-2254.
CrossRef - Jacob B. P., Thankachan S., Xavier S.,Mohammed E. M. Phys. Scr. 2011;84:045702.
CrossRef - Pant R. P., Arorav M., Kaur B., Kumar V., Kumar A., Magn J. Magn. Mater. 2010;322:3688.
CrossRef - Ahmad I.,Abbas T., Ziya A. B.,Maqsood A. Ceramint. 2013;12:142.
- Shinde T. J., Gadkari A. B., Vasambekar P. N. J. Alloys Comp. 2012;513:80–85.
CrossRef - Modi K. B., Rangolia M. K., Chhantbar M. C and Joshi H. H . J. Mater.Sci. 2006;41:7308–18.
CrossRef - Lodgoankar B. P., Vasambekar B. P., Vaingankar A. S. Bull. Mater.Sci. 2000;2312,87.
CrossRef - Jiang J, Yang Y M and Li L C , Physica B: Condens. Matter. 2007;329:105–8.
CrossRef - E.Rezlescu, N. Rezlescu, E.D Popa, L.Rezlescu, Phy Stat. Solidi A. 1997;162,673.
CrossRef - Nellis W J and Legvold S ,Phys. Rev. 1969;180:581–90.
CrossRef - Singhal S, Barthwal S K and Chandra K , J. Magn. Magn. Mater. 2006;306:233–40.
CrossRef - Priyadharsini P, Pradeep A, Rao P S and Chandrasekaran G , Mater. Chem. Phys. 2009;116:207–13.
CrossRef - E.Pervaiz, I.H.Gul, J. Current Engg, Technology. 2012;2,377.
- C.G. Koops, Phys. Rev. 1951;83,121.
CrossRef - K.M.Batto, Physica. 2011;B,406,382.
- S N Dolia, Rakesh Sharma, M P Sharma & N S Saxena, Ind.J.Pure.Appl.Phys. 2006;44,774.
Accepted on: 03 Nov 2017


![]()
![]()
![]()