Effect Of Znso4 and Mnso4 on the Growth of Sulphamic Acid Single Crystals
K.G.Anupriya1 and P. Hemalatha2*
1Research and Development Center, Bharathiar University, Coimbatore, Tamil Nadu, 641046, India.
2Research Department of Physics, Govt. Arts College, Coimbatore, Tamil Nadu, 641018, India.
Corresponding Author Email: drphemacbe@gmail.com
DOI : http://dx.doi.org/10.13005/msri/150207
Download this article as:
![]()
Single crystals of Sulphamic Acid doped with Zinc Sulphate and Manganese Sulphate were grown at room temperature using slow evaporation technique. Structural analysis of the grown crystals was done using single crystal X Ray Diffraction and powder X Ray Diffraction studies. Various functional groups seen in the grown crystals are determined using FTIR spectroscopic analysis. The cut-off wavelength of ZnSO4 and MnSO4 doped Sulphamic acid were evaluated by UV-Vis-NIR spectral studies. Thermal behaviour of the grown crystals was identified from Thermogravimetric Analysis (TGA) and Differential Thermogravimetric Analysis (DTA). The mechanical strength and Second harmonic generation of the grown crystals was identified by Vicker’s Microhardness Test and Kurtz powder technique respectively.
KEYWORDS:Doped Sulphamic Acid; FTIR; NLO; Slow evaporation method; TGA; XRD,
Introduction
In the developing field of laser technology and optical communications, the generation of second harmonics is very essential. The search for new Nonlinear Optical materials and enhancing the properties of existing NLO material is a persistent process due of its wide application in the field of science and technology.1 When optical waves propagate through Nonlinear Optical crystal, there should be good transfer of energy between the waves. A Nonlinear Optical crystal should have non zero NLO coefficient, transparency at required wavelengths, high physical and optical properties to be used in frequency conversion.2 Inorganic materials have good chemical flexibility, high thermal and mechanical stability and good transmittance.3 Among the inorganic materials sulphamate derivatives are most suitable for NLO property with its two planar rings configuration and good blue light transmittance.4
Sulphamic acid is a highly stable inorganic acid with orthorhombic structure. Its molecular weight is 97.09.1 It is soluble in water and exhibits zwitterionic form. Large single crystals of pure SA can be grown at low temperatures.5 Due to these characteristics JIS (Japanese Industrial Standard), IUPAC and British analytical methods committee has accepted SA as a standard substance for titrimetric analysis.6 The growth, structure, UV-Vis-NIR, neutron diffraction and etching, Raman Studies and dielectric analysis of pure SA single crystal is already reported.1,5,7-10 Here we report the effect of ZnSO4 and MnSO4 in the growth of SA single crystal.
Experimental Procedure
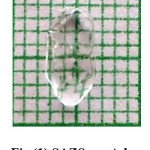
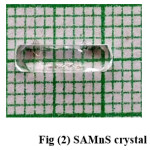
SA: ZnSO4 (SAZS) and SA: MnSO4 (SAMnS) were synthesized by slow evaporation method. Analytical grade chemicals were used for the growth of crystals. Zinc Sulphate (4.036 g/20 ml) and Manganese Sulphate (5.033 g/20 ml) along with Sulphamic acid (3.236 g/20 ml) were prepared by mixing them in the ratio 1: 1 using double distilled water and by stirring the saturated solutions for four hours using magnetic stirrer. The final homogeneous solution of 40 ml is filtered twice using micro sized pore whatman No.1 filter paper in to a separate beaker. The beaker was closed tightly with perforated aluminium foil to minimize evaporation and was kept in a dust free, vibration less environment. Good quality single crystals were grown and reystallization process was carried out to improve the purity of the grown crystals. The photographs of the crystals are shown in figure (1) and (2).
Figure 1: SAZS crystal
 Click on image to enlarge |
Figure 2: SAMnS crystal
 Click on image to enlarge |
Results and Discussion
Single Crystal X-Ray Diffraction
Single Crystal X-Ray Diffraction is done using BRUKER AXS KAPPA APEX II CCD using MoKa radiation (l=0.71073 Å) with Shelxtl software. Pure SA and ZnSO4 have orthorhombic structure.11,12 When ZnSO4 is added to pure SA, SAZS crystal has tetragonal structure.
MnSO4 has Orthogonal Structure.13 When MnSO4 is added to SA, SAMnS has tetragonal structure. The addition of dopants has changed the crystal structure of SAZS and SAMnS crystals. The lattice parameters of the grown crystals are tabulated in table (1)
Table 1: Lattice parameters of SAZS and SAMnS crystals
|
Parameter/ Grown crystals |
a (A0) |
b(A0) |
c (A0) |
V (A03) |
α (deg) |
β (deg) |
γ (deg) |
Crystal System |
|
SAZS |
8.077 |
8.077 |
9.267 |
604.5 |
90 |
90 |
90 |
Tetragonal |
|
SAMnS |
8.0867 |
8.0867 |
9.232 |
603.7 |
90 |
90 |
90 |
Tetragonal |
Powder X Ray Diffraction Analysis
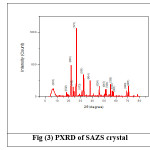
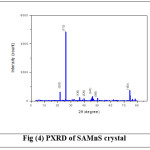
Powder X Ray Diffraction analysis of SAZS and SAMnS crystals are done using BRUKER AXS D8 ADVANCE Diffractometer with CuKa (λ=1.5406A0) radiation. The grown crystals are crushed into fine powder. The powdered crystals are scanned for 2q, between 3 degree and 80 degree and shown in Figure (3) and (4). All the observed reflections are indexed. The presence of well defined peaks in the spectrum confirms the high crystallinity of SAZS and SAMnS crystals.14 Some extra peaks are observed which are due to the striations in the grown crystals by doping. The change in the intensity of peaks compared to pure SA confirms the incorporation of dopants which had brought changes in the bond length of the grown crystals.5
Figure 3: PXRD of SAZS crystal
 Click on image to enlarge |
Figure 4: PXRD of SAMnS crystal
 Click on image to enlarge |
Fourier Transform Infrared Spectroscopy
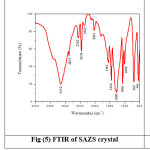
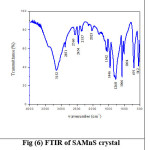
Fourier Transform Infrared Spectroscopy identifies the functional groups present in SAZS and SAMnS crystals.15 It is recorded using THERMO NICOLET AVATAR 370 from 500 cm-1 to 4000 cm-1. The broad envelope in the region 3750 cm -1 -2970 cm-1 in pure SA is not observed in SAZS and SAMnS.9 At 1455 cm -1, the frequency of deformation of NH3+ is identified for pure SA, where as it is seen at 1446 cm -1 for SAZS and SAMnS.16 The SO3– stretching at 1069 cm-1 in pure SA is moved to 1066 cm-1 for SAZS and SAMnS. Change in the absorption pattern of the grown crystals is due to the presence of dopants.17 The recorded spectrum is shown in Figure (5) and (6).The functional groups present in SAZS and SAMnS crystals are compared with pure SA and recorded in the table (2).
Figure 5: FTIR of SAZS crystal
 Click on image to enlarge |
Figure 6: FTIR of SAMnS crystal
 Click on image to enlarge |
Table 2: Vibrational band assignment of grown crystals
|
Pure SA (cm-1) |
SAZS (cm-1) |
SAMnS (cm-1) |
Assignment |
|
3211 |
3152 |
3152 |
Degen. NH3+ stretching |
|
2871 |
2871 |
2871 |
Sym. NH3+ stretching |
|
1538 |
1543 |
1542 |
Degen. NH3+ deformation |
|
1455 |
1446 |
1446 |
Sym. NH3+ deformation |
|
1337 |
1268 |
1268 |
Degen. SO3– stretching |
|
1069 |
1066 |
1066 |
Degen. SO3– deformation |
|
1001 |
1004 |
1004 |
S – O stretching |
|
687 |
692 |
691 |
NH2 and N – H wagging |
UV-Vis-NIR Study
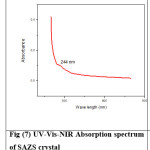
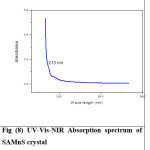
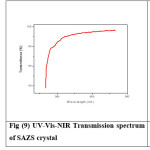
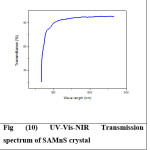
Crystals should have wide transparency window to be used for practical applications [18, 19]. Transmittance of the grown crystals are examined from 200 nm to 800 nm using VARIAN CARRY 300 SPECTROPHOTOMETER.
Optical transparency of 94% is observed for SAZS in the wavelength region of 508 nm – 800 nm and the cutoff wavelength is 244 nm. For SAMnS crystal, optical transparency is 95% in the wavelength region of 458 nm – 800 nm and the cutoff wavelength is 213 nm. Both SAZs and SAMnS crystals have good transmittance in the visible region. The grown crystal has less absorption till 800 nm. This shows that the dopant has improved the optical transparency in the visible region of the grown crystal which makes it a good candidate for opto electronic applications.20 The UV-Vis-NIR spectrum is shown in Figures (7) – (10).
Figure 7:UV-Vis-NIR Absorption spectrum of SAZS crystal
 Click on image to enlarge |
Figure 8: UV-Vis-NIR Absorption spectrum of SAMnS crystal
 Click on image to enlarge |
Figure 9:UV-Vis-NIR Transmission spectrum of SAZS crystal
 Click on image to enlarge |
Figure 10: UV-Vis-NIR Transmission spectrum of SAMnS crystal
 Click on image to enlarge |
TGA/DTA Analysis
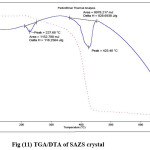
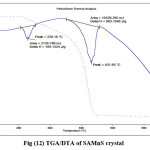
TGA measures the changes in weight with temperature which can be due to changes in the sample composition and thermal stability.21 Thermal analysis calculates the maximum temperature with which a material can be utilised. 22,23 TGA/DTA analysis is carried out using PERKIN ELMER DIAMOND Thermal analysis system in nitrogen atmosphere between 400C and 7300C at a heating rate of 100C/min. TGA of grown crystals is shown in Figure (11) and (12)
The TG of the crystal SAZS shows no weight loss upto 227°C which is due to the lack of coordinated water and high stability of the crystal. The weight loss observed at 227°C confirms the melting point of the crystal. The sharp endothermic peak with a weight loss of 79% at 425°C corresponds to the formation of an unstable intermediate ZnH2SNO3. After 500°C, there is a sudden decrease in the decomposition temperature due to the evolution of sulphuric acid.
The thermogram of SAMnS shows that there is no decomposition below 100°C, which is due to the absence of water molecule in the crystal. The weight loss at 229°C determines the melting point of the crystal. The sharp endothermic peak with a weight loss of 79% at 431°C is due to the formation of the unstable intermediate MnH2SNO3. The evolution of sulphuric acid corresponds to a sudden decrease in the decomposition temperature after 500°C. From TGA analysis it is clear that this crystal was stable upto 229°C and can be used for Nonlinear Optical activity till 229 0C.
Figure 11: TGA/DTA of SAZS crystal
 Click on image to enlarge |
Figure 12: TGA/DTA of SAMnS crystal
 Click on image to enlarge |
Microhardness Study
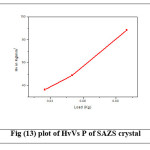
The microhardness of SAZS and SAMnS crystals are measured using SHIMADZU MICROHARDNESS TESTER with diamond intender. Loads of magnitude varying from 25 gm to 100 gm is applied for a fixed interval of time over a well-polished grown crystal. The Vicker’s Microhardness number Hv is calculated using the relation
Hv= 1.8544P/d2kgmm-2
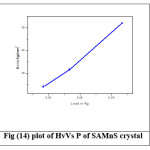
where P is the applied load in kg and d is the average diagonal length of the indentation in mm. A graph is plotted between Hardness number (Hv) and applied load (P) and is shown in Figure (13) and (14). For SAZS and SAMnS crystals, there is an increase in hardness with load which is due to the work hardening of the surface layer.24 This proves that these crystals exhibit Reverse Indentation Size Effect (RISE). Beyond 100 g, cracking occurs due to the release of internal stresses generated locally by indentation.25 The increasing value of hardness makes the crystal harder.
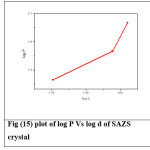
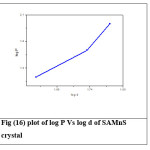
According to Meyer’s law, the relation between the load and size of indentation is given by
p=kdn
where k is the material constant and n is the Meyer’s index or work hardening coefficient.26,27 A graph is plotted with log P and log d which is shown in Figure (15) and (16). The figure shows a straight line (after least square fitting) and from the slope of the graph the work hardening coefficient (n) is calculated. For SAZS, the work hardening coefficient is found to be 13.514 and for SAMnS it is 7.290. According to Onitsch and Hannemann work hardening coefficient ‘n’ should be more than 1 and less than1.6 for hard materials and more than 1.6 for soft materials.28,29 So the grown crystals are soft materials.
Figure 13: plot of HvVs P of SAZS crystal
 Click on image to enlarge |
Figure 14: plot of HvVs P of SAMnS crystal
 Click on image to enlarge |
Figure 15: plot of log P Vs log d of SAZS crystal
 Click on image to enlarge |
Figure 16: plot of log P Vs log d of SAMnS crystal
 Click on image to enlarge |
Conclusion
SAZS and SAMnS single crystals are grown by slow evaporation solution growth technique at room temperature with aqueous solution. XRD analysis determined tetragonal structure of SAZS and SAMnS crystals. FT-IR analysis confirms the XRD analysis in the form of functional groups present in the grown crystals. Absorption spectrum determines the lower cut off wavelength of 244 nm for SAZS and 213 nm for SAMnS. The presence of dopants has improved the optical property of the grown crystals. Optical studies also confirm the high transparency of SAZS and SAMnS crystals in the visible region. TGA/DTA curves show that all the grown crystals are thermally stable up to 2260C, which is higher than the limit for pure SA. Vicker’s Microhardness test confirms that the grown crystals are soft materials. Hence special care has to be taken during device fabrication using the grown crystals.
Acknowledgements
The authors are grateful to Dr.Shibu M Eapan, STIC, Kochi University, Kochi, Kerala for analyzing XRD and FTIR. The authors acknowledge Dr. P. K.Das, IISc, Bangalore for providing the NLO characterization facility and also thank Y. VincentSagayaraj, Instrumentation Center, St.Joseph’s Trichy, Tamil Nadu for his help in carrying out the Microhardness studies.
Conflict of Interest
The Authors Declare That There Is No Conflict Of Interests Regarding The Publication Of This Article.
Funding Source
The authors declare that the funding is done by author only.
References
- Dr.Rita A. G., Divakar T. C. Characterization of Sulphamic Acid Single Crystal by Optical Techniques. IJSRP. 2012;2(6).
- de Vries S. A., Goedtkindt P., Huisman W. J., et al. X-Ray Diffraction Studies of Potassium Dihydrogen Phosphate (KDP) Crystal Surfaces. J. Cryst. Growth. 1999;05:202-208.
CrossRef - Umadevi T., Lawrence N., Ramesh R. B., Selvanayagam S., Stoeckli-Evans H., Bhagavannarayana G., Ramamurthi K. Synthesis, Crystal Growth, Structural, Optical, Thermal and Mechanical Properties of Semiorganic Nonlinear Optical Material: L-Cystine Dihydrochloride. Journal of Minerals and Materials Characterization and Engineering. 2010;9(5):495-507.
CrossRef - Rafi S. A and Srinivasan P. Synthesis, growth and Characterizations of CesiumSulfamate single crystal by solution growth technique. Elixir Crystal Growth. 2012;50:10628-10631.
- Valluvan R., Selvaraju K et al., Growth and characterization of sulphamic acid single crystals: A nonlinear optical material. Material Chemistry and Physics. 2006;97(1):81-84.
CrossRef - Yoshimori T and Tanaka T. Preparation of sulphamic acid single crystals and their assay by precise coulometric titration. Anal ChemActa. 1975;66:85.
- Sass R. L. Acta. The Neutron diffraction studies on the crystal structure of Sulphamic Acid crystal. 1960;13(4):320-324.
- Thaila T and Kumararaman S. Effect of NaCl and KCl doping on the growth of sulphamic acid crystals. SpectrochimicaActa Part A. Molecular and Biomolecular Spectroscopy. 2011;82(1):20-24.
CrossRef - Raj A. S and Muthusubramanian P. Normal coordinate analysis of the sulphamate ion.Journal of Molecular structure. The Chem. 1982;89(34):291-296.
- Hickling S. J and Woolley R. G. Normal coordinate analysis of the sulphamate ion. Chemical Physics letters. 1990;166(1):43-48.
CrossRef - Rajyalakshmi S., Brahmaji B., et al. Influence of metal ions Mg2+, Fe2+ on the growth of sulphamic acid single crystals. Int. J. Chem. Tech Res. 2015;8(2):599–604.
- Kokkoros P. A & Rentzeperis P. J. The crystal structures of anhydrous sulphates of copper and zinc. Acta Cryst. 1958;11:361.
CrossRef - https://pubchem.ncbi.nlm.nih.gov/image/imagefly.cgi?cid=177577&width=300&height=300.
- Yoshimori T and Tanaka T Preparation of sulphamic acid single crystals and their assay by precise coulometric titration. Anal ChemActa. 1975;66:85.
- Yuanyuan L., ShaopengAmirkhanian W. Investigation of the graphene oxide and asphalt interaction and its effect on asphalt pavement performance. Construction and Building Materials. 2018;165:572–584.
CrossRef - Ramesh R. B., Ramesh R., Gopalakrishnan R., Ramamurthi K., Bhagavannarayana G . G. structural, spectral, mechanical and optical properties of pure and metal ions doped sulphamic acid single crystals. Spectrochimica. Acta Part A. 2010;76:40-475.
CrossRef - Vijayabhaskaran B., Ramachandra C. R. The Effect of Cobalt Mixing on Pure Copper Mercury Thiocyanate Nonlinear Optical Crystal. Journal of Minerals and Materials Characterization and Engineering. 2012;11:691–694.
CrossRef - Delfinio M., Loiacono G. M. et al, Halide effect in L(+) glutamic acid halogen acid salts. J. Solid State Che. 1978;23(3-4):289-296.
CrossRef - Delfinio M., Dougherty J. P. et al, Approximate nonlinear optical susceptibility of cubic boracites. Journal of Applied Physics. 1976;51(4):2264-2266.
CrossRef - Mary M. A., Perumal S., Monikanda K & Prabhu. IJERT. 2015;04(07):41-46.
- Gunasekaran S., Anand G., Kumaresan S., Kalainathan S. Mechanical dielectric and thermal analysis of semi-organic NLO materials. Adv. App. Sci. Res. 2011;2(3):550–557.
- Bruno T. J and Svoronos P. D. N. Hand book of Basic Tables for Chemical Analysis –Second Edition, CRC Press. U. S. 1989.
- Ruby A and Alfred S., Raj C. Growth Spectral Optical Thermal and Mechanical Properties of Thiourea doped Trisglycine Zinc Chloride Nonlinear Optical Crystal. IJSRP. 2013;3(3):1-5.
- Siva V. s., Sankar R., Siddheswaran R., Jayavel R., Murugakoothan P. Growth and characterization of tetra l-lysine alanine mono hydrochloride dihydrate (TLAMHCl) a new semiorganic nonlinear optical single crystal. Materials Chemistry and Physics. 2008;109(1):119-124.
CrossRef - Zhang J. X. Growth and characterization of a new nonlinear optical crystal: [(18C6)Li][Cd(SCN)”3]. Spectrochimica. Acta Part A. 2009;74(2):532–535.
CrossRef - Suvitha A and Murugakoothan P. Synthesis growth structural, spectroscopic and optical studies of a semiorganic NLO crystal: Zinc guanidinium phosphate. Spectrochim. Acta Part A. 2012;86:266–270.
CrossRef - Gopinath S., Barathan S and Rajasekaran R. Growth and characterization of semi- organic nonlinear optical crystal: urea thiourea zinc sulphate (UTZS). G. J. P&A Sc and Tech. 2012;2:27-33.
- Onitsch E. M. The present status of testing the hardness of materials. Mikroscopie. 1956;95:2-14.
- Hanneman M., Manch M. 1941;23:135.
Accepted on: 19-07-2018


![]()
![]()
![]()
![]()