Introduction
Manufacturing industries always concern about the quality of their products. In drilling, a good surface roughness and roundness of the holes are among the quality that cannot be ignored. Surface roughness – often termed as roughness, is a component of surface texture. It is quantified by the deviations in the direction of the normal vector of a real surface from its ideal form. If these are largely deviated, the surface is rough and vice versa. Whereas, roundness measurement determining how much something aparts from being an ideal circle. Both specifications are crucial in determining the quality of drilled holes.
Some research have been carried out to correlate between holes quality and mechanical properties of their functions. Kahles et al.,1 noticed that a dramatic loss of mechanical property such as fatigue and loss of surface integrity might be happened in machining titanium. A study on effect of drilling process on fatigue life from open holes has been carried out by Weiping et al.,2 proved that the crack was initiated at the counter holes edge in which it would energize the fatigue crack nucleation. In regards to fastener holes, the crack life accounts for 80% of total fatigue form. A research by Castle3 on drilling-induced fatigue damaged in Ti-6Al4V concluded that surface finish affect the fatigue life.
There is no certain roughness value reported in drilling titanium alloys. As a general pictures the achieved roughness of other materials are presented. Amran et al.,4 achieved roughness of between 1.06 and 2.59 µm on drilling aluminium alloy with HSS twist drill. Surface roughness value of 5.0 µm was used as one criteria of replacing the drill, as a sign of tool worn (Lin (2002) in Sharif et al.,5). According to Amiss and Milton6 the surface roughness attainable by drilling for common applications is between 6.3 µm (max) to 1.6 µm (min).
In conventional drilling of hard-to-machine metal such as titanium alloys, it is difficult to achieve a reliable surface finish due to rapid tool deterioration. As per industrial view it is advised to use low cutting speed and high feed rate while maintaining abundant cutting fluids in machining titanium alloys.7 However, this advice may not applicable for drilling for some reasons. Firstly, the cutting speed in drilling is changed from null at the chisel to full speed at the heel. Secondly, using a higher feed rate increased the torque significantly. Moreover, increasing both cutting speed and feed rate would accelerate the axial force.8 Thirdly, the coolant is not easily applied during drilling as it has to go to the interface of tool-workpiece through the helical flutes in the opposite direction of chips that come out from the cutting area.
Parameters of drilling have been studied as the main input that affected the surface finish by a few researchers. Kurt et al.,9 stated that surface quality of drilled Al-2024 was affected in order by feed rate, cutting speed and depth of cut respectively. Kilickap et al.,10 in their effort to optimise the drilling parameters (cutting speed, feed rate and cutting fluids) concluded that the best surface roughness was achieved when using low cutting speed and feed rate together with applying MQL condition. Whereas, Zhu et al.,11 investigated the relation between speed & feed rate to the performance characteristic in drilling Ti-6Al4V with the conclusion that applying higher cutting speed resulted in smaller holes roundness values.
Titanium alloy 6Al-2Zr-4Sn-6Mo (Ti-6246) is among α+β titanium alloy and it has better heat treatable and excellent corrosion resistance than the most widely used Ti-6Al-4V.12 This alloy was designed to combine the long term elevated strength properties with the high improved short term strength properties of a fully hardened α + β alloy. Its application is for forging parts in intermediate temperature sections of gas turbine, particularly in compressor disks and blades13 and also for seals and airframe components. Ti-6246 is also under evaluation for deep, sour-well applications.14
To the extent of authors knowledge, there is no published paper discussing drillability of Ti-6246, neither from cutting forces nor from drilled surface perspective. Drillability is a term derived from machinability, which means how easy a material be drilled from different aspect of views. This current research aim is to study drillability of a difficult-to machine material, Ti-6246 alloy, with TiAlN drill insert. In this study, drillability of Ti-6246 was focused on drilled hole surface roughness and hole roundness perspective.
Methodology
Materials, Tool, Test Condition and Measurement
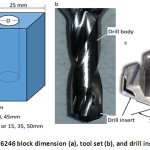
The material used was block of titanium alloy 6246 with typical main composition consist of 6% Al, 2% Sn, 4% Zr and 6% Mo; other component such as O, N, C, N and H cumulatively are less than 0.5% and the rest is titanium.15 Observation using Energy Dispersive X-Ray Spectroscopy (EDS) and Analysis – Element Materials Technology (OES) proved that the composition of on-hand titanium is exactly the same with the literature. Prior to drilling, the material were WEDM-machined to the shape of 25mm x 25 mm with three variation of height: 15, 35 and 50 mm (Figure 1a). The tools used were TiAlN-(submicron) coated carbide insert with point angle of 140o and diameter of 10 mm. The insert is mounted on the top the HSS body drill as depicted on Figures 1b and c.
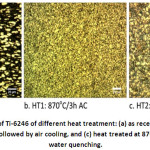
Heat treatments were carried out to make the material be softer and be easier to the machine. Some blocks were drilled in the as received condition. Some other samples were heat treated with the following condition: heating at 870oC for 3 hours then followed by either air cooling (AC) or water quenching (WQ). These samples are called as AR, HT1 and HT2. The hardness of each condition were 318HV, 311HV and 289HV respectively. The microstructure of these blocks are presented in Figure 2 (a-c). A CNC universal milling machine was used for running the experiments.
Figure 1: Ti-6246 block dimension (a), tool set (b), and drill insert (c)
Figure 2: Microstructure of Ti-6246 of different heat treatment: (a) as received (AR), (b) heat treated at 870oC for 3 hours then followed by air cooling, and (c) heat treated at 870oC for 3 hours followed by water quenching.
The holes were measured for their surface roughness at the circumference side at the vicinity of the bottom. Measurement at four quadrants with 3 times replication for each position. The arithmetic surface roughness (Ra) values were measured in order to characterize the surface quality with a surface roughness device with the stroke of probe 0.8 mm (cut off) and range 99.9 µm. The total average of surface roughness for one hole were used for input of analyses of Taguchi with Minitab 17 software. The Ra surface roughness equation for this experimental study can be written as:
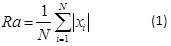
where xi is the measured surface value and N is a number of measurement = 12.
The roundness was measured with a CMM machine as the least square error of the fitted circle to the entire set of points. The least square circle (LSC) is a circle, which separates the roundness profile of an object by separating the sum of total areas of the inside and outside it in equal amounts. The roundness error then can be estimated as the difference between the maximum and minimum distance from this reference circle. Roundness (Rd) is expressed in mathematical equation 2 as follow:
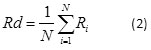
where N is a number of measurement. In this experiment N = 3 in regards to three position of measurement: at the top, at the middle and at the bottom of the holes circumference; and Ri is the value of roundness.
Taguchi Method and Design of Experiments
In this research, four drilling parameters with three levels and one parameter of the block with two levels were used as shown in Table 1.
Table 1: Drilling parameters and their levels
|
Parameters
|
Designation
|
Level 1
|
Level 2
|
Level 3
|
|
Coolant
|
Clt
|
0ff
|
On
|
|
|
Heat Treatment
|
HT
|
AR
|
HT1
|
HT2
|
|
Depth of Drilling [mm]
|
h
|
10
|
30
|
45
|
|
Cutting Speed [m/min]
|
Vc
|
27
|
35
|
50
|
|
Feed rate [mm/rev]
|
Fr
|
0.08
|
0.1
|
0.15
|
An L18 Taguchi array was employed in this research (Table 2), which represents 18 number of experiments. This is significantly less compared with Full Factorial Design (FFD), which will need 2x3x3x3x3 = 162 runs.
Results and Discussion
Analysis of S/N Ratio
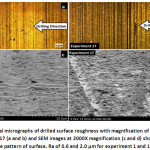
Table 2 presents the roughness and roundness of the holes after drilling. Experiments 1 represent the smallest roughness while experiment 17 resulted in the maximum roughness. The maximum roughness is related to the maximum tool deterioration.8 Figure 3 exhibits the optical microscopy of both experiments (1 and 17). The rougher of the surface of experiment 17 is obvious than that of experiment 1. The pattern of the surface was outlined by the white lines (scratches). There are obviously two patterns of valleys in Figure 3d, the right one is of the tool when it rotating forward and another one (left) is of the retreated tool which is usually faster. Therefore, the configuration is more oblique.
Figure 3: Optical micrographs of drilled surface roughness with a magnification of 100X from experiments 1 & 17 (a and b) and SEM images at 2000X magnification (c and d) showing the surface roughness and the pattern of surface. Ra of 0.6 and 2.0 µm for experiment 1 and 17 respectively
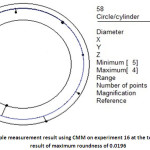
Figure 4 shows a sample of roundness measurement from experiment 16 at the top hole position with the roundness value of 0.0196. This value, then, was averaged with another two results of roundness measurements at the middle and at the bottom of the holes.
Figure 4: A sample measurement result using CMM on experiment 16 at the top of the hole with the result of maximum roundness of 0.0196
The S/N ratio, as the transferred value from the lost function in Taguchi design, of both measured parameters was analysed using Minitab 17 and the result is presented in last two columns of Table 2. The arithmetic mean of Ra and Rd were computed as 1.173 µm and 0.016 respectively. Correspondingly, the average of S/N ratio values for Ra and Rd were found to be -0.96 dB and 37.83 dB.
The signal value represents the actual value of the optimum levels of the control factors, the highest S/N ratio was used. Depending on the combination control factors, the S/N ratio was calculated to be 4.84871 dB for the lowest Ra value of 0.6 µm. Similarly, the S/N ratio was calculated to be 44.7815 dB for the Roundness of 0.006 (Table 2).
Table 2: Drilling parameters and their levels on Taguchi Design L18
|
Exp.
|
Coolant
|
HT
|
h (mm)
|
Vc (m/min)
|
Fr (mm/rev)
|
Observed values
|
S/N Ratio (dB)
|
|
Ra (µm)
|
Rd
|
Ra
|
Rd
|
|
1
|
No
|
AR
|
10
|
27
|
0.08
|
0.6
|
0.006
|
4.84871
|
44.2461
|
|
2
|
No
|
AR
|
30
|
35
|
0.11
|
0.9
|
0.023
|
1.30057
|
32.7654
|
|
3
|
No
|
AR
|
45
|
50
|
0.15
|
1.3
|
0.070
|
-2.15927
|
23.1478
|
|
4
|
No
|
HT1
|
10
|
27
|
0.11
|
0.8
|
0.009
|
1.89008
|
41.0122
|
|
5
|
No
|
HT1
|
30
|
35
|
0.15
|
1.2
|
0.022
|
-1.65078
|
33.1253
|
|
6
|
No
|
HT1
|
45
|
50
|
0.08
|
1.1
|
0.020
|
-1.12539
|
34.0960
|
|
7
|
No
|
HT2
|
10
|
35
|
0.08
|
0.8
|
0.010
|
1.45145
|
40.2646
|
|
8
|
No
|
HT2
|
30
|
50
|
0.11
|
1.6
|
0.014
|
-3.8793
|
37.0981
|
|
9
|
No
|
HT2
|
45
|
27
|
0.15
|
1.8
|
0.009
|
-5.07322
|
40.8830
|
|
10
|
Yes
|
AR
|
10
|
50
|
0.15
|
0.8
|
0.006
|
2.25141
|
44.7815
|
|
11
|
Yes
|
AR
|
30
|
27
|
0.08
|
1.3
|
0.009
|
-2.31221
|
40.9474
|
|
12
|
Yes
|
AR
|
45
|
35
|
0.11
|
1.1
|
0.008
|
-1.08289
|
42.0475
|
|
13
|
Yes
|
HT1
|
10
|
35
|
0.15
|
0.8
|
0.009
|
1.81839
|
41.1433
|
|
14
|
Yes
|
HT1
|
30
|
50
|
0.08
|
1.2
|
0.014
|
-1.4860
|
36.9542
|
|
15
|
Yes
|
HT1
|
45
|
27
|
0.11
|
1.5
|
0.014
|
-3.64322
|
36.9135
|
|
16
|
Yes
|
HT2
|
10
|
50
|
0.11
|
0.9
|
0.015
|
0.59926
|
36.3441
|
|
17
|
Yes
|
HT2
|
30
|
27
|
0.15
|
2.0
|
0.011
|
-5.81059
|
38.8619
|
|
18
|
Yes
|
HT2
|
45
|
35
|
0.08
|
1.4
|
0.015
|
-3.16055
|
36.3631
|
Table 3 presents the level values of the control factors for Ra and Rd according to the Taguchi Method. The five input parameters influenced the roughness by the order are the depth of drilling (h), heat treatment (HT), cutting speed (Vc), feed rate (Fr) and coolant (Clt). It is apparent that the result was different from that of influencing the roundness, in order, they are h, Vc, HT, Clt and Fr. The optimum drilling condition for the smallest Ra was determined as CltoffHTARh10Vc35Fr0.08, whereas for the tiniest Rd values they were CltonHTARh10Vc27Fr0.08.
Table 3: The Mean Response for Ra and Rd
|
The controlled parameters
|
Surface Roughness (Ra)
|
Roundness (Rd)
|
|
Level 1
|
Level 2
|
Level 3
|
Delta
|
Rank
|
Level 1
|
Level 2
|
Level 3
|
Delta
|
Rank
|
|
Clt
|
1.1189a
|
1.2281
|
|
0.1092
|
5
|
0.014233
|
0.011300a
|
|
0.002933
|
4
|
|
HT
|
0.9875a
|
1.1118
|
1.4212
|
0.4337
|
2
|
0.011222a
|
0.014656
|
0.012422
|
0.003433
|
3
|
|
h
|
0.7898a
|
1.3462
|
1.3844
|
0.5946
|
1
|
0.009083a
|
0.015600
|
0.013617
|
0.006517
|
1
|
|
Vc
|
1.3247
|
1.0499a
|
1.1459
|
0.2749
|
3
|
0.009783a
|
0.014439
|
0.014078
|
0.004656
|
2
|
|
Fr
|
1.0812a
|
1.1359
|
1.3033
|
0.2221
|
4
|
0.012322a
|
0.013878
|
0.012100
|
0.001778
|
5
|
a Optimum level, Delta = difference between maximum and minimum
To observe the significance of each parameter the statistical analysis of variance (ANOVA) was implemented. Table 4 and 5 show the ANOVA of the raw data (Ra and Rd).
Table 4: Analysis of Variance ANOVA for Means of Ra
|
Source
|
DF
|
Seq SS
|
Adj SS
|
Adj MS
|
F
|
P
|
Contribution (%)
|
|
Clt
|
1
|
0.05366
|
0.05366
|
0.053657
|
9.62
|
0.015
|
2.22
|
|
HT
|
2
|
0.59846
|
0.59846
|
0.299229
|
53.63
|
0.000
|
24.73
|
|
h
|
2
|
1.32918
|
1.32918
|
0.664591
|
119.12
|
0.000
|
54.92
|
|
Vc
|
2
|
0.23352
|
0.23352
|
0.116759
|
20.93
|
0.001
|
9.65
|
|
Fr
|
2
|
0.16070
|
0.16070
|
0.080349
|
14.40
|
0.002
|
6.64
|
|
Residual Error
|
8
|
0.04463
|
0.04463
|
0.005579
|
|
|
1.84
|
|
Total
|
17
|
2.42015
|
|
|
|
|
100
|
|
R-Sq = 98.2%
|
P-value of 0.05 is the threshold of the significant level of the input parameter; if P-value < 0.05, the effect of the input parameter is considerably significant and vice versa.16 Consequently, all the input parameters are statistically significant influence the roughness (Table 4). On the contrary, all factors on roundness are found to be statistically insignificant (P-value > 0.05) (Table 5).
Table 5: Analysis of Variance ANOVA for Means of Rd
|
Source
|
DF
|
Seq SS
|
Adj SS
|
Adj MS
|
F
|
P
|
Contribution (%)
|
|
Clt
|
1
|
0.000039
|
0.000039
|
0.000039
|
2.04
|
0.191
|
8.61
|
|
HT
|
2
|
0.000036
|
0.000036
|
0.000018
|
0.96
|
0.423
|
7.95
|
|
h
|
2
|
0.000134
|
0.000134
|
0.000067
|
3.53
|
0.080
|
29.58
|
|
Vc
|
2
|
0.000080
|
0.000080
|
0.000040
|
2.12
|
0.182
|
17.66
|
|
Fr
|
2
|
0.000011
|
0.000011
|
0.000006
|
0.30
|
0.751
|
2.43
|
|
Residual Error
|
8
|
0.000152
|
0.000152
|
0.000019
|
|
|
33.55
|
|
Total
|
17
|
0.000453
|
|
|
|
|
100
|
|
R-Sq = 66.5%
|
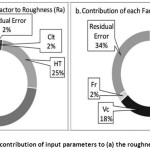
It is obvious that the most influencing parameter of the control factor on Ra is the depth of drilling (h), with the contribution up to 55% (Table 4 and Figure 5a). This can be ascribed to the damaged surface integrity when drilling deeper, which means the deeper the drilling the coarser is the drilled surface. Therefore, it is advised when determining drilled holes surface roughness, we should consider quantifying in different depth then compute the average as it will potentially result in a different value between the top and the bottom of the holes. Alternatively, the measurement should be carried out only at the vicinity of the bottom surface if the maximum roughness is the concern.
Figure 5: Charts showing the contribution of input parameters to (a) the roughness and (b) the roundness
The influencing factor to the roughness is heat treatment with the level of 25% (Figure 5a). It may be related to the different hardness resulted from different heat treatment. The as HT2-ed material is the softest in compare to that of AR and as HT1-ed ones. The softer the material the rougher is the surface after drilling. It is according to the general understanding in machining that softer material is easier to be machined than the harder one.
Coolant, in contrast, contributes only 2% to the roughness of the drilled holes. The least contribution of coolant may be because coolant applying method was not effective. In external cooling type, it is hard for the coolant to reach the interface of tool-material. The coolant and the chips flowing in the same cutting flutes in the opposite direction. Therefore, it may only a little or no coolant to reach the interface. Therefore, drilling with or without coolant did not affect the roughness.
The fact that the most influencing factors to roughness are the depth of drilling and heat treatment is an outstanding result because previous researchers such as17, 18, 19, 20, 21 only considered the cutting speed and feed rate as the main parameters to improve the surface roughness in drilling titanium alloys. The newly published papers22, 23 have also not taken the depth of drilling into account in optimizing hole quality in drilling Ti-64. In this research, the accumulation of both parameters (cutting speed and feed rate) only contribute 16% to the roughness.
In regard to roundness, it was not statistically influenced significantly by the designated factors used in these experiments as the P-value of all factors is bigger than 0.05. The residual error contributes 34% to the roundness which means other factors, which were not chosen in this experiments more influencing than those 5 factors. The depth of drilling influenced 30% to the roundness. Nevertheless, as the P is 0.08 (or higher than 0.05), statistically the influence of depth of drilling is not significant to the roundness. The results are compliant with what was found by Sultan et al.,24 that there was no significant difference in roundness by varying cutting speed and feed rate. Abdel Hafeez et al.,25 found that though there was some inaccuracy of roundness when drilling titanium and aluminium alloys cutting speed and feed rate (as an individual factor or their interactions) did not statistically significant affect the hole diameter accuracy.
Estimation of Optimum Performance of Characteristics
The optimum surface roughness (Ra) is predicted at the selected levels of significant parameters. The significant parameters with optimum levels were already selected as Cltoff, HTAR, h10, Vc35, Fr0.08 for roughness. In this study, the interactions between factors were not concerned. The estimated mean of response characteristic and Ra can be computed as equation (3)26, 27:

where TRa is the overall mean of surface roughness = 1.1 (Table 2), while Cltoff, HTAR, h10, Vc35, Fr0.08 are the average values of roughness with parameters at optimal levels. From Table 3 it is revealed that Cltoff = 1.189, HTAR = 0.9875, h10 = 0.7898, Vc35 = 1.0499, Fr0.08 = 1.0812. Therefore, µRa = 1.189 + 0.9875 + 0.7898 + 1.0499 + 1.0812 – 4(1.1) = 0.697.
A confidence interval for the predicted mean on a confirmation run can be calculated using the following equation:
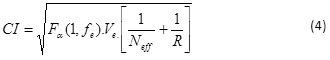
where, Fα(1, fe) is F ratio required for α, α is a risk the opposite meaning of confidence level, fe is error DOF, Ve is error variance, Neff is an effective number of replications. Table 4 revealed that Ve = 0.005579, fe = 8, F0.05(1, 8) = 5.3177. Whereas, the effective number of replication (Neff) is formulated as
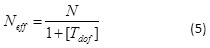
R is number of repetitions for confirmation experiment and N is total number of measurements = 4 quadrants X 3 repetition X 18 (experiments) = 216 times. While Tdof is total degrees of freedom associated with the mean optimum = 9. Thus, Neff = 21.6.
Therefore,
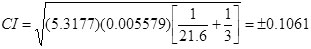
Thus, 95% confidence level interval predicted surface roughness to be 0.697 ± 0.106 µm i.e. the confirmation result should be between 0.591 µm < µRa < 0.803 µm.
Conclusion
The following conclusion can be drawn from the study of drillability of Ti-6246 alloy with Ti AlN carbide coated tools with the focus on drilled surface quality:
- Depth of drilling exerted the greatest effect on the surface roughness by 55%, followed heat treatment (25%), cutting speed (10%), feed rate (6%) and coolant application (2%).
- All of the above parameters did not significantly affect the roundness of the holes.
- The optimum surface roughness between 0.591 µm to 0.803 µm was achieved when drilling with these parameters: Cltoff, HTAR, h10, Vc35, Fr0.08.
For future research in drilling, the depth of drilling should be considered as the main parameter when the surface roughness is the focus of the investigation.
Acknowledgement and Funding Source
We would like to thank Ministry of Research, Technology and Higher Education of Republic Indonesia through the DIKTI scholarship and AUT University that financially supports the main author to pursue his PhD degree at the Auckland University of Technology.
References
- Kahles J. F., Field M., Eylon D., and Froes F. H., “Machining of titanium alloys,” J. Met., 1985; vol. 37, no. 4, pp. 27–35.
CrossRef
- Weiping G., Honglu X., Jun L., and Zhufeng Y., “Effect of drilling process on fatigue life of open holes,” Tsinghua Sci. Technol., vol. 14, no. Supplement 2, pp. 54–57, 2009.
CrossRef
- Castle J., “Drilling Induced Fatigue Damage in Ti-6Al-4V,” Washington University in St. Louis, 2010.
- Amran M. A., et al., “Effects of machine parameters on surface roughness using response surface method in drilling process,” Procedia Eng., vol. 68, 2013.
CrossRef
- Sharif S., Rahim E. A., and Sasahara H., “Machinability of Titanium Alloys in Drilling,” in Intech, 1994; vol. 3, no. c.
- Amiss and Milton J., Machinery’s Handbook. 25th edition, 25th ed. New York: Industrial Press, 1996.
- Milacron, “Machining Titanium,” Cimcool Technical Report, 2007; pp. 1–3.
- Darsin M., Pasang T., and Chen Z., “Performance of TiAlN PVD coated carbide drill when drilling titanium 6246 alloy,” in MATEC Web of Conferences, 2017, vol. 109.
CrossRef
- Kurt M., Bagci E., and Kaynak Y., “Application of Taguchi methods in the optimization of cutting parameters for surface finish and hole diameter accuracy in dry drilling processes,” Int. J. Adv. Manuf. Technol., 2009; vol. 40, no. 5–6: pp. 458–469.
CrossRef
- Kilickap E., Huseyinoglu M., and Yardimeden A., “Optimization of drilling parameters on surface roughness in drilling of AISI 1045 using response surface methodology and genetic algorithm,” Int. J. Adv. Manuf. Technol., 2011; vol. 52, no. 1–4: pp. 79–88.
CrossRef
- Zhu Z., Sui S., Sun J., Li J., and Li Y., “Investigation on performance characteristics in drilling of Ti6Al4V alloy,” Int. J. Adv. Manuf. Technol., 2017.
CrossRef
- Titanium Engineers, “Titanium 6Al-2Sn-4Zr-6Mo Ti 6246 (UNS R56260).” Titanium Engineers, pp. 5–6, 2015.
- Pederson R., “The microstructures of Ti-6Al-4V and Ti-6Al-2Sn-4Zr-6Mo and their relationship to processing and properties,” Luleå University of Technology, 2004.
- Boyer R., Welsch G., and Collings E. W., Materials Properties Handbook: Titanium Alloys. 1994.
- Lutjering G., and Williams J. C., Titanium, 2nd ed. Springer-Verlag Berlin Heidelberg, 2007.
- Khanna N., and Davim J. P., “Design-of-experiments application in machining titanium alloys for aerospace structural components,” Measurement, 2015; vol. 61: pp. 280–290.
CrossRef
- Kumar B. S., and Baskar N., “Integration of fuzzy logic with response surface methodology for thrust force and surface roughness modeling of drilling on titanium alloy,” Int. J. Adv. Manuf. Technol., 2013; vol. 65, no. 9–12: pp. 1501–1514.
CrossRef
- Sharif S., and Rahim E. A., “Performance of coated- and uncoated-carbide tools when drilling titanium alloy-Ti-6Al4V,” J. Mater. Process. Technol., 2007; vol. 185, no. 1–3: pp. 72–76.
CrossRef
- Rahim E. A., Kamdani K., and Sharif S., “Performance evaluation of uncoated carbide tool in high speed drilling of Ti6Al4V,” J. Adv. Mech. Des. Syst. Manuf., vol. 2, no. 4, pp. 522–531, 2008.
CrossRef
- Ramulu M., Branson T., and Kim D., “A study on the drilling of composite and titanium stacks,” Compos. Struct., vol. 54, no. 1, pp. 67–77, 2001.
CrossRef
- Kim D., Ramulu M., and Garbini J., “Hole quality in drilling of graphite/bismalemide-titanium stacks,” in 33rd International SAMPE Technical Conference -Advancing Affordable Materials Technology, 2001; pp. 1315–1326.
- Çelik Y. H., Yildiz H., and Özek C., “Effect of cutting parameters on workpiece and tool properties during drilling of Ti-6AI-4V,” 2016; vol. 58, no. 6, pp. 519–525.
CrossRef
- Waqar S., Asad S., Ahmad S., Abbas C. A., and Elahi H., “Effect of drilling parameters on hole quality of Ti-6Al-4V titanium alloy in dry drilling,” Mater. Sci. Forum, 2016; vol. 880, no. December, pp. 33–36.
CrossRef
- Sultan A. Z., Sharif S., and Kurniawan D., “Effect of machining parameters on tool wear and hole quality of AISI 316L stainless steel in conventional drilling,” Procedia Manuf., 2015; vol. 2, no. February, pp. 202–207.
CrossRef
- Abdelhafeez A. M., Soo S. L., Aspinwall D. K., Dowson A., and Arnold D., “A coupled Eulerian Lagrangian finite element model of drilling titanium and aluminium alloys,” SAE Int. J. Aerosp., 2016; vol. 9, no. 1: pp. 198–207.
CrossRef
- Khanna N., “Design of Experiments in Titanium Metal Cutting Research,” in Design of Experiments in Production Engineering, 1st ed., no. November, J. P. Davim, Ed. Aviero, Portugal: Springer, 2016; pp. 165–182.
CrossRef
- Singh H. and Kumar P., “Tool wear optimization in turning operation by Taguchi method,” Indian J. Eng. Mater. Sci., 2004; vol. 11, no. 1: pp. 19–24.

This work is licensed under a Creative Commons Attribution 4.0 International License.

 and T. Pasang2