Variation of Flux and Energy of 14 Mev Neutrons With Variation of Matrix Around A Sample
1Department of Geology and Geophysics, I.I.T., Kharagpur - 721 302, India.
2Department of Physics, University of Poona, Pune - 411 002, India.
3H.V. Desai College, Pune - 411 002, India.
DOI : http://dx.doi.org/10.13005/msri/080223
Download this article as:
![]()
Here a method has been described to study the attenuation of flux and energy of the neutrons passing through different materials. Variation of activity of the irradiated and activated sample by 14 MeV neutrons was observed by changing the matrix around it. The sample was a combination of Aluminium foil and copper powder placed at 0o position (position of maximum flux) and the matrices were Air, Water, Iron, sand and carbon powder.
KEYWORDS:Matrix; Cross-section; 14 MeV neutrons; Activation method; Neutron flux; Neutron energy
Introduction
The 14 MeV neutron generator1 used for the present work generates neutrons of energy 14.77 MeV and has a flux of 108 n/cm2/sec. When a sample is irradiated then the induced activity 2 in the sample is
A=N σ F
Where A, N, σ and F denote activity induced in the irradiated sample, the neutron flux, cross-section of the reaction through which activity is induced and flux of the neutrons respectively.
Now, if two samples 1 and 2 are irradiated simultaneously then the activity induced will be
A1=N1σ1F and A2=N2σ2F
F being same for both because of simultaneous irradiation. Taking the ratio of the two activities, we get
A1/A2=Kσ1/σ2
Where K=N1/N2 is constant for constant weights of sample 1 and 2. A1/A2 is constant when σ1/σ2 is constant. And σ1/σ2 is constant when the energy of the incident neutrons is constant. As with the variation of energy both σ1 and σ2 vary, so does the ratio σ1/σ2. So knowing this ratio the value of the energy E can be found as σ1/σ2 has a constant value for a particular value of E. The actual neutron source is surrounded by an iron water cooling jacket. The results can help to understand the attenuation of the neutron energy and flux and corresponding corrections can be made in the cross-section values obtained from the neutron activation analysis method using these neutrons.
Material and Methods
For observing the variation of flux and energy of neutrons, experiment was done by irradiating two samples simultaneously and varying the matrix around it and noting the variation of activity.
The sample and matrix used along with the concerned data is given in Table 1 and 2.
Table 1: Samples used
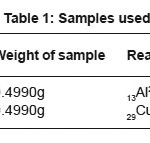 Click on image to enlarge |
Table 2: Matrices used
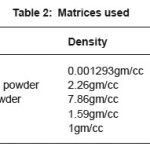 Click on image to enlarge |
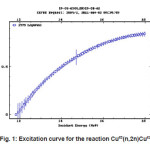
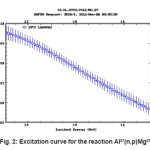
The excitation curves3, 4 are shown in figures 1 and 2. The samples taken together, Copper in powder form and Aluminium as foil within a polythene bag were irradiated with different matrices around it one by one. The time of irradiation, cooling and counting were 10, 2 and 10 minutes respectively. These two samples were taken because of the following reasons:
Easily available
Comparable half life5 of the products allowed to take same irradiation time, that is, around 10 minutes.
Excitation curve shows that in the energy region concerned (12-15 MeV), the slope is different (for copper it is increasing and for aluminium it is decreasing) and so σ1/σ2 varies with energy or we can say d(σ1/σ2) /dE is high and easily noticeable even for small energy change.
Figure 1: Excitation curve for the reaction Cu63(n,2n)Cu62
 Click on image to enlarge |
Figure 2: Excitation curve for the reaction Al27(n,p)Mg27
 Click on image to enlarge |
Results and Discussion
The ratio K of number of atoms of Copper to number of atoms of aluminium, that is, NAl/NCu has a value of 0.34. And as such the cross-section ratio is given as
σCu/σA l = (0. 34)*(ACu / AAl)
Where ACu / AAl is the activity ratio of copper to aluminium.The value of sCu/sA l gives the value of energy of the neutrons.The variation of flux and energy of the neutrons with variation of matrix around the sample as obtained are shown in Table 3.
Table 3: Variation of neutron energy with matrices
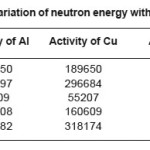 Click on image to enlarge |
The maximum variation of neutron flux and energy is for carbon matrix. And the least variation is for iron powder.
Acknowledgements
I am thankful to the Council of Scientific and Industrial Research and Department of Science and Technology for their financial support.
References
- V.N. Bhoraskar, Ind. J. Pure and Appl. Phys.,27: 648, (1989).
- L.F. Curtiss, An introduction to neutron physics, D. Van Nostrand Company, Inc., Princeton, New Jersey, (1959) .
- Technical report series no.273, Handbook on nuclear activation data by international atomic energy agency.
- EXFOR Nuclear Reaction Data, http:// www.nds.iaea.org/exfor
- C.M. Lederer, J.M. Hollander, and I. Perlman, Table of Isotopes, John Wiley and. Sons, New York (1967).
Accepted on: 18 Nov 2011


![]()
![]()
![]()
![]()