Spectroscopic Studies on Films of Lead Nitrate Doped Polyvinyl Alcohol – Polyvinyl Pyrrolidone Blend
Preeti B. Hammannavar and Blaise Lobo*
Department of Physics, Karnatak University’s Karnatak Science College, Dharwad 580 001, Karnataka, India
Corresponding author Email: blaise.lobo@gmail.com
DOI : http://dx.doi.org/10.13005/msri/150107
Download this article as:
![]()
Films of polyvinyl alcohol (PVA) – polyvinyl pyrrolidone (PVP) blend doped with lead nitrate (Pb(NO3)2) were prepared by solution casting method, with doping level (DL) of Pb(NO3)2 in PVA – PVP polymeric blend varying from 2.7 up to 50.5 wt%. The prepared films were characterized using UV-Visible spectroscopy, fluorescence (or photo- luminescence) spectroscopy, FTIR and Raman spectroscopy. Parameters like optical band gaps due to indirect allowed transition (IAT) and direct allowed transition (DAT), as well as the activation energy (Ea) for optical transitions are extracted from the UV- Visible (or optical) spectra of these films. Objective of the FTIR, Raman and Fluorescence spectroscopic study is to understand the molecular chemical changes in PVA and PVP caused by the dopant (Pb(NO3)2). There is an enhancement of fluorescence intensity at DLs of 2.7 wt%, and at DL 7.6 wt%, the fluorescence intensity decreases (quenching). PVP acts as a capping agent for the dopant species, and is considered to be responsible for changes in fluorescence intensity. Signature of nitrate ion (NO3-) vibration is observed at wavenumber 1037 cm-1 in Raman spectra, and in the FTIR spectra, the NO3- vibration is seen at the wavenumber equal to 1380 cm-1.
KEYWORDS:Direct allowed transition; Doping; Raman shift; FTIR assignments; Indirect allowed transition; Lead Nitrate; PVA -PVP blend; UV-Visible spectroscopy
Introduction
Polymer composites have drawn the attention of researchers due to their potential applications in different areas.1 Polymer composites having lead (Pb) salts as a component are important for primary and secondary protection from gamma photons and X-rays, when a shielding material is required to prevent the effect of harmful radiation on personnel, as well as other users and materials (or equipment).2,3 Research investigations reveal that polymer composites are dual purpose shielding materials, considering the partnership of hydrogen rich polymer for slowing down neutrons4 and the metallic additives (for attenuating gamma photons). Hence, a polymer composite with high atomic number (Z) component is considered as a potentially good solution for the radiation shielding problem. Considering all the high – Z components or elements commonly used for shielding applications, Pb is commonly used for gamma shielding applications, because of its availability and cost effectiveness in comparison with other metals.5 Keeping this in mind, lead nitrate (Pb(NO3)2) was used to dope the selected polymeric blend of polyvinyl alcohol (PVA) and polyvinyl pyrrolidone (PVP).
PVA is a semi-crystalline polyhydric alcohol, which is soluble in water. Due to its several interesting physical properties, PVA (un-doped as well as doped with inorganic salts) has been studied in detail. It has many industrial and technical applications, including those in biochemical and medical fields.6 A unique feature of semi-crystalline PVA is the presence of crystalline and amorphous regions, which results from crystalline -amorphous interfacial effects, the presence of inter-molecular and intra-molecular hydrogen bonding. Boundary of the crystalline and amorphous regions is found to have portions with an intermediate degree of ordering, which complicates the microstructure, producing several crystalline and amorphous phases.7 The doping of PVA films with suitable chemical agents results in a material having a strong dependence of properties on donor-acceptor mechanism. Commonly, PVA is a poor electric conductor; only on doping or adding suitable filler (say, an inorganic salt), PVA can inherit an improved electrical conductivity. Along with complex formation, the physical interactions between polymer chains and dopant (or filler) via hydrogen bonding with hydroxyl groups is noticed in doped PVA.8-13
PVP is a water soluble polymer. It is hygroscopic in nature, with properties like adhesiveness, dye complexing ability, film forming nature and behavior as a protective colloid.14 Due to its wide range of applications in medical domain and a structure which is similar to that of proteins, it is interesting to researchers from a medical (and biological) point of view.15 The peptide bond in lactum ring results in presence of highly polar side groups in PVP. The presence of rigid pyrrolidone group in PVP results in its amorphous nature. Also, PVP doped with an inorganic salt (cobalt chloride) and iodine can be used as a humidity sensor.16
The carbonyl group of PVP interacts through hydrogen bonding with the hydroxyl group of PVA, which results in the good miscibility of PVA-PVP blends.17-19 In fact, interesting properties result from the formation of polymer blends, with modified properties, which combine the features of both constituent polymers. Hydrogen bonding also plays an important role for the solubility of both PVA and PVP in water. In medicine, PVA-PVP blend has application as a skin dressing component, and as membranes. Doped films of polymeric blends with different inorganic salts20-23 have gained importance due to their modified properties and potential multi-functional applications.
Experimental
Sample Preparation and characterization
The films of PVA-PVP blend doped with Pb(NO3)2, in the range (doping level) starting from 2.7 up to 50.5 wt% were prepared from aqueous solution, by solution casting technique. A standard aqueous solution of Pb(NO3)2 was prepared, and separately, PVA-PVP blend solutions (in distilled water) were prepared in different beakers. Three grams of PVA granules and three grams of PVP powder were taken in each beaker, and after mixing them, 100 ml of distilled water was added, followed by stirring continuously using a magnetic stirrer. Different volumes (in ml) of a standard lead nitrate (aqueous) solution were then added to each beaker, containing identically prepared, aqueous PVA-PVP solution. The mixture was stirred continuously for three hours. Then, the apparently homogeneous mixture contained in each beaker was dried on glass, in an air- cooled, temperature controlled oven maintained at 35°C. After one week, the dried films were carefully removed from the glass substrate, and stored in a desiccator, for further characterization. The films of Pb(NO3)2 doped PVA-PVP blend have been studied using UV-Visible, fluorescence spectroscopy, FTIR and Raman spectroscopic techniques. The optical (UV-Visible) spectra were quantitatively analyzed, in order to extract information regarding the nature of optical transitions and the corresponding band gaps (Eg). FTIR and Raman spectra were used to understand the molecular chemical changes in PVA and PVP, caused by the dopant (Pb(NO3)2).
Instrumentation and Analysis
Hitachi U 3310 UV-Vis-NIR spectrometer was used in wavelength range 200 – 800 nm for recording the optical absorption (UV-Vis-NIR) spectra. Details about the procedure adopted for analyzing optical spectra are elaborated by us, elsewhere.24,25
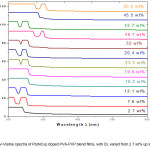
UV- Visible (Optical) Spectrum of a sample is a plot of Absorbance (A) versus Wavelength (λ). The Absorbance of the sample is given by equation 1. The UV-Visible spectra of Pb(NO3)2 doped PVA-PVP blend films are shown in Fig.1.
In equation 1, I and Io are the transmitted and incident light intensities respectively at a particular wavelength of incident electromagnetic radiation. The absorption coefficient α is obtained using equation 2.

In equation 2, d is the thickness of the polymer film, expressed in centimeter (cm).
The absorbance edges (rising and falling edges) of each absorbance peak in the UV-Visible spectra of Pb(NO3)2 doped PVA-PVP blend (sample) is linearly fit, and the x-intercept value (that is, wavelength, , corresponding to the absorption edge ), in each case, is determined using equation 3. See Figure 2a and Figure 2b for the illustrative diagrams.
The energy of incident electromagnetic radiation (photon) which is absorbed by the sample to cause an electronic transition from highest occupied molecular orbital (HOMO) to lowest unoccupied molecular orbital (LUMO) or other intermediate energy levels is given by equation 4.
In equation 4, h denotes the Planck’s constant and c is the velocity of electromagnetic radiation in vacuum.
The activation energy (Ea or Eg) for optical transition is calculated using equation 5, wherein, the value of wavelength (λg) corresponding to absorption edge is substituted in nanometres (nm), to obtain the value of Eg in electron volts (eV).

Table 1 lists the values of Ea, for films of Pb(NO3)2 doped PVA-PVP blend, with doping level (DL) varying from 2.7 up to 50.5 wt%. The Absorption coefficient obeys the well – known Mott Davis model.
![]()
In equation 6, B is the disorder parameter, and Eg1 is the optical energy band gap. The value of m is 1/2, 3/2, 2 and 1/3 for direct allowed transition, direct forbidden transition, indirect allowed transition and indirect forbidden transition, respectively. Taking m = 2, a plot of (αhν)1/2 Vs hν is obtained, and is found to give the best fit, for Pb(NO3)2 doped PVA-PVP blend films. The linear fit, in the high absorption region can be used to obtain the optical band gap for indirect allowed transitions (IAT) in k-space, denoted by EIAT (= Eg1 of the material for IAT). It was observed that the absorption edge gives a good fit for both indirect allowed transitions and direct allowed transitions in k-space. In equation 6, taking m = 1/2, a plot of (αhν)2 Vs hν is obtained, and is also found to give a good fit, for films of Pb(NO3)2 doped PVA-PVP blend. The linear fit, in the high absorption region can be used to obtain the optical band gap for direct allowed transitions (DAT) , denoted by EDAT (= Eg1 of the material for DAT).
Fluorescence Spectra of the composite films have been recorded with F-7000 FL spectrophotometer, in the wavelength range 200-800nm. NXR FT-Raman module spectrometer, at 4 cm-1 resolution, was used to acquire Raman spectra of the Pb(NO3)2 filled PVA-PVP composite films, in the wavenumber range 100-3750 cm-1.
FTIR spectra of Pb(NO3)2 filled PVA-PVP composite were recorded in the wavenumber range 400-4000 cm-1, using NICOLET 6700 FTIR Spectrometer, following the potassium bromide (KBr) pellet method.
Results and Discussions
UV-Visible Studies
The UV-Visible spectra of films of Pb(NO3)2 doped PVA-PVP blend are analysed to yield the optical band gaps due to indirect allowed transition (IAT) and direct allowed transition (DAT), as well as the activation energy (Ea or Eg) for optical transitions (see the ‘instrumentation and analysis’ section, for details of UV – Visible spectral analysis procedure). The optical band-gap for inter-band transition is 4.8 eV for film with doping level (DL) equal to 2.7 wt% (concentration of Pb(NO3)2 in PVA-PVP blend, expressed in weight percentage (wt%)). The band gap increases to 5.4 eV, at 12 wt% DL and then decreases on further doping, to a low of 4.2 eV at 45.2 wt% DL. The optical spectra show multiple transitions at intermediate doping levels, with activation energies observed between 3.2 eV and 3.4 eV, due to additional energy bands created by the dopant species (Pb(NO3)2) in the HOMO-LUMO gap in the band-structure of PVA – PVP blend.
Figure 1: UV-Visible spectra of Pb(NO3)2 doped PVA-PVP blend films, with DL varied from 2.7 wt% up to 50.5 wt%.
 Click on image to enlarge |
Table 1: Activation energy (Ea or Eg) for optical transitions, for films of Pb(NO3)2 doped PVA-PVP blend, with doping level (DL) varying from 2.7 up to 50.5 wt%.
|
Doping Level DL (wt%) |
Ea1 (eV) |
Ea2 (eV) |
Ea3 (eV) |
Ea4 (eV) |
|
0.0 |
4.1 |
2.5 |
2.2 |
— |
|
2.7 |
4.3 |
3.3 |
1.9 |
— |
|
7.6 |
5.6 |
5.5 |
4.8 |
— |
|
12.1 |
5.4 |
5.5 |
4.8 |
2.2 |
|
16.2 |
4.7 |
3.2 |
— |
3.9 |
|
19.8 |
4.7 |
3.7 |
— |
3.2 |
|
23.3 |
5.2 |
5.4 |
4.7 |
3.3 |
|
26.4 |
5.3 |
5.3 |
4.8 |
4.3 |
|
32.0 |
5.1 |
5.4 |
4.7 |
3.4 |
|
36.4 |
4.4 |
4.3 |
4.0 |
3.2 |
|
42.7 |
5.2 |
5.3 |
4.7 |
3.2 |
|
45.5 |
4.2 |
3.5 |
— |
1.5 |
|
50.5 |
4.4 |
3.3 |
4.0 |
2.0 |
Figure 2: Determination of activation energies (Eg) for optical transitions from UV-Visible spectra of Pb(NO3)2 doped PVA-PVP blend films with DL of a) 7.6 wt% and b) 50.5 wt%. Ratio of the negative Y – intercept to the slope gives value of wavelength corresponding to the absorption edge (λg or λi; I = 1,2,3), from which Eg can be determined using equation 5
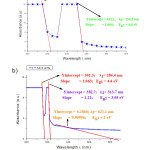 Click on image to enlarge |
Table 2: Optical band gaps (Ed and EIaT) corresponding to direct allowed transition (DAT) and indirect allowed transition (IAT) in Pb(NO3)2 doped PVA-PVP blend films, with doping level (DL) varying from 2.7 up to 50.5 wt%.
|
DL (wt%) |
Ed1 (eV) |
Ed2 (eV) |
Ed3 (eV) |
EIaT1 (eV) |
EIaT2 (eV) |
EIaT3 (eV) |
|
2.7 |
5.03 |
4.0 |
— |
0.9 |
— |
— |
|
7.6 |
5.6 |
4.9 |
— |
5.4 |
— |
— |
|
12.1 |
5.4 |
4.7 |
— |
5.2 |
4.6 |
— |
|
16.4 |
— |
4.7 |
— |
4.6 |
2.1 |
— |
|
19.8 |
— |
4.7 |
— |
4.5 |
1.6 |
— |
|
23.3 |
5.3 |
4.7 |
— |
5.1 |
4.5 |
— |
|
26.4 |
5.4 |
4.8 |
— |
5.0 |
4.1 |
2.5 |
|
32.0 |
5.2 |
4.6 |
— |
4.9 |
4.4 |
2.3 |
|
36.7 |
— |
4.4 |
3.9 |
4.2 |
3.9 |
— |
|
42.7 |
5.2 |
4.6 |
— |
4.9 |
4.5 |
0.6 |
|
45.5 |
— |
4.3 |
3.9 |
4.2 |
2.9 |
— |
|
50.5 |
— |
4.4 |
3.9 |
4.3 |
3.8 |
1.2 |
Fluorescence Spectroscopy
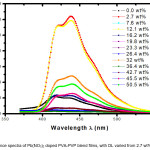
The emission (fluorescence or photo-luminescence) spectra of Pb(NO3)2 filled PVA-PVP blend films are shown in figure 2. The excitation wavelength was fixed at 350 nm for all the samples. Two emission peaks are observed at 412 nm and 438 nm, along with a just resolved peak at 468 nm. Multi-peak Gaussian fitting method was used to identify the peaks; this analysis fetched important parameters, namely, width of the emission peak, its height and area under the peak (values are listed in table 3). The presence of carbonyl (C=O) group in both PVA (due to un-hydrolyzed acetyl groups) and PVP, enables transfer of electron to the dopant ion (Pb2+). The fluorescence peak at DL of 2.7 wt% shows an enhancement in fluorescence intensity, due to formation of micro-crystallites of the dopant species. In the photo-luminescence (PL) spectra, for the film with DL of 7.6 wt% the fluorescence intensity reduces, whereas the fluorescence intensity increases once again at DL 12.1 wt%. For films with DL varying from 19.8 wt% up to 42.7 wt%, there is lot of variation in fluorescence intensity wherein the PVP acts as capping agent, as confirmed from FTIR spectra. As we move on to higher doping regions, it is noticed that there is quenching of emission (or PL peak) at 438 nm and fluorescence at wavelength of 412 nm is found to have enhanced.
Figure 3: Fluorescence spectra of Pb(NO3)2 doped PVA-PVP blend films, with DL varied from 2.7 wt% up to 50.5 wt%.
 Click on image to enlarge |
Table 3: The table shows area under the emission (fluorescence) peak, its width, centre and height, as obtained from Gaussian fitting of the PL spectra of Pb(NO3)2 doped PVA-PVP blend films, with DL varied from 2.7 up to 50.5 wt%.
|
Doping Level, DL (wt%) |
Emission Band No. |
Area |
Center p (nm) |
Peak energy, Ep (eV) |
FWHM λ (nm) |
Width of energy band, E (eV) |
Height (Counts) |
|
0.0 |
1 |
13039 |
432 |
2.9 |
82.0 |
15.1 |
127 |
|
2 |
1149 |
413 |
3 |
13.8 |
89.9 |
66 |
|
|
3 |
2367 |
433 |
2.9 |
29.8 |
41.6 |
63 |
|
|
2.7 |
1 |
14309 |
416 |
2.9 |
16.34 |
75.9 |
699 |
|
2 |
17435 |
436 |
2.8 |
21.47 |
57.8 |
648 |
|
|
3 |
44064 |
455 |
2.8 |
51.14 |
24.2 |
687 |
|
|
7.6 |
1 |
849 |
415 |
2.9 |
17.88 |
69.4 |
38 |
|
2 |
438 |
437 |
2.8 |
17.34 |
71.5 |
20 |
|
|
3 |
2370 |
451 |
2.7 |
52.03 |
23.8 |
36 |
|
|
12.1 |
1 |
14346 |
416 |
2.9 |
16.5 |
75.2 |
692 |
|
2 |
17677 |
436 |
2.8 |
22.5 |
55.1 |
628 |
|
|
3 |
41872 |
454 |
2.7 |
52.1 |
23.8 |
642 |
|
|
16.2 |
1 |
3279 |
415 |
2.9 |
17.8 |
69.7 |
147 |
|
2 |
2129 |
436 |
2.8 |
19.2 |
64.6 |
88 |
|
|
3 |
8341 |
452 |
2.7 |
52.3 |
23.7 |
128 |
|
|
19.8 |
1 |
1108 |
415 |
2.9 |
19.8 |
62.6 |
45 |
|
2 |
1038 |
438 |
2.8 |
21.8 |
56.9 |
38 |
|
|
3 |
776 |
464 |
2.7 |
27.9 |
44.4 |
22 |
|
|
23.3 |
1 |
242 |
415 |
2.9 |
17.8 |
69.7 |
11 |
|
2 |
366 |
438 |
2.8 |
28.4 |
43.7 |
10 |
|
|
3 |
126 |
468 |
2.6 |
18.5 |
67.0 |
6 |
|
|
26.4 |
1 |
53 |
438 |
2.8 |
13.1 |
94.7 |
3 |
|
2 |
231 |
416 |
2.9 |
18.8 |
65.9 |
10 |
|
|
32.0 |
1 |
4948 |
417 |
2.9 |
16.5 |
75.2 |
240 |
|
2 |
7117 |
437 |
2.8 |
22.6 |
54.9 |
251 |
|
|
3 |
18138 |
456 |
2.7 |
53.4 |
23.2 |
271 |
|
|
36.7 |
1 |
250 |
416 |
2.9 |
0.3 |
4133.3 |
674 |
|
2 |
4 |
408 |
3 |
0.5 |
2480 |
7 |
|
|
42.7 |
1 |
969 |
417 |
2.9 |
18.3 |
67.8 |
42 |
|
2 |
912 |
438 |
2.8 |
20.9 |
59.3 |
35 |
|
|
3 |
1069 |
462 |
2.6 |
35.3 |
35.1 |
24 |
|
|
45.5 |
1 |
2839 |
417 |
2.9 |
16.7 |
74.3 |
135 |
|
2 |
37776 |
438 |
2.8 |
22.3 |
55.6 |
135 |
|
|
3 |
8132 |
456 |
2.7 |
50.1 |
24.8 |
130 |
|
|
50.5 |
1 |
4235 |
417 |
2.9 |
16.6 |
74.7 |
204 |
|
2 |
5640 |
438 |
2.8 |
22.6 |
55.6 |
199 |
|
|
3 |
12532 |
457 |
2.7 |
51.4 |
24.1 |
194 |
It is well known that radiative energy transfer and non-radiative energy transfer are two ways to transfer energy, after molecules of the sample (PVA and PVP) are excited on absorption of incident electromagnetic energy (electronic transition; HOMO to LUMO). The processes are illustrated by the Jablonskii diagram, commonly used in the understanding of fluorescence spectroscopy. In radiative energy transfer, the de-excitation of fluorophore (which loses its energy) from excited state to ground state takes place by ejecting a photon (emission of electromagnetic radiation).26 There is an enhancement of fluorescence intensity at DLs of 2.7 wt%, and at DL 7.6 wt%, the fluorescence intensity decreases (quenching).
Quenching of the fluorophore in Pb(NO3)2 doped PVA-PVP blend films could due to transfer of electrons from molecules of the host polymer matrix (PVA and PVP) to dopant ions (Pb2+), resulting in formation of Pb (reduction); hence, these electrons are not available for the excitation and de-excitation processes (during PL study).
Figure 4: Variation of peak of the emission (or PL) spectra of Pb(NO3)2 doped PVA-PVP films, at three different emission peak wavelengths (λi ; i = 1, 2 and 3), relative to DL
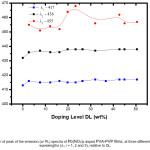 Click on image to enlarge |
Raman Spectroscopy
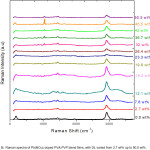
Raman spectra ofPb(NO3)2 doped PVA-PVP films show dominant peaks at 2913 cm-1 and 1437 cm-1 due to CH2 stretching and CH2 deformation. The signature of the nitrate ion (NO3–) is seen as a sharp peak (with increasing intensity, with increase in DL), with Raman shift lying between 1038 cm-1 and 1045 cm-1 (as shown in fig 5) for filler levels varying from 26 up to 45 wt%, suggesting phase separation at these higher dopant concentrations.
CH2 and C=O stretch, scissor
In the Raman spectra of Pb(NO3)2 doped PVA – PVP blend films, a sharp peak in the wavenumber range varying from 2921 cm-1 up to 2922 cm-1 is attributed to CH2 group of PVP. The corresponding wavenumber does not change much on increasing the DL of Pb(NO3)2 in PVA – PVP from 2.7 up to 50.5 wt%, but the intensity of this peak increases on increasing from 2.7 wt% to 16.2 wt%, and on further addition of Pb(NO3)2 in the polymer matrix (PVA – PVP), the intensity decreases. As PVA and PVP are involved in the formation of charge transfer complex with the dopant ion (Pb2+) on interaction with carbonyl (C=O) groups, the prominent peak in the wavenumber range varying from 1629 cm-1 to 1655 cm-1 is attributed to C=O group of un-hydrolyzed parts of PVA (acetyl group) and the C=O group of PVP; the changescan be attributed to the change in C=O to C-O group on interaction of Pb2+ with C-O‾ (see reaction scheme in figure 7). The presence of a band around 1437 cm-1isassigned to CH2 scissor vibration.
C-C chain, ring and breathing
Three different peaks at 751 cm-1, 849 cm-1 and 927 cm-1 are due to C-C chain in polymer backbone. In doped polymers, the peak frequency varies, as indicated in table 4. Due to inter/intra molecular interaction between dopant ions (Pb2+ and NO3‾) with polymeric molecules (PVA and PVP), the shift in these wavenumbers are observed.
NO3‾ ion vibration
Peaks ranging from 1037 cm-1 to 1046 cm-1 confirms the presence of NO3‾ group in the prepared Pb(NO3)2 filled PVA-PVP composite.
Table 4: Raman peak assignments of Pb(NO3)2 doped PVA-PVP blend films, with DL varied from 2.7 wt% up to 50.5 wt%.
|
Peak Wavenumber (cm-1) |
Raman Assignments |
Peak Raman shifts at differentDLs ( cm-1) |
|
292 02912 |
ν s CH2 group of PVP |
2912-2918 |
|
2191 |
ν s (CH2) |
2118-2203 |
|
1661 |
ν s (C=O) |
1629-1658 |
|
1436 |
δ(CH2), δ (OH) Bending |
1437-1442 |
|
1226 |
C-C structure of γω(CH2) |
1226-1234 |
|
1115 |
ν (C=O); δ (CO+OH) |
1099-1106 |
|
1360 |
COO stretch |
1311-1373 |
|
1045 |
NO3‾ ion vibration |
1036-1046 |
|
927 |
γ (C-O); δ (CO+OH) |
921-938 |
|
849 |
ν (C-C) , CCH aliphatic |
845-850 |
|
751 |
ν (C-C) (C=O) deformation |
744-748 |
Figure 5: Raman spectra of Pb(NO3)2 doped PVA-PVP blend films, with DL varied from 2.7 wt% up to 50.5 wt%
 Click on image to enlarge |
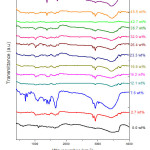
FTIR Spectroscopy
Modes of stretching and vibration
FTIR spectra show the expected absorption bands due to PVA/PVP blend, and the nitrate ion (NO3–) absorption at 1385 cm-1 for DLs beyond 23 wt%, which increases in intensity with increased (Pb(NO3)2) content. A study of FTIR spectra of Pb(NO3)2 doped PVA-PVP films reveals two modes of stretching: symmetric stretching and asymmetric stretching. Generally, asymmetric stretching occurs at higher frequencies when compared to symmetric stretching. In literature, the origin of infra-red bands is identified by the terms: scissoring, rocking, wagging and twisting, for different types of vibration. 27
O-H stretch
The inter – molecular and intra – molecular hydrogen bond interaction with hydroxyl groups of PVA results in a broad absorption band, peaking at wavenumber around 3425 cm-1 in un – doped PVA-PVP blend film, and in Pb(NO3)2 doped PVA – PVP blend films, it is seen at 3425-3445 cm-1. This band is identified as O-H stretching vibration.
CH2 stretch region
Interpretation of FTIR peak in the CH2 stretch region, from 2960 cm-1 up to 2854 cm-1 is a more useful and the most difficult part of FTIR spectral assignment. Usually, only one band 2890 cm-1 is observed due to tertiary C-H bonding (weak C-H stretch absorption). The methylene hydrogen gives rise to two C-H stretching bands representing symmetric and asymmetric stretching modes. Due to these inter/intra molecular interactions, the 2890 cm-1 absorption band splits into two bands at 2922 cm-1 and 2854 cm-1. The CH2 asymmetric chain stretching observed in Pb(NO3)2 doped PVA – PVP blend films shifts from 2922 cm-1 up to 2924 cm-1 due to structural modifications in the polymer (PVA-PVP) matrix, caused by the dopant ions. The peak in wavenumber region, from 2841 cm-1 up to 2857 cm-1 is assigned to CH2 symmetric stretching mode.
C=O Stretching vibrations
A band near 1728 cm-1 to 1741 cm-1 occurs due to carbonyl stretching of acetyl group of partially hydrolysed PVA. A weak peak around 1730 cm-1 observed in the FTIR spectra can be subjected to interactions between dopant (Pb(NO3)2) ions with the C=O group present in unhydrolysed parts of PVA (acetyl groups). Interaction of PVP with ions of the dopant is confirmed by dominant peak at 1656 cm-1,which has a capacity to transfer an electron from C-O– to Pb2+, resulting in formation of Pb. These Pb atoms could then agglomerate to form dopant nano-structures in Pb(NO3)2 doped PVA-PVP blend films. Formation of charge transfer complex shows variation in wavenumber of this vibration.
C-N stretch and N-H bending
Strong bending vibrational bands are observed in the wavenumber region, at 1627 cm-1 and 1586 cm-1, whichcan be assigned to C-N stretch and N-H bending, respectively.
NO2– ion vibration
The aliphatic NO2– group shows two bands, one at wavenumber 1550 cm-1 (asymmetric stretch) and the other at 1380 cm-1 (symmetric stretch).
Table 5: FTIR peak assignments of Pb(NO3)2 doped PVA-PVP blend films, in comparison to that of un-doped PVA-PVP blend.
|
FTIR Peak Assignments |
Peak Frequency (cm-1) for Pure (un-doped) PVA-PVP |
Peak Frequency (cm-1) for Pb(NO3)2 doped PVA/PVP |
|
O-H stretching |
3425 |
3425-3445 |
|
Sym CH2 stretch, chain |
2923 |
2922-2924 |
|
C-H Stretch |
2858 |
2849-2855 |
|
C=O stretching (acetyl group) of PVA |
1735 |
1733 |
|
C=O stretching (s) of PVP |
1650 |
1655-1657 |
|
C-N stretch |
– |
1262-1263 |
|
NO3 – vibration |
1380 |
1383-1384 |
Figure 6: FTIR spectra of Pb(NO3)2 doped PVA-PVP blend films, with DL varied from 2.7 wt% up to 50.5 wt%
 Click on image to enlarge |
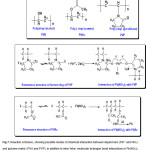
Figure 7: Reaction schemes, showing possible modes of chemical interaction between dopant ions (Pb2+ and NO3–) and polymer matrix (PVA and PVP), in addition to inter/ intra- molecular hydrogen bond interactions in Pb(NO3)2 doped PVA-PVP blend films
 Click on image to enlarge |
Conclusions
Pb(NO3)2 doped PVA-PVP blend films were prepared by solution casting method and characterised by various spectroscopic techniques. UV-Visible spectra reveal that the activation energy of inter-band transitions increases with increase in Pb(NO3)2 concentrations from 2.7 wt% to 12.1 wt%, and on further doping, up to 50.2 wt%, there is a decrease in activation energy. Fluorescence spectroscopy shows lot of variations in moderate filling levels. Both enhancement and quenching effect are observed in the PL spectra at low doping levels. The study of vibrational frequencies of different chemical groups in Pb(NO3)2 doped PVA-PVP blend films using Raman and FTIR spectroscopy is presented in this paper. In Raman and FTIR studies, the nitrate ion is manifested as an absorption peak between 1038 cm-1 – 1045 cm-1 and 1385 cm-1, respectively. Chemical modifications in the structure of PVA and PVP caused by Pb(NO3)2 are investigated using Raman and FTIR spectroscopy, by exploring possible inter/intra molecular interactions via reactive functional groups and possibly resulting in formation of co-ordination complexes between Pb2+ and molecules in the host polymer matrix.
Acknowledgements
Authors have used facilities at USIC, Karnatak University Dharwad (KUD), to record the UV-Visible, FTIR, fluorescence and Raman spectra. One of the authors (PBH) is thankful to KUD, for UPE fellowship.
Funding Source: The author declares that the funding is done by author only.
Conflict of interest: The author(s) declare(s) that there is no conflict of interests regarding the publication of this article.
References
- Tan B. K., Ching Y. C., Poh S. C., Abdullah L. C., Gan S. N. Polymers. 2015;7:2205.
CrossRef - Srinivasan K., Samuel E. J. J. J. Med. Phys. 2017;42:273.
CrossRef - Harish V., Nagaiah N., Harishkumar H. G. Indian J. Pure Appl. Phys. 2012;50:847.
- Jumpee C., Wongsawaeng D. J. Phys: Conf. Ser. 2015;611:012019.
CrossRef - Kucuk M. N., Cakir N. A., Isitman J. R.,Dosim P. 2012;153:127.
CrossRef - Baker M. I., Walsh S. P., Schwartz Z., Boyan B. D. J. Biomed. Mater. Res. 2012;100:1451.
CrossRef - Lobo B., Ranganath M. R., Ravi Chandran T. S. G., Rao G. V., Ravindrachary V., Gopal S. Phys. Rev. 1999;59:13693.
CrossRef - Zidan H. M. J Appl. Polym. Sci. 2003;88:1115.
CrossRef - De-Huang W. Thin Solid Films. 1996;288:254.
CrossRef - El-Shahawy M. A. Polym. Int. 2003;52:1919.
CrossRef - Tawansi A., El-Khodary A., Abdelnaby M. M. J. Curr. Appl. Phys. 2005;5:572.
CrossRef - Selim S. M., Seoudi R., Shabaka A. A. Mater Lett. 2005;59:2650.
CrossRef - Bhajantri R. F., Ravindrachary V., Harisha A., Crasta V. Polymer. 2006;47:3591.
CrossRef - Haaf F., Sanner A., Straub F. Polym. J. 1985;17:143.
CrossRef - Benamer S., Mahlous M., Boukrif A., Mansouri B., Youcef S. L. Nucl. Instrum. Meth. 2006;248:284.
CrossRef - Queiroz A. A. A. D., Soares D. T. A. W., Trzesnak P., Abraham G. A. J. Polym. Sci. B. Polym. Phys. 2001;39:459.
CrossRef - Cassu S. N., Felisberti M. I. Polymer. 1997;38:3907.
CrossRef - Sedlarik V., Saha N., Kuritha I., Saha P. Polym. Compos. 2006;27:147.
- Elashmawi I. S., Baieth H. E. A. Curr. Appl. Phy. 2012;12:141.
CrossRef - Hammannavar P. B., Lobo B., Macromol. Symp. 2017;376:1600198.
CrossRef - Baraker B. M., Lobo. B. Can. J. Phys. 2017;95:738.
CrossRef - Hammannavar P. B., Baraker B. M., Bhajantri R. F., Ravindrachary V., Lobo B. J. Phys. Conf. Ser. 2015;618:012034.
CrossRef - Patil R. V., Ranganath M. R., Lobo B. Int. J. ChemTech Res. 2014;6:1852.
- Lobo B., Ranganath M. R. Solid State Physics (India). 2009;54:479.
- Baraker B. M., Hammannavar P. B., Lobo B. AIP Conf. Proc. 015;1665:070037.
- Sangeeta C. C., Madivanane R., Pouchaname V. Arch. Phys. Res. 2013;4:67.
- Nallaswamy P., Mohan S. Indian J. Pure and Appl. Phys. 2005;43:821.
Accepted on: 24 January 18


![]()
![]()
![]()
![]()