Influence Studies of Doping on FTIR Spectra and Thermogravimetric Analysis of Barium Nitrate Crystals
Vanish H. Tandel
Department of Physics, Veer Narmad South Gujarat University, Surat, Gujarat, 395007
Corresponding author Email: vanish86t@yahoo.in
DOI : http://dx.doi.org/10.13005/msri/150110
Download this article as:
![]()
Pure and Magnesium Nitrate hexahydrate (MgN) doped Barium Nitrate (BaN) crystals were grown by slow evaporation technique. FTIR spectral studies have been carried to identify the presence various functional groups. An FTIR spectrum of grown crystals confirms the presence of ionic bonds in the structure of pure and doped BaN crystals. The influence of MgN doping on FTIR spectra was absorbing frequencies by pure and doped BaN crystals were studied. Thermogravimetric of pure and doped BaN crystals were analysed to characterise thermal stability. Thermal parameters are evaluated using thermogram. The results are presented and discussed in this paper.
KEYWORDS:FTIR spectra; Slaw Evaporation Technique; TGA
Introduction
Growth of crystals with water soluble compound is very efficient in slow evaporation technique. In present study we are grow pure and doped Barium Nitrate (BaN) crystals by slow evaporation technique. Barium Nitrate crystals widely used in optical instruments producing industries. BaN compound has higher decomposition reaction range.1 BaN crystal has crystallized in cubic system.2 Presence of elements in BaN crystals carried out by Energy Dispersive X-ray spectroscopy (EDX) was reported3 with Weight% as Ba(66.85), N(12.13) and O(20.02) together Atomic% as Ba(18.41), N(32.74) and O(47.32). Many researchers have grown materials by Slow Evaporation Technique and adding suitable dopant to modifying such materials physical and chemical properties. Mg(NO3)2.6H2O up to 99.00% purity was taken to make solution as 0.5N, 1.0N, 1.5N with 10 ml double distilled water. This solution is mixed with separated 100 ml super saturated solution of Ba(NO3)2 in beaker and kept for Slow evaporation at ambient temperature. After 5-6 weeks Good quality crystals were formed. The purpose of the present paper is to study the growth of crystals of pure and MgN doped BaN crystals with slow evaporation at ambient temperature. In this research study we have to discuss on the characterization of grown sample by FTIR spectra and Thermogravimetric Analysis (TGA). A FT infrared (FT-IR) spectrometer collects an interferogram of a sample signal from an interferometer to obtain the IR spectrum of sample.4 In TG Analysis, pyro and kinetic studies such as decomposition rate and activation energy are important parameters to determine the reaction mechanism in solid phase.5
Experimental Procedure
Crystal growth by Slaw Evaporation Technique
Purity up to 99.00% salt of Barium Nitrate and Magnesium Nitrate hexahydrate (MgN) used to grow pure and MgN doped Barium Nitrate crystals by slow evaporation technique at ambient temperature. In this technique solution was made with double distilled water and salt of compound. Salt of BaN was added in 300 ml double distilled water in beaker on magnetic stirrer mechanism at room temperature. Solution of BaN salt was stirring by magnetic stirrer mechanism for 2 hours on 1200 rpm. The solubility limit of BaN was 10.35 gm/100ml at room temperature. After making solution it was divide into three part 100 ml/ beaker and add 0.5N, 1.0N and 1.5N solution of MgN made with double distilled water and stirrer well. To keep the solution free from dust and impurities care was taken to cover the beaker for slow evaporation at ambient temperature. After 5-6 weeks Good quality and transparent crystals were grow.
Result and Discussion
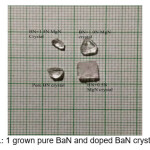
Ancient Slow evaporation technique is very useful to grow crystals which have water soluble compounds.6 Nucleation will take place by evaporating water molecules from super saturated solution at ambient temperature within increasing time period. After 5-6 weeks good quality and transparent crystals were grow displayed in the figure 1.
Figure 1: grown pure BaN and doped BaN crystals
|
|
The infrared spectroscopy is effectively used to identify the functional groups of the samples.7 IR spectroscopies were measures the vibrational energies of molecules and are depend on the absorbance of infrared light. FTIR spectra of BaN and Doped BaN are shown in Fig. 2-6. In the FTIR Spectrum, The absorption frequencies at 728-729 cm-1 are due to the Ba-N contacts.8 and 815-816 cm-1 due to N=O stretching.9 The very sharp band at 1357-1358 cm-1 gives the basic aromatic nitro compound of the crystal; NO2 symmetry stretch.10 The absorption frequency at 1414-1415 cm-1 is appropriate to the C-N Stretch.11 The band at 1775-1776 cm-1 band corresponds to the overtone bands, 2359-2360 cm-1 indicates the NH Stretching modes and the dispersing peaks at 1383.66 shows CH3 symmetric deformation.12 The 2400 and 3433.69 cm-1 could not be identified. FTIR band/peaks and their assignments for BaN crystals are shown in table-1; confirms presence of titled compound’s functional group.
Figure 2: FTIR spectra of Pure BaN crystals
|
|
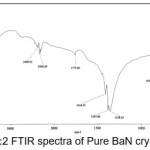
Figure 3: FTIR spectra of BaNMgN0.5
|
|
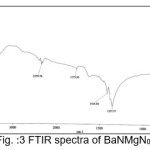
Figure 4: FTIR spectra of BaNMgN1.0
|
|
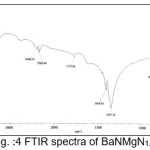
Figure 5: FTIR spectra of BaNMgN1.5
|
|
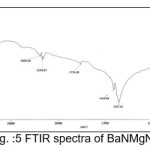
Figure 6: Influenced FTIR spectra of pure and doped BaN crystals
|
|
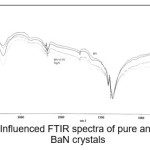
Table 1: FTIR Bands/Peaks and Assignment of pure and doped BaN crystals
|
Wave numbers cm-1 |
Assignment |
|||
|
Pure BaN |
BaN MgN0.5 |
BaN MgN1.0 |
BaN MgN1.5 |
|
|
729.08 |
728.90 |
729.03 |
728.90 |
Ba-N contacts |
|
816.03 |
815.97 |
815.98 |
815.94 |
N=O stretching |
|
1358.42 |
1357.57 |
1357.15 |
1357.53 |
Aromatic Nitro compound |
|
1414.55 |
1414.93 |
1414.81 |
1414.94 |
C-N stretch |
|
1775.80 |
1775.95 |
1775.85 |
1776.09 |
Overtone Bands |
|
2360.29 |
2359.76 |
2360.44 |
2359.87 |
N-H stretching modes |
The temperature of decomposition reaction that are most suitable reaction for the identification and the quantitative determination of content is, however very affected by the material properties and state of the analysis.Thermal analysis is programmed process with specified atmosphere where in sample property is under the systematic review facing time or temperature. Thermal properties of pure BaN and doped BaN crystals were studied out by TGA, which were carried out between 25 ̊C and 910 ̊C with heating rate 10.00 ̊C/min. Thermogravimetric analysis is useful to findings kinetic parameters like as order of reaction, activation energy.Thermal parameters are evaluated from the TGA thermogram pure and doped BaN crystals were shown in figures 7-11
Figure 7: TGA thermogram of Pure BaN
|
|
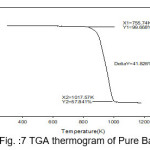
Figure 8: TGA thermogram of BaNMgN0.5
|
|
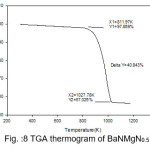
Figure 9: TGA thermogram of BaNMgN1.0
|
|
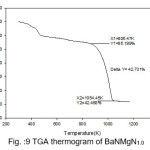
Figure 10: TGA thermogram of BaNMgN1.5
|
|
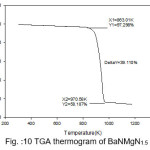
Figure 11: TGA thermogram of Pure and doped BaN crystals
|
|
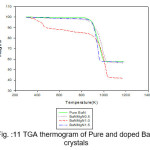
The TGA curves of pure and doped BaN shows a single step average weight loss 41% in the temperature range 750 to 1060 K. This indicates that grown crystals are thermally stable.
Thermal Parameters
Broido method
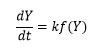
In the Thermogravimetric analysis, the mechanism; rate of reaction may be expressed as the proportion of the actual weight loss to the total weight loss corresponding to the degradation process with temperature13 and from which the activation energy (Ea ) can be calculated by forward integral method.14 In TGA evaluation, the conversion of weight is typically calculated as following equation 1.
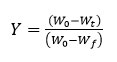
Here, Y denotes the fraction of initial mass not yet decomposed which is equal to: W0 is initial weight of sample, whereas Wt represent current weight and Wf is final weight of sample. By adopting kinetic studies, the conversion rate of isothermal, dY/dt, shows a linear function of the conversion, Y that is written by equation 2.
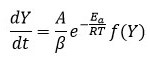
Where f(Y) is the differential expression of kinetic reaction model with function ‘k’; which is rate constant can be described by the Arrhenius expression equation 3 can be given by this way.
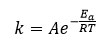
Here ‘A’ represent pre exponential factor (Arrhenius constant) is accepted as independent of temperature, Ea shows activation energy of the degradation reaction with unit (kJ/mol), T is absolute temperature in ‘K’ and R is universal gas constant with value 8.314 J/molK .The combination of equation 2 and 3 gives the following relationship, i.e. equation 4.
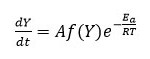
In degradation process, temperature of sample can be changed by constant heating rate ‘β’(dT/dt) under controlled condition. The difference in degree of conversion of weight can be resolve as a function of temperature and determined by time of heating, so rate of reaction can be expressed as equation 5
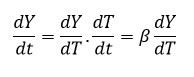
So, the change in weight and temperature can be mentioned as following equation 6
Integral form of from equation 6 initial temperature, to corresponding to a degree of conversion initial temperature T0 to peak temperature Tp can be written as equation 7
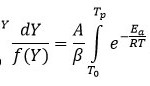
Using this approximation, Broido rearranged the equation 7 and obtained equation 8 as followed
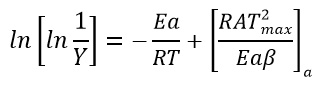
Order of thermal degradation would be taken as first order in Broido’s approximation and calculation are done accordingly.
After obtaining the energy of activation (Ea), from Broido’s method the entropy of activation15 (∆S) can be evaluated using following equation 9
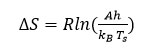
Here, h and kB shows Planck’s constant and Boltzmann constant respectively and Ts peak temperature.
The enthalpy of activation (∆H) and Gibbs free energy16 (∆G) can be determined using the below relationship of equations 10 and 11 respectively.
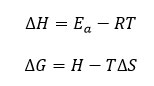
Broido thermo dynamical method has been used for evaluation of thermal parameters. As describes earlier, values of ‘Y’ were calculated at discrete interval from Thermogravimetric curves. These thermal parameters of all pure BaN and BaNMgNx (X=0.5, 1.0, 1.5 normality) will archived by plotting lnln(1/Y) versus 1000/T graph, for major degradation events where significant weight or mass loss is found. Figures 12-15 shows the Broido plot (ln(ln1/Y) Vs 1000/T) for pure BaN and BaNMgNx (X=0.5,1.0,1.5 normality) respectively. The slop obtained from these plots, equal to –Ea/2.303 R . Thus, by obtaining value of energy of activation using equation 9, 10 and 11 one can easily evaluate the ∆S, ∆H and ∆G respectively of pure and doped BaN.
Values of thermal parameters of pure BaN and BaNMgNx (x=0.5, 1.0, 1.5 normality) are shown in table 2
Table 2: Thermal parameters BaN and BaNMgNx (x=0.5, 1.0, 1.5 normality) crystals
|
Grown sample |
Activation energy Ea (kJ/mol)
|
∆S (J/mol K) |
∆H (kJ/mol) |
∆G (kJ/mol) |
|
Pure BaN |
395.39 |
-229.63 |
388.02 |
590.61 |
|
BaNMgN0.5 |
314.87 |
-231.74 |
307.22 |
519.55 |
|
BaNMgN1.0 |
172.66 |
-236.80 |
164.93 |
384.17 |
|
BaNMgN1.5 |
655.32 |
-224.81 |
647.70 |
853.37 |
Figure 12: ln(ln1/Y) Vs 1000/T of Pure BaN
|
|
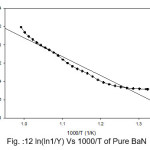
Figure 13: ln(ln1/Y) Vs 1000/T of BaNMgN0.5
|
|
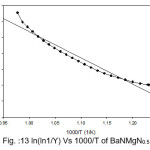
Figure 14: ln(ln1/Y) Vs 1000/T of BaNMgN1.0
|
|
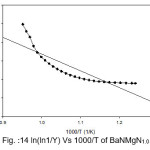
Figure 15: ln(ln1/Y) Vs 1000/T of BaNMgN1.5
|
|
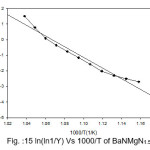
Obtained thermal parameters by Broido method of pure BaN and doped BaN crystals presented in Table:2, shows that amount of doping level increases of MgN in BaN crystals the activation energy first decreases from 395.39 to 314.87 and 172.66 (kJ/mol) along with 0.5 and 1.0 (N) and increase as 655.32 (kJ/mol) at 1.5N, similarly with ∆S, ∆H and ∆G changes with doping level. This can be understand that amount of doping level make effect on thermal parameters of the titled sample. Here the calculated value of ∆S is negative shows the system is getting transferred from disordered to ordered state whereas positive sign of ∆H indicates that system has endothermic reaction with its surrounding.
Conclusion
Successfully grown pure and MgN doped Barium Nitrate crystals by using Slow evaporation technique. Good quality and transparent crystals are grown after 5-6 weeks. Functional groups were found by the FTIR spectra. Very sharp absorbing band at 1357-1358 cm-1 confirms the basic aromatic nitro compound and absorbing band at 728-729 cm-1 due to Ba-N contacts. Influence of MgN dopant shows the absorbing band at 1383.66 cm-1 was disappeared with increasing doped amount in the super saturated BaN solution shows CH3 symmetric deformation peaks merged in FTIR spectra. Thermogravimetric Analysis gives that the Pure and doped BaN crystals are thermally stable and endothermic reaction with its surrounding. Thermal parameters Ea, ∆S, ∆H and ∆G of pure and doped BaN calculated using Broido method.
Acknowledgement
Author thanks to Head of department of physics, Veer Narmad South Gujarat University for gave us necessary facilities and Centre of Excellence of Vapi for FTIR and TGA characterisation.
References
- Jawed M. d., Shail A. U. Processing and Application of Ceramics. 2015;9(4):181-185.
- Vanish H. T., Patel I. B and Anil S. P. IJRCS. 20171(08).
- Vanish H. T.,Patel I. B., Patel H. IJSART. 2016;2(9).
- Shan –Yang L., Mei-Jane L., When -Ting c. Spectroscopy. IOS Press. 2007;21:1-30
- Paresh V. D., Kishor B. S., Navinchandra G. S., Navneet R. Journal of Crystallization Process and Technology. 2012;2:156-160.
CrossRef - Book:Crystal growth process and method; Dr. Santhana P. R.,Dr.Ramasamy P.
- Ambujam K., Preema C. T.,Aruna S., Prem D. A & Sagayaraj P. Material and Manufacturing Process. 2007;22(3):346-350.
CrossRef - ManXu,Environmental Science Graduate Program.The Ohio State University. 2008.
- John Coates in Encyclopedia of Analytical Chemistry Meyers R. A. (Ed. John Wiley & Sons Ltd, Chichester. 2000;10815–10837.
- Book;Infrared Spectroscopy:Fundamentals and Applications, Barbara H. Stuart, Publ. John Wiley & Sons, Ltd.
- RAMACHANDRAN S., VELRAJ R. G. Journ. Phys. 2012;57(7-8)1128-1137. Bucharest.
- Lambert J., et al. Introduction to Organic Spectroscopy. Macmillan Publ. N.Y. 1987.
- Regnier N.,Guibe C. Methodology for multistage degradation of polyimide polymer. Polym. Degrad. Stab. 1997;55:165-172.
CrossRef - Motashari S. M.,Kamali Y. N & Fayyaz F. J. Them. Anal. Cal. 2008;91(1):237.
CrossRef - Guan C., Li l., Chen D., Gao Z., Sun W. In. Thermochimica Acta. 2004;413(1-2):31-38.
CrossRef - Ramukutty S.,Ramchandran E. Journal of Crystallization Process and Technology. 2014;4:71-78.
CrossRef
Accepted on: 31 January 18


![]()
![]()
![]()
![]()