Spectroscopic and Thermal Characterization of Ni(II) and Cu(II) Complexes of Glipizide- and Oral Antidiabetic Drug
Neeti Rathore
Department of Chemistry, Saifia Science College, Bhopal - 462 001, India.
Article Publishing History
Article Received on : 16 Apr 2013
Article Accepted on : 27 May 2013
Article Published :
Plagiarism Check: No
Article Metrics
ABSTRACT:
Metal complexes of Glipizide drug were prepared and characterized based on elemental analysis, FT-IR, Molar conductance and thermal analysis (TGA technique). From elemental analysis data, the complexes were proposed to have general formulae (C21H25N5O4S)2M. The molar conductance data reveals that both the complexes are non-electrolyte, IR spectra shows that the drug is coordinated to the metal ions in a neutral bidentate manner with OO donor sites of the amide O and sulphone O, from the ESR spectra, it is found that that the geometrical structures of these complexes are tetrahedral. The thermal behaviour of these complexes were studied using thermo gravimetric analysis technique. The result obtained shows that the hydrated complexes lose water molecules of hydration followed immediately by decomposition of the anions and the ligand molecules in the successive stages. Thermogravimetric analysis was carried out to study the decomposition and various kinetic parameters. Freeman Carroll and Sharp Wentworth method have been applied for calculation of kinetic parameters, while the data from Freeman Carroll method have been used to determine various thermodynamic parameters such as order of reaction, entropy change, free energy change and apparent entropy change.
KEYWORDS:
FT-IR spectra; TGA; Glipizide; Metal complex
Copy the following to cite this article:
Rathore N. Spectroscopic and Thermal Characterization of Ni(II) and Cu(II) Complexes of Glipizide- and Oral Antidiabetic Drug. Mat.Sci.Res.India;10(1)
|
Copy the following to cite this URL:
Rathore N. Spectroscopic and Thermal Characterization of Ni(II) and Cu(II) Complexes of Glipizide- and Oral Antidiabetic Drug. Mat.Sci.Res.India;10(1). Available from: http://www.materialsciencejournal.org/?p=313
|
Introduction
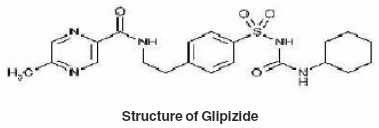
Glipizide (trade name, Glucotrol) is one of the most commonly prescribed drug for treatment of type -II diabetes mellitus. It is an oral hypoglycemic drug. Its empirical formula is C21H27N5O4S, molecular weight is 445.55 and IUPAC name is 1cyclohexyl 3[[p[2(5methyl pyrazine carboxamido)- ethyl] phenyl] sulfonyl] urea. Glipizide is a bi substituted urea derivative which can exist in keto and enolic form, when dissolved in an organic solvent and reacts with various metal ions to form intensely colored complexes that provide the basis for their use as a sensitive reagent.
Thermal analysis is a routine method for analysis of drug and substances of pharmaceutical interest. It is a typical analysis technique to describe the relationship between physico-chemical changes and temperature.1,2 TGA/DTG and DSC curves have related important information about the physical properties of materials. Kinetic parameter like activation energy, frequency factor and order of reaction can be measured by thermo analytical methods according to progress of reaction. It can be used in the quality control of drugs, with a view to improvement of drug quality via technical parameters.
Thermal studies of complexes were carried out to determine their mode of decomposition, the activation energy (Eα), order of reaction (n), frequency factor (Z), entropy change (S), free energy (ΔF) and apparent entropy change (*S). Thermal decomposition curves were discussed with careful attention of minute details. Freeman Carroll and Sharp-Wentworth methods3,4 have been used to calculate activation energy and thermal stability.
However, not much work has been carried out on the synthesis and characterization and thermal degradation studies of the metal complexes of the drug glipizide.
Hence, in this paper we have prepared complexes of Cu and Ni with ligand glipizide. The solid complexes were characterized using different Physico-chemical methods like elemental analysis (C,H,N,S and metal content), IR, NMR and thermal analysis (TGA).
Experimental
All the chemicals used for the preparation of complexes are of Hi-media, AR grade and E-Merck quality. Metal complexes were synthesized by adding metal salt solution in appropriate solvent to the solution of the ligand. The mixture was refluxed for 3-4 hours. Whereby, the precipitate of metal complexes was obtained. It was filtered, washed and dried in vacuum desiccators. All selected metals form 1:2 complexes with glipizide, was confirmed by Job’s method5 of continuous variation as modified by Turner and Anderson.6
Instruments
Molar conductance of solid complexes in DMF was measured using Systronics Conductivity meter. The elemental analysis of the isolated complexes was carried out using Elementer Vario EL III Analyser at STIC Kerala, India. The IR spectrum of the ligand as well as of the complexes were recorded on Perkin Elmer Spectrometer at CDRI Lucknow, India and 1H NMR spectra of the ligand and isolated complexes were recorded on a Bruker DRX-300 Spectrometer at CDRI, Lucknow and Thermo gravimetric analysis was carried out in dynamic nitrogen atmosphere with a linear heating rate of 10°C/ min. using Pyris 6 TGA Thermal analyser at Central Instrumentation facility, IISER Bhopal
Results And Discussion
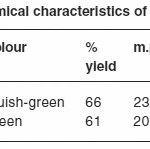
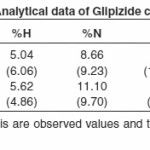
The isolated solid complexes of Ni (II) and Cu (II) with the ligand glipizide were subjected to elemental analysis (C, N, H, S and metal content), IR, NMR, Molar conductance, and thermal analysis (TGA) to support the tentative structure. The results of elemental analysis listed in table (1) suggest the formula (C21H25N5O4S)2Ni and (C21H25N5O4S)2Cu for the respective complexes.
Molar Conductance
The complexes were dissolved in DMF and the molar conductance of their solutions at 298 K was measured. It is concluded from results listed in table (2) that the Cu and Ni complexes are found to have molar conductance values of 14.18 and 18.23 mole-1 am-2 indicating that both the complexes are non-electrolytes.
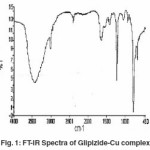
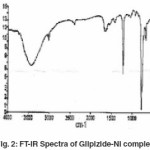
IR Spectral Studies
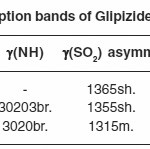
The IR spectral data of Glipizide and their metal complexes are listed in table (3). The IR spectra of the complexes were compared with those of the free glipizide ligand in order to determine the co-ordination sites that may be involved in complexation. The tautomeric equilibrium depends on the extent of conjugation, nature and position of the substituent, polarity of the solvent etc.
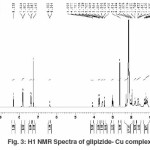
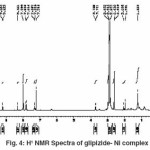
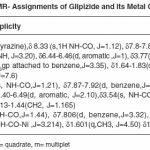
H1-NMR Studies
We have observed imides (NH) proton around (d8.35) in the spectrum of the ligand that has disappeared in the spectra of the complexes molecule due to formation of M-O bond. This also confirms the de-protonation of imide NH group through enolisation.
Thermal Analysis
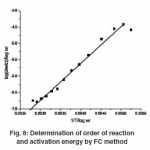
Thermal analysis method is associated with a change in weight with respect to temperature. Heating is performed under strictly controlled conditions and can reveal changes in structure and other important properties of the material being studied. In non- isothermal or dynamic TGA the sample is subjected to conditions increase in temperature at linear rate. The Freeman–Carroll and Sharp- Wentworth methods have been employed for the calculation of kinetic parameters of the newly synthesized complexes of glipizide with help of dynamic TG curve. The advantage of Freeman and Carroll method that in one single stage by keeping heating rate constant both the order of reaction and energy of activation can be calculated in a single experiment.
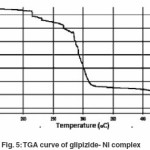
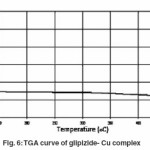
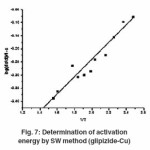
Thermogram of glipizide Cu and glipizide Ni complexes show activation energy calculated by the Freeman – Carroll and Sharp- Wentworth methods are in good agreement with each other. Using thermal decomposition data and then applying the Sharp- Wentworth method15,16 activation energy is calculated which is in agreement with the activation energy calculated by Freeman- Caroll method.17,18 A representative thermal activation energy plot (fig.7 ) and Freeman- Caroll plot (fig.8) for the complexes have been shown. The values of thermodynamic parameters such as entropy change (ΔS), Free energy change(ΔF), frequency factor (Z) and Apparent entropy change (S) is given in table5.
The thermo analytical data are presented in table5-7. In studying the decomposition kinetics11-14, two above mentioned methods were used, in each case the least square plots were drawn. The first few points that did not fall on straight line were discarded. These types of deviations of point are reported in literature by several research workers. This is explained as due to the failure of obeying as first order kinetics always by the solids in early stages of their decomposition.
Sharp -Wentworth Method
Using the equation derived by Sharp and Wentworth,
log [(dc/dT)/ (1-c)] = log (A/b)-[Ea/2.303R]. 1/T …(1)
Where,
dc/dT = rate of change of fraction of weight with change in temperature
b = linear heating rate dT/dt
By plotting the graph between (log dc/dt)/ (1-c) vs 1/T we obtained the straight line which give energy of activation (Ea) from its slope(7). Where β is the conversion at time t, R is the gas constant (8.314 J mol-1 K-1) and T is the absolute temperature.
Freeman-Carroll Method Rcf
The straight-line equation derived by Freeman and Carroll, which is in the form of n
[Δlog (dw / dt)] / Δ log Wr = (-E / 2.303R) – Δ(1/ T) /Δ log Wr + n …(2)
Where,
dw/dt = rate of change of weight with time.
Wr = Wc-W
Wc = weight loss at completion of reaction. W = fraction of weight loss at time t.
Ea = energy of activation., n = order of reaction.
The plot between the terms [Δ log (dw/dt)] /Δ log Wr Vs Δ (1/T) / Δ log Wr which give energy of activation (Ea) and intercept on Y-axis as order of reaction (n). The change in entropy (S), frequency factor (z), apparent entropy were calculated as given below:
Entropy Change
Intercept = [ log KR /h φ E]+ S/2.303 K …(3)
K = 1.3806 × 10⁻¹⁶ erg/deg/mole,
R = 1.987 cal/deg/mole
h = 6.625 × 10⁻²⁷ erg sec, φ = 0.166
S = change in entropy
E = activation energy from graph
Free Energy Change
ΔF = ΔH- TΔS …(4)
ΔH = Enthalpy change
T = Temperature in K
S = Entropy change
Frequency Factor
Bn = log Z Ea /φR …(5)
B1 = log [ ln 1 / 1-α ] – log P(x) …(6)
Z = frequency factor
B = calculated from equation ( 6 )
Log P(x) = calculated from Doyle’s table corresponding to activation energy.
Apparent Entropy Change
S* = 2.303 log Zh / KT* …(7)
Z = from relation ( 4 )
T* = temperature at which half of the compound is decomposed from it total loss.
Discussion
The complexes of Cu and Ni were synthesized with hypoglycemic agent glipizide, the formula suggested for the complexes are well supported by the Job’s method of continuous variation as modified by Turner and Anderson, moreover, the formulae of the complexes further gets support from the analytical data.
For determining the proposed structure on the basis of stoichiometry and analyzing the complexes, advanced spectrophotometric methods like IR, NMR (table 3 and 4) were conducted which suggest the co-ordination of the metal atom with enolic oxygen of the carbonyl group on one side and oxygen of the sulphonyl group from the other side. These observations were further supported from the IR and NMR values of M-O and the appearance of N-H linkage in NMR. Moreover, looking to the higher electronegativity of the oxygen as compared to N2, enolisation is strongly supported.
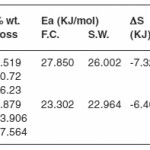
The thermal properties were also studied using TGA technique and various thermodynamic parameters of the dehydrate complexes namely activation energy(Ea), enthalpy(ΔH), entropy(ΔS) and Gibb’s free energy change of decomposition (ΔG°) were evaluated graphically by employing Freeman-Carroll and Sharp-Wentworth relation. The data has been summarized in table 8, the activation energies of decomposition were found to be in the range 22.964-27.850 KJ/mol. These values reflect the thermal stability of complexes. The entropy of activation is found to have negative values in both the complexes which indicate that decomposition reactions proceed with lower rate than normal ones.19-21 The order of reaction was found to be one. Thus on the basis of Analytical, spectral and thermal studies structure I has been proposed for both the complexes.
Hypoglycemic Activity
The isolated Glipizide -metal complexes were found to be more potent as compared to the parent drug. Hence as compared to standard synthetic drug the Glipizide -metal complexes are having higher hypoglycemic activity.
Acknowledgments
The author is thankful to the principal of Saifia Science College, Bhopal and Principal of Cresent College of Technology, Bhopal for providing all necessary facilities, Suprachemicals Pvt. Ltd. Thane Mumbai for providing the drug Glipizide and IISER Bhopal for providing NMR and TGA data and CDRI Lucknow for providing IR Spectra. Author is also thankful to STIC Kerala for providing timely results for elemental analysis.
References
- Iqbal S.A.,Sibi Jose and Ishaq Jaafrany., Orient. J. Chem., 28 (1):613-618 (2012).
CrossRef
- Rai B.K. and Chandan Kumar Orient. J. Chem., 26 (3): 989-994 (2010).
- E.S.Freeman and B. Carroll., J.Phy. Chem.,62: 394-397 (1958).
CrossRef
- J.B. Sharp and S.A.Wentworth., Analytical Chemistry., 41(4): 2060-2062 (1969).
CrossRef
- Job, P., Ann. Chim, 113: 10 (1928).
- Turner, S.E. and Anderson, R.C., J. Am.Chem. Soc., 912, 71 (1949).
- Nakamotto., Infrared spectra of Inorganic and Co-ordination compounds John Wiley and Son’s New York Ed. (1963).
- Weissberger, A., “Chemical Application of Spectroscopy” Vol. IX, Inter Sci. Pub. N. Y., (1956),
- C.N. Rao., “Chemical Applications of Infra- Red Spectroscopy”, Academic Press New York, (1963).
- L.J.Bellamy, The Infra-red spectra of complex molecules, Matheun and co. ltd. London (1964).
- Subi,A. Al-Jibori, Ibrahim F., Waheed and Alif, Al-Samoraie., Orient. J. Chem., 28(1): 257- 262 (2012).
- Rehman, F. and Samya Majraj, Orient. J. Chem., 28(1): 581-585 (2012).
- Amit N.Gupta., Vinay V. Hiwase and Ashok B. Kalambe; J.Chem. Pharm. Res., 4(5): 2475- 2482 (2012).
- W.B.Gurnule and M.B.Thakare, Der pharma Chem., 4(4):1698-1703(2012).
- S.Singh, K.K.Singh and J.P. Singh, Orient.J.Chem. 27(3): 1233-1237 (2011).
- R.N.Singru., Arch. Appl .Sci. Res.,3(5): 309- 325. (2011).
- M. Karunakaran, C.T. Vijaya kumar, C. Magesh, T. Amudha, International J. of Engineering Science and Technology., 3(1), 162-176 (2011).
- Mohd. Tawkir., Khalid Khairou and Ishaq Zaafarany., Orient. J. Chem.,28 (4): 1697- 1710 (2012).
- Jadho M.M., Paliwal L.J., and Bhave M.S., J. of App. Polym. Sci., 109: 508 (2008).
CrossRef
- M.R Khan and Sahdev., Orient. J. Chem.,27(2): 649-653 (2011)
- K. Shankar and A.B. Nazeera., Orient. J. Chem., 27(2): 655-660 (2011).

This work is licensed under a Creative Commons Attribution 4.0 International License.