Theoretical Simulation of the Thermal Profile in Capillary Action Shaping Technique and Its Verification Through the Growth of Silicon Sheets
Leena Garg1, 2, S. M. D. Rao1, 3, R. C. Verma1
1Department of Physics, Punjabi University, Patiala, India
2Department of Applied Sciences, Physics Group, Chandigarh University, Gharuan, India
3Institute of Physics, Academia Sinica, Taipei, Taiwan, ROC
For correspondence: Email: leena_physics@yahoo.com
DOI : http://dx.doi.org/10.13005/msri/120107
Article Publishing History
Article Received on : 10 Jun 2015
Article Accepted on : 25 Jun 2015
Article Published :
Plagiarism Check: Yes
Article Metrics
ABSTRACT:
The temperature distribution profile above the graphite die used to grow multi-crystalline silicon (Si) sheets by Capillary Action Shaping Technique (CAST) in a resistive heated system, has been controlled by forced argon (Ar) gas cooling. A theoretical model is proposed in which the temperature on the top of the die is related with the gas flow and the solutions to these equations are simulated and plotted using Mathematica 6.0 program. While the crystal growth is better controlled with the forced cooling, the theoretical model helps to set the optimum flow rates for obtaining desired growth speed and thickness of the Si sheets. Thus the experimental growth variables such as thickness and growth rates of the growing silicon sheets have been controlled. Temperature gradient values at the growth interface observed experimentally have also been compared to the theoretical values, which agree closely.
KEYWORDS:
CAST; Crystal growth; Silicon; Theoretical simulation; Temperature gradient
Copy the following to cite this article:
Garg L, Rao S. M. D, Verma R. C. Theoretical Simulation of the Thermal Profile in Capillary Action Shaping Technique and Its Verification Through the Growth of Silicon Sheets. Mat.Sci.Res.India;12(1)
|
Copy the following to cite this URL:
Garg L, Rao S. M. D, Verma R. C. Theoretical Simulation of the Thermal Profile in Capillary Action Shaping Technique and Its Verification Through the Growth of Silicon Sheets. Mat.Sci.Res.India;12(1). Available from: http://www.materialsciencejournal.org/?p=2544
|
Introduction
Crystal growth techniques from the melt have been very important for the technological point of view when the focus is basically on the growth of silicon crystals. Silicon is abundantly available, semiconductor material. The edge defined film fed growth technique (EFG) [1-5] has resulted in the growth of silicon crystals in the form of ribbons, octagons [4-7], nonagons [6, 8] and tubes [4] for most solar cell applications. In this method the crystallization takes place from a liquid film on the top of the die whose shape defines the geometry of the growing crystal. CAST [9-13] is a modification to EFG where the liquid rises to the top of the die and above the melt surface by capillary action. Crystal growth is then carried out little away from the die-top melt surface. The theory related with this method has been developed by several workers [1-3]. One of the problems faced while growing wide ribbon shaped Si-crystals in a cylindrical resistive heated furnace is controlling the shape of the solid- liquid (s-l) interface for stable crystal growth. Different methods can be used to control the growth interface to achieve continuous and stable growth at high growth rates [10, 11]. Ciszek and Schwuttke [11] used Ar gas flow for the modification of this interface in the CAST technique where RF heating was used. In the present research communication, a theoretical model has been presented to obtain the required temperature profile at the growth interface by forced cooling of the die top using Ar gas flow for the CAST crystal growth process. The resultant equations have been used to predict the temperature variation relative to the change in gas flow rate across the interface. While maintaining the required temperature profile across the interface using the described model, growth variables such as thickness and velocity of the growing silicon sheets have also been controlled.
Temperature gradient for the CAST apparatus basically describes the difference in temperatures across the growth interface; more specifically it defines the thermal difference between the top of the die and bottom of the growing crystal surface. For such type of crystal growth process, it is necessary to maintain appropriate value of temperature gradient as it is responsible for the contact between melt meniscus and the growing crystal. Inadequacy of the appropriate value of the thermal gradient even just for a few seconds, leads to the disappearance of the meniscus. Therefore the purpose of performing theoretical simulation of the thermal profile for the CAST crystal growth technique is to maintain appropriate value of the thermal gradient across the interface for the growth of wide silicon ribbons. In the present research paper, experimentally observed values of the temperature gradient near the s-l interface have been presented and compared with those obtained from the reported theories [2, 3]. It is appreciable to indicate that these values match closely and the effort towards the growth of wide silicon sheets using lower cost heating system, have been proceeded further.
CAST – Experimental Methodology
The design and fabrication steps towards CAST technique are similar to those described by Pooja et al. [6]. Details of the equipment and procedure used for the growth of Si sheets have been reported by Leena et al. [13, 14]. The whole equipment has been fabricated indigenously. Resistive heating has been used in the system for melting silicon and crystal growth processes. It has been reported [11] that the properties of the sheets grown by using the RF heating are influenced by the static head and sharp temperature gradient above the die, as RF heating causes sufficient stirring in the melt, resulting in changes of temperature and non-uniform impurity distribution in the melt. With resistive heating these problems can be reduced. Temperature control is easy with such type of heating and above all, it is more economical in comparison with induction heating. Silicon powder is first melted in a silica crucible placed inside a graphite support crucible. Crushed pieces of resultant Si-melt have been used for the further crystal growth process. A graphite die with suitable capillaries and slot for raising the Si liquid about 2 cm above the melt surface, is fixed in the middle of the silica crucible. With the rise of sufficient temperature in the resistive heated furnace, silicon is melted and liquid is seen at the top of the die. At this point a Si seed plate is brought in contact with the liquid. With the natural cooling of the seed through a water-cooled seed holder, the growth speed is small (0.5-1 mm/min) initially and the thickness of the crystal is large (1-3 mm) depending upon the thickness at the top of the die. However, by forced cooling of the seed by Ar-gas jet streams directed towards the growth interface, it is possible to increase the growth speed and thereby decrease the thickness of the growing crystal. To simulate the temperature change at the top of the die with the increase in the Ar gas flow rate, linear and nonlinear equations were built up. Only the linear equations are discussed here. Simultaneously temperature changes on the die top were experimentally measured using three thermocouples positioned near the top of the die. The corresponding temperature change is measured while increasing the gas flow. The details of thermal balancing of the growth profile for the CAST crystal growth process are discussed elsewhere [14].
Theoretical Simulation of the Thermal Profile
Shape of the growth profile
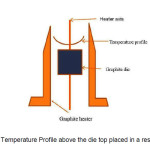
The (radial) temperature distribution inside the graphite heater is shown in the Fig. 1. It is higher close to the heater walls and reduces towards the centre of the heater. With such an isotherm the crystal growth would be restricted to the central region where the isotherm is nearly flat and growth of wide sheets may require larger heating system. In order to overcome this, the edges of the die were cooled by directional Ar gas jets as described by Ciszek [11]. This helps in making the isotherm above the die nearly flat in addition to cooling the growing Si sheet. This way cooling the growth interface is beneficial in two ways; wider sheet growth has become feasible with the thermal balance of s-l interface and it is helpful in increasing the growth speed and thus, thickness of the growing sheet can be improved.
Figure1: Curved Temperature Profile above the die top placed in a resistance heater
Theoretical simulation
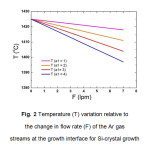
For generating the equations by curve fitting, an estimated data is used based upon the initial working of the equipment; such as the gas flow rate used ranges 0-7 lpm. A maximum value used for the heater temperature is 1425 oC, almost 15 oC above the MP (melting point) of silicon. Using this, the temperature variation, T above the die top edges is estimated as the Ar gas flow rate, F is increased. Solutions with both linear and 2nd order equations have been developed numerically, but only the linear ones are presented here, as indicated by equation (1):
T = a1. F+b1 (1)
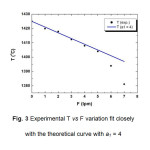
The value of a1 has been varied from 1-4 and b1 kept constant at 1425 oC. The curves obtained for the variation of T with F, are presented in Fig.2. The results of the growth experiments are shown in Fig. 3 for one side of the die top while it is similar for the other sides also. One of the curves obtained with the slope of a1 = 4 nearly agrees with the experimental result. This equation has therefore been used as a standard for the CAST equipment for predicting the variation of temperature with gas flow rate and further has been used for the verification of the temperature gradient obtained from the experimental data.
Fig. 2 Temperature (T) variation relative to the change in flow rate (F) of the Ar gas streams at the growth interface for Si-crystal growth
Figure3: Experimental T vs F variation fit closely with the theoretical curve with a1 = 4
Experimental validation of the results from theoretical model
Thermal gradient during crystal growth
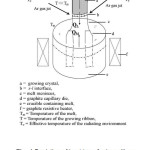
Consider Fig. 4, describing different heat transfers occurring in the high temperature CAST system for the silicon crystal growth process. The heat balance at the growth interface can be given by [1-3]:
QM + QL + QR (2)
where QM = Heat flux conducted to the interface by the melt,
QL = Heat generated at the interface by crystallization,
QR= Heat flux carried away by the growing ribbon.
The heat fluxes described by equation (2) involved in the growth process, can be defined as [1-5]:
QM = kl G (3)
where Kl = Thermal conductivity of the melt,
G = Temperature gradient in the melt adjacent to the s-l interface;
QL = L Vg (4)
where L = Latent heat of fusion per unit volume of solid,
Vg = Growth velocity;
QR = km (dT/dz) Tm = a f(β) t-1/2 (5)
where Km = Thermal conductivity of the solid at the melting temperature Tm,
z = measure of the distance vertically downward from the s-l interface,
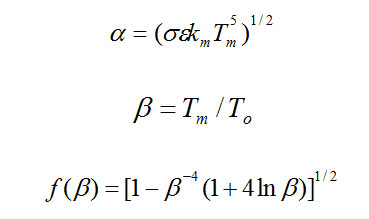
The constants involved above are described as: σ is the Stefan-Boltzman constant and ε is the emissivity of the crystal surface. To (effective temperature of the radiating environment) can have different values depending upon the different growth environments in crystal growth experiments.
Using the heat flux considerations from equations (3), (4) and (5) in the fundamental equation of energy conservation described by equation (2), an expression has been found relating the temperature gradient, growth velocity, environment temperature of the hot working zone and the thickness of the growing crystal sheet/ribbon [2]:
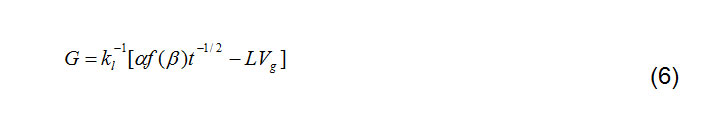
Basically from the theoretical equation (6), the growth velocity is proportional to the thermal gradient G and at the growth interface G depends upon these two variables – To and Vg. The rate of growth and thickness t of the growing crystals is therefore decided by the growth conditions of the experiment. We have used the fitting of the equation (1) into equation (6) to determine the temperature gradient at the interface for different thicknesses and growth rates of the experiment. These values have been compared with those obtained from experiments. For the theoretical calculations before performing the real experiments, the thickness t values have been chosen randomly in the interval (0.16, 026) expressed in cm. Choosing different values of To and Vg, the values of gradient G are calculated and summed up in Table 1. The values of other constants used for the Si crystal growth, are σ = 5.67 x 10⁻⁵ erg s-1 cm-2 k-4, ε = 0.55, Tm = 1410 oC, Kl = 4.7 x 10⁵ erg s-1cm-1k-1, L = 7.73 x 10⁹ erg cm-3.
Table1: Theoretically calculated values of thermal gradient for different set of values of To and Vg
|
Sr. no.
|
To
(oC)
|
Vg
(cm/s)
|
t
(cm)
|
Gth*
(oC/cm)
|
|
1.
|
1371
|
0.0008
|
0.19
|
58.8
|
|
2.
|
1359
|
0.0045
|
0.23
|
60.8
|
|
3.
|
1351
|
0.0057
|
0.21
|
124.6
|
|
4.
|
1337
|
0.0027
|
0.25
|
235.9
|
|
5.
|
1340
|
0.0049
|
0.16
|
310.6
|
|
6.
|
1312
|
0.0045
|
0.26
|
372.1
|
* Gth = Theoretical value of the temperature gradient
These calculated values of temperature gradient are verified experimentally using the actual values of thicknesses of the grown crystals and has been found that these values are in close agreement with the theoretically calculated values. The different values are summed up and presented here in Table 2, 3 and 4 respectively. The empirical expression for the thermal gradient as predicted in Eriss et al. [2] can be written as:
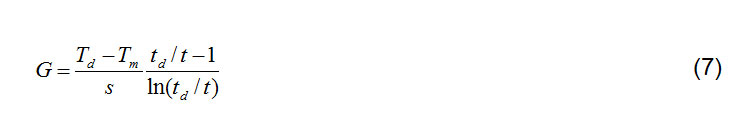
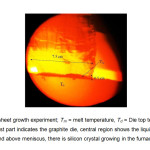
where Td =Die top temperature,Tm = Melting point temperature,s = Meniscus height, td = Die top thickness, t = crystal thickness. For a series of experiments performed with same thickness of die top (td), other physical quantities like die top temperature (Td), meniscus height (s) and crystal thickness (t) may vary depending upon the different growth conditions during experimentation while Tm for silicon material remains constant. The values of different variables which are required to be substituted in equation (7) are obtained from the calibration of the values such as crystal width, crystal thickness, meniscus height etc. at some specific positions of the grown crystal during and after the experiment. The calibrated values used for obtaining the temperature gradient for one such calculation is illustrated here. Consider Fig. 5 clicked at any instant during Si-sheet crystal growth, a print of this picture is taken and different dimensions are measured. These dimensions are then compared with the actual values of the crystal width and die top width for the specific experiment and the values obtained thereby are used for the calculation of G from equation (7). The values used are: Td = 1452.5 oC, s = 0.087 cm and t = 0.156 cm and G is obtained as 315.7 oC/cm. The G values for different growth conditions are summed up and presented in Table 2.
Table2: summarizes calibrated values of temperature gradient derived from various pictures taken during the experiment
|
Expt.
Sr. no.
|
Td
(oC)
|
S
(cm)
|
T
(cm)
|
Gexp**
(oC/cm)
|
|
1.
|
1427.8
|
0.192
|
0.193
|
54.6
|
|
2.
|
1432.9
|
0.216
|
0.234
|
57.9
|
|
3.
|
1433.1
|
0.105
|
0.214
|
124.6
|
|
4.
|
1445.1
|
0.079
|
0.248
|
237.3
|
|
5.
|
1452.5
|
0.087
|
0.156
|
315.7
|
|
6.
|
1436.9
|
0.038
|
0.261
|
373.5
|
** Gexp is thevalue of temperature gradient calculated while using the growth variables from the experiment
Figure4: Depiction of heat transfer in a silicon crystal growth process by CAST
Figure5: Si-sheet growth experiment; Tm = melt temperature, Td = Die top temperature (Lower most part indicates the graphite die, central region shows the liquid meniscus and above meniscus, there is silicon crystal growing in the furnace)
The theoretically obtained values of temperature gradient presented in Table 1, were calculated with the set of values for To, Vg and t which were randomly chosen. With the performance of Si-sheet growth experiments, it became possible to measure the actual thicknesses of the grown crystals. Substituting the actual values of ‘t’ (listed in Table 2) into Table 1 and performing the calculations again using equation (6), the Table 1 has been developed again and is presented here as Table 3.
Table3: Experimental values of thickness ‘t’ has been substituted again to re-built Table 1
|
Sr. no.
|
To
(oC)
|
Vg
(cm/s)
|
t
(cm)
|
Gth
(oC/cm)
|
|
1.
|
1371
|
0.0008
|
0.193
|
56.1
|
|
2.
|
1359
|
0.0045
|
0.234
|
57.3
|
|
3.
|
1351
|
0.0057
|
0.214
|
120.0
|
|
4.
|
1337
|
0.0027
|
0.248
|
238.1
|
|
5.
|
1340
|
0.0049
|
0.156
|
319.1
|
|
6.
|
1312
|
0.0045
|
0.261
|
370.7
|
Now Table 2 represents the experimental values of temperature gradient (Gexp) and Table 3 represents theoretical values of temperature gradient (Gth). The two gradient values has been compared and collected together in Table 4. It is evident from the data that theoretically calculated values agree closely to those obtained experimentally. Thus it can be stated that theoretical concepts and equations are well correlated with the experiment. It may therefore be possible to use the modelling (described here) to automate the growth process through appropriate electronic control of the flow rates and pull speeds.
Table4: represents a comparison between Gth and Gexp
|
Expt.
Sr. no.
|
Gth
(oC/cm)
|
Gexp
(oC/cm)
|
|
1.
|
56.1
|
54.6
|
|
2.
|
57.3
|
57.9
|
|
3.
|
120.0
|
124.6
|
|
4.
|
238.1
|
237.3
|
|
5.
|
319.1
|
315.7
|
|
6.
|
370.7
|
373.5
|
Growth of Si sheets using CAST
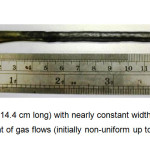
Silicon crystal grown using a capillary slot width of about 40 mm and gas flow rates of 4-7 lpm is presented in Fig. 6. Using the curve of Fig. 3, the temperature was reduced by increasing the gas flow to bring the temperature of the growing crystal close to the melting point. Initially when the growth has been started, the temperature distribution was non-uniform at the interface. With the variation of gas flow as per the curve shown in Fig. 3, the growth interface could be brought to thermal equilibrium at the top of the die and uniform crystals have been obtained, one of which is as shown in Fig. 6. Gth values as indicated in Table 1, have served to be useful for maintaining uniform temperature at the s-l interface.
Figure6: Si crystal (~14.4 cm long) with nearly constant width grown by proper adjustment of gas flows (initially non-uniform up to 1.5 cm)
Conclusions
Curved shape of the s-l interface is modified to suit wide Si-sheet growth using forced Ar gas streams at the two edges above the die top. The temperature variations with gas flow are fitted using linear and nonlinear equations. One of the linear equations is found to verify the experimental data. Theoretically calculated temperature gradient values match well with the experimentally obtained ones which indicate that the simulation of the thermal profile presented here could be used for the automation of crystal growth process using CAST apparatus. A number of Si-crystalline sheets with uniform width have been grown achieving thermal balance of the growth interface.
Acknowledgements
Authors are grateful to the staff of the Solar Energy Research Laboratory for constant support and motivation. One of the research fellows, Palvinder Kaur has provided assistance for the crystal growth process. Thanks are also due to the Dr. Jaspal Singh, Vice Chancellor, Punjabi University, Patiala, for his kind patronage. This work was supported under a Govt. of India, Department of Science and Technology Project SR/NM/NAT-02-2007 dated 06-08-2008.
References
- Swartz, J. C.; Surek, T.; Chalmers, B.; Journal of Electronic Materials, 1975, 4 (2), 255-279.
CrossRef
- Eriss, L.; Stormont, R. W.; Surek, T.; Taylor, A. S.; Journal of Crystal Growth, 1980, 50, 200-211.
CrossRef
- Sachs, E. M.; Journal of Crystal Growth, 1980, 50, 102-113.
CrossRef
- Mackintosh, B.; Seidl, A.; Ouellette, M.; Bethay, B.; Yates, D.; Kalejs, J.; Journal of Crystal Growth, 2006, 287, 428-432.
CrossRef
- Ravi, K. V.; Journal of Crystal Growth, 1977, 39, 1-16.
CrossRef
- Seth, P.; Aggarwal, S.; Sharma, A. C.; Rao, S. M.; Verma, R. C.; Indian Journal of Pure & Applied Physics, 2010, 48, 394-397.
- Harvey, D. S.; Journal of Crystal Growth, 1990, 104, 88-92.
CrossRef
- Taylor, A. S.; Mackintosh, B. H.; Eriss, L.; Wald, F. V.; Journal of Crystal Growth, 1987, 82, 134-141.
CrossRef
- Schwuttke, G. H.; Yang, K.; Ciszek, T. F.; Journal of Crystal Growth, 1978, 43, 329-335.
CrossRef
- Kalejs, J. P.; Makintosh, B. H.; Surek, T.; Journal of Crystal Growth, 1980, 50, 175-192.
CrossRef
- Ciszek, T. F.; Schwuttke, G. H.; Journal of Crystal Growth, 1977, 42, 483-489.
CrossRef
- Verma, R. C.; Rao, S. M. D.; Indian Patent (Pending).
- Garg, L.; Verma, R. C.; Rao, S. M. D.; Bulletin of Indian Vacuum Society, 2013, 16 (1), 3-8.
- Garg, L.; Theoretical modeling and its experimental verification for the growth of silicon and other multicrystalline sheets by Capillary Action Shaping Technique, doctoral diss. (2013) Punjabi University, Patiala, India.

This work is licensed under a Creative Commons Attribution 4.0 International License.