Udayan De1*, Kriti Ranjan Sahu2 and Keka R Chakraborty3
1Calcutta Institute of Engineering and Management, Kolkata, India, 700040
2Physics Dept., ESSB College, Egra, PurbaMedinipur, W.Bengal, India, 721429
3Solid State Physics Division,Bhabha Atomic Research Centre, Mumbai, India, 400085
Corresponding Author Email: ude2006@gmail.com
DOI : http://dx.doi.org/10.13005/msri/130103
Article Publishing History
Article Received on : 09 Jun 2016
Article Accepted on : 21 Jun 2016
Article Published :
Plagiarism Check: Yes
Article Metrics
ABSTRACT:
Orthorhombic phase of lead metaniobate (PbNb2O6) is piezoelectric with a high Curie temperature (>570°C) with high potential of wide use in important high temperature applications that cannot be covered by the popular piezoelectric materials based on BT and PZT. Difficulty of preparing it in pure phase hindered full characterisation and wide use of this long known piezoelectric material. Here,PbNb2O6 pellets have been prepared in pure orthorhombic phase and first characterised by room temperature TEM and XRD techniques, with a satisfying agreement of the two results. Next, we carried out high temperature x-ray diffraction study of its ferroelectric to paraelectric phase transition on heating across the Curie temperature, and also trace the cooling path.On heating the sample to 590°C and cooling back, there is a significant increase of cell volume.
KEYWORDS:
Curie Temperature; Orthorhombic PbNb2O6; Ferroelectric Phase Transition; High Temperature XRD; Piezoelectric materials; Rietveld Refinements; Tetragonal PbNb2O6; TEM
Copy the following to cite this article:
Udayan De, Sahu K. R, Chakraborty K. R . High Temperature XRD of Phase Transition in Piezoelectric PbNb2O6 across its Curie temperature. Mat.Sci.Res.India;13(1)
|
Copy the following to cite this URL:
Udayan De, Sahu K. R, Chakraborty K. R . High Temperature XRD of Phase Transition in Piezoelectric PbNb2O6 across its Curie temperature. Mat.Sci.Res.India;13(1). Available from: http://www.materialsciencejournal.org/?p=4288
|
Introduction
Piezoelectric materials are finding increasing utilization as sensors, actuators, ultrasonic imaging devices, and in many other commercially profitable applications. For applications in critical areas like Fast Breeder Reactors and exhausts of rockets and vehicles, piezoelectric materials with high Curie temperature1 are essential. Among the few materials in different stages of development for higher temperature piezoelectric devices, less work has been done on the old but inadequately studied piezoelectric material2 of lead metaniobate (PbNb2O6 or PN). Room temperature structure of PN can be2–4 either rhombohedral or orthorhombic. Only the latter is ferroelectric with piezoelectric properties, attractive because of attractively high Curie temperature5 (> 570°C). Fewer studies on PN, in spite of this high Curie temperature, have been basically due to the problem of preparing, by quenching,6 the piezoelectric form (the meta-stable orthorhombic structure) in pure phase. Subsequently, various aspects have not been re-studied in modern times. We decided to investigate with high temperature (HT) x-ray diffraction (XRD) the structural changes during ferroelectric to paraelectric phase transition on heating across the Curie temperature and trace the cooling path also, of orthorhombic PbNb2O6, characterized at room temperature by XRD and TEM (Transmission Electron Microscopy). We have optimized preparation steps3 including the quenching (Q) step, and prepared pure orthorhombic phase of PN, to be called PNOQL, with L denoting the supplier (Loba) of Nb2O5 used in the preparation.
Materials and Methods
Sample Preparation
Pellets from starting chemicals of PbO and Nb2O5 with 2% extra weight of PbO (to compensate for feared loss of Pb during firing) have been calcined first for 3.5 h 1050°C, and then at 1290°C for 1 h. The 3rd firing (about 5 h) at 1270°C has branched into quenched (PNOQ or PNOQL)7 and slow-cooled (PNS) samples.
HT XRD study
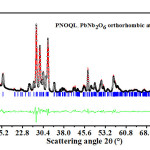
Using Cu Kα radiation with α1 = 1.54056 Å and α2 = 1.54439 Å, generator voltage = 40 V, tube current = 30 A, scan step size = 0.02, and scan step time = 0.50 s, x-ray powder diffraction has been carried out (Figs. 1-5)at different temperatures on PNOQL sample: 30°C, 550°C, 570°C and 590°C. After soaking at 590°C for about 1hour, the powdered sample has been cooled back, and XRD has been taken again at 30°C. Rietveld refinements3 have next been done, as depicted in Figs. 1 & 3-5, to extract lattice parameters, given in Table 1, and a pictorial representation (Fig. 2).
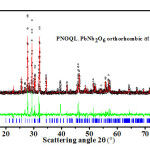
Figure 1: Open circle symbols (black), giving XRD data, for PNOQL at 30°C, fit closely the Rietveld refined plot (the continuous red curve in the main graph). Their difference is shown by the continuous curve in the smaller-sized graph (green in color). The vertical bars (blue color) in the main graph are the calculated peak positions
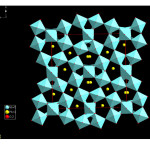
Figure 2: Pictorial view of the orthorhombic PbNb2O6 structure in PNOQL.
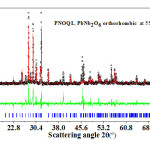
Figure 3: Open circle symbols (black), giving XRD data, for PNOQL at 550°C, fit closely the Rietveld refined plot (the continuous red curve in the main graph). Their difference is shown by the continuous green curve in the smaller-sized graph. The vertical bars (blue) in the main graph are the calculated peak positions.
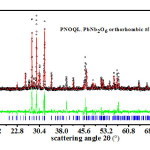
Figure 4 : Open circle black symbols, giving XRD data for PNOQL at 570°C, fit closely the Rietveld refined plot (the continuous red curve in the main graph). Their difference is shown by the continuous green curve in the smaller-sized graph. The vertical blue bars in the main graph are the calculated peak positions.
Figure 5 : Open circle symbols (black colour), giving XRD data for PNOQL at 590°C, fit closely the Rietveld refined plot (the continuous curve in the main graph, red colour). Their difference is shown by the continuous curve in the smaller-sized graph (green colour). The vertical bars (blue colour) in the main graph are the calculated peak positions.
Table 1: Lattice parameters of PbNb2O6 as a function of temperature (orthorhombic below Curie temperature and tetragonal above).
|
Temperature (°C)
|
a (Å)
|
b (Å)
|
c (Å)
|
α = β = γ (°)
|
Unit cell volume (Å3)
|
|
|
30(before)
|
17.651(5)
|
17.948(4)
|
3.873(4)
|
90.00
|
1227.145
|
|
|
550
|
17.758(7)
|
17.787(5)
|
3.920(2)
|
90.00
|
1238.317
|
|
|
570
|
17.781(5)
|
17.791(3)
|
3.921(7)
|
90.00
|
1240.624
|
|
|
590
|
17.778(1)
|
17.793(7)
|
3.922(8)
|
90.00
|
1240.939
|
|
|
30(after)
|
17.670(5)
|
17.984(1)
|
3.876(4)
|
90.00
|
1231.865
|
|
TEM examination
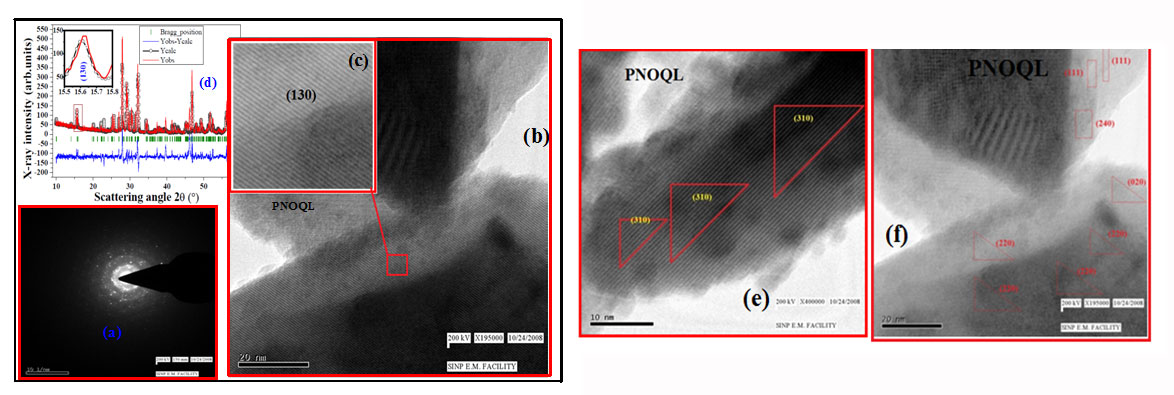
Practically the same inter-layer separation (d) (in table8 2)has been obtained by Transmission Electron Microscopy (Fig. 6, d(TEM)), and by x-ray, d(XRD), for the orthorhombic PbNb2O6 sample at room temperature.
Figure 6 TEM diffraction pattern (a) and images of different atomic planes of PNOQL sample (b, c, e and f) and inset view of XRD (d). It shows planes in (b) and (c), plane in (e), and , , and planes in (f).
Table 2: Comparison of inter-planar separations, d, of orthorhombic PbNb2O6sample, as found by Transmission Electron Microscopy (TEM) and X-Ray Diffraction (XRD).
|
Sample Name
|
dTEM(Å)
(TEM)
|
dXRD (Å)
(XRD)
|
Plane
|
2θ orBragg’s angle (°)
|
|
PNOQL
(Orthorhombic PbNb2O6)
|
5.5878
|
5.5770
|
310
|
15.88
|
|
5.6244
|
5.6629
|
130
|
15.62
|
|
3.75695
|
3.6904
|
111
|
23.02
|
|
4.0003
|
3.9463
|
240
|
22.20
|
|
6.2894
|
6.2889
|
220
|
14.06
|
|
9.1141
|
8.9688
|
020
|
9.85
|
Result and Discussion
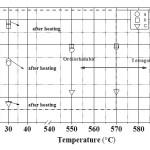
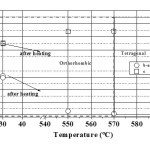
The temperature variation of lattice parameters (a, b and c) of the orthorhombic PNOQL sample, from room temperature (RT) to 590°C and return to RT, has been shown graphically in Fig. 7. This matches well with the original work of Francombe and Lewis.9 As the temperature is raised from 30°C to ~ 550°C, the lattice parameter ‘a’, indicated by open circle, increases (from 17.6515 Å to 17.7587 Å) and the lattice parameter ‘b’, indicated by open rectangle, decreases (from 17.9484 Å to 17.7875 Å) so that the two approach a common value beyond ~ 570°C, the temperature for transition from orthorhombic to tetragonal structure.9-10 This corresponds also to the Curie temperature, above which piezoelectric and ferroelectric properties disappear to pave the way for a para electric phase. Plot of (b-a) vs. temperature in Fig. 8 also shows a decrease of (b-a) towards zero. Over the temperature range 30°C to 590°C the ‘c’ parameter, indicated by open down triangle, increases linearly (from 3.8734 Å to 3.9228 Å). Unit cell volume is seen in Fig. 9 to increase rapidly with temperature in the orthorhombic phase, and only slightly above Curie temperature. The powdered sample has been heated from 30°C to 590°C, soaked at 590°C for about 1 hour and then cooled down to 30°C. Parameters a, b and c have been re-measured by XRD at 30°C. The values of lattice parameters increase slightly after this 590°C cycling (with soaking at the high temperature) of the samples: a (~ 0.107%), b(~ 0.198 %), and c(~ 0.078 %) with Fig. 7 showing the value after the heating (cycle) by the upper point with same symbol.
Lattice dimension measured by TEM from different spots of the orthorhombic PbNb2O6 sample match the averaged value measured by x-ray diffraction, confirming the correctness of both characterizations. The high temperature structure is tetragonal.Electrical11 and thermal12 techniques showed the Curie temperature to be above 570°C. Below Curie temperature, a < b < c, and the sample is ferroelectric with piezoelectric properties.
Loss of piezoelectric properties11,12 above this temperature is accompanied by increase of a, and decrease of b, to make a = b, as indicated in our (b-a) vs. T plot. Unit cell volume is seen to increase rapidly with temperature in the orthorhombic phase, and only slightly above Curie temperature. It is a new observation that room temperature cell volume increases on heating the sample to 590°C and cooling back to room temperature.
Figure 7 Graphical representation of the variation of lattice parameters a, b, and c with temperature cycling.
Figure 8 Variation of the difference (b – a) and c with temperature.
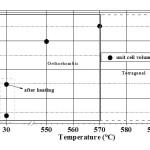
Figure 9 Variation of unit cell volume of PbNb2O6 (V, Å3) with rise in temperature from 30°C to 590°C as calculated from present XRD results. On heating the sample to 590°C and cooling back, there is an increase of volume.
References
- De U., Sahu K. R and De A. Solid State Phenomena. 2015;232:235.
CrossRef
- Goodman G. J. Am. Ceram. Soc. 1953;36:368.
CrossRef
- Chakraborty K. R., Sahu K. R., De A and De U. Integ. Ferro. 2010;120:102.
CrossRef
- Sahu K. R and De U. J. Solid State Phys. 2013:1.
- De U.,Sahu K. R., Chakraborty K. R and Pratihar S. K. Integ. Ferro. 2010;119:96.
CrossRef
- Sahu K. R and De U. Thermochimica Acta. 2009;490:75.
CrossRef
- Mezheritsky A. IEEE Transactions Ultrasonics Ferroelectrics, Ferroelectrics and Frequency Control. 2015;62:1717.
CrossRef
- Sahu K. R. Thesis: Study of some piezoelectric and other oxides and of their polymeric composites for applications, Index no: 183/10/phys.20, Jadavpur University, Kolkata. 2015;126.
- Francombe M. H and Lewis B. Acta. Crystallogr. 1958;11:696.
CrossRef
- Subbarao E. C. J. Am. Ceram. Soc. 1960;43:439.
CrossRef
- Sahu K. R and De U., J. Materials. 2013;2013:1.
CrossRef
- Sahu K. R and De U. Thermochimica. Acta. 2014;589C:25.
CrossRef

This work is licensed under a Creative Commons Attribution 4.0 International License.