Shiveom Srivastav
Department of applied science, Ambalika institute Lucknow India.
DOI : http://dx.doi.org/10.13005/msri/130208
Article Publishing History
Article Received on : 18 Jun 2016
Article Accepted on : 04 Jul 2016
Article Published : 24 Aug 2016
Article Metrics
ABSTRACT:
The alloy Ge10Se20 Bi80 has been prepared. Thin films of Ge10Se20 Bi80 has been prepared via a thermal evaporation method (melt quenching technique) with 3000A thickness, and rate of deposition (4.1) A/sec at pressure 2x10⁻⁵ Torr. The A.C electrical conductivity of a- thin films Ge10Se20 Bi80 has been studied as a function of frequency for annealing temperature within the range (423-623) K, the deduced exponent s values, was found to decrease with increasing of annealing temperature through the frequency of the range (102-106) Hz. It was found that, the correlated barrier hopping (CBH) is the dominant conduction mechanism. Values of dielectric constant ε1 and dielectric loss ε2 were found to decrease with frequency and increase with temperature. The activation energies have been calculated for the annealed thin films.
KEYWORDS:
AC-conductivity chalcogenide thin films; Dielectric constant; Polarization
Copy the following to cite this article:
Srivastav S. Analysis of AC-conductivity in chalcogenide Ge10Se20 Bi80Thin Film. Mat.Sci.Res.India;13(2)
|
Introduction
Chalcogenide materials have a great potential in phase-change random access memory (PRAM) devices are regarded to be a strongly promising candidate for the next generation nonvolatile memory (Doo Seok Jeong et al, 2011). These glasses are sensitive to the absorption of electromagnetic radiation and show a distinct photo induced effects. These properties show potential for numerous applications in active and passive optics (Mikhail Kibalchenko et al, 2010). Currently, amorphous materials can be electrically insulating, semiconducting or metallic in nature. Amorphous semiconductors have attracted immense interest in the field of phase change memory (PCMs) applications due to their electrical and optical properties and are potential candidates for many commercial applications. Phase change memories based on chalcogenide glasses have been found to be suitable candidates for replacing the conventional flash non-volatile random access memories (NVRAMS).They exhibit two types of switching behavior; threshold and memory switching, and this switching behavior is central to their technological importance and their uses as memories (Mohammad Mahbubur Rahman et al, 2013). The studying of ac-conductivity σ a.c (w) gives us information about the nature of the conduction mechanisms in a material. This conductivity σ a.c(ω) can be represented by the empirical formula which follows a power low of the forms (A. M. Badr et al, 2011)
σ a.c (ω)=A ω2 (1)
Where, the frequency exponent lies in the range 0<s
s=d(ln σ (ω)/d(ln ω)) (2)
Where ω: is the angular frequency.
A study of the frequency and temperature dependence of dielectric losses should provide information on relaxation processes. In the presence of relaxation effects, the dielectric constant may be given by:
ε*(ω)=ε1(ω)+iε2(ω) (3)
Where ε1(ω): the real part of the complex dielectric (dielectric constant) and ε2(ω) is the imaginary part(dielectric loss factor). The real part of dielectric constant could give by:
ε1(ω)=tC/a εo (4)
Where (εo) is permittivity of the space (8.854×10⁻¹²Fm-1),(a) is the effective electrode area, and (C) is the capacitance of the sample while the imaginary part is given by:
ε2(ω)= σ (ω)/εo ω (5)
We can get σ a.c(ω) by (M.I.Mohammed et al, 2002).
σ a.c. (ω) =t/A.R (6)
tanδ= ε2(ω)/ ε1(ω) (7)
Where tanδ is dissipation factor
Describes the phase difference between the current and voltage with respect to the applied ac electric field. The dependence of a.c. conductivity σ a.c. on temperature is usually obey the well-known relation (M.I.Mohammed et al, 2002):
σ a.c. = σ ο exp (- ΔE / KT) (8)
Where σ ο, is constant, ΔE is the activation energy, T is the absolute temperature and K is Boltzmann constant.
Experimental parts
An alloy of Ge10Se20Bi80 has been prepared in evacuated quartz tube by the melt quenching technique from elements of high purity (99.999%).The Ge10Se20Bi80 thin films deposited via the thermal evaporation method on glass substrate at room temperature of 3000Ȧ and rate of deposition (4.1) Ȧ /sec.The thin Ge10Se20Bi80films were prepared in sandwich configuration between two Al electrodes. For A.C. measurement we used HP.R2C unit, models 4274 A and 4275 A, and multi frequency LRC meter to generate a.c current in the frequency of the (102-106) Hz. The prepared thin films were annealed at 423,523 and 623K for 1/2 hour.
Results and conclusions
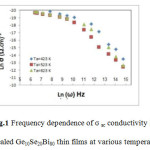
Present paper reports the frequency and temperature dependent of ac conductivity of Ge10Se20Bi80 thin films in frequency of the range (102-106) Hz. Fig. (1) Show the variation of σ ac conductivity (ω) as a function of frequency of Ge10Se20Bi80thin films at various annealing temperature Ta=423,523 and 623K. This figure reveals that ln σ a.c.(ω) which represented in equation (1) increases linearly with ln(ω) at different annealing temperature in the range from 423K to 623K. The power law dependence of ac conductivity is of a universal nature and corresponds to short range hopping of charge carriers through trap sites separated by energy barriers of varied heights. Each pair of potential well corresponds to a certain time constant of transition from one site to another. We can notice from Fig.(1) that ac-conductivity dominates at higher frequency than at the lower values, which means that the σ a.c. conductivities increases with increasing frequency. The phenomenon has been ascribed to relaxations caused by the motion of electrons or atoms. Such motion can involve hopping or tunneling between equilibrium sites (S.R. Elliott, 1987). The values of the frequency exponent s which presented in equation (2) were estimated from the slope of straight lines in Fig. (1).The annealing temperature dependence of the s for investigated films is shown in table (1).Table1 Represented the s values versus annealing temperature. It observed from table (1) that is a little difference between the calculated values of s, this may be due to the hopping process, also its values decreases with increasing annealing temperature. In most chalcogenide semiconductors the values of s from 0.7 to 1.0 at room temperature, and showed a tendency to decrease with increasing temperature. Therefore, the CBH has been extensively that the obtained experimental results agree with CBH in some values of annealing temperature of charge carriers across the defect state D+ and D- (H. E. Atyia) et al, 2008). According to Ghintini model (J.C.Giuntiniet al, 1981), each pair of D+ and D- assumed to form a dipole with relaxation energy this type of energy can be attributed to the existence of a potential barrier over which the carriers hop (H. E. Atyiaet al, 2008).
Figure 1: Frequency dependence of σ ac conductivity for annealed Ge10Se20Bi80 thin films at various temperatures
Table 1
|
|
Annealing temperature(K)
|
|
|
423 K
|
523K
|
623K
|
|
Capacitance(s)
|
0.922
|
0.901
|
0.873
|
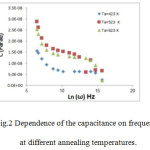
Fig.(2) show the variation of capacitance with frequency at various annealing temperatures in the range (423-623) K. the capacitance initially decreases rapidly with increasing frequency.
Figure 2: Dependence of the capacitance on frequency at different annealing temperatures.
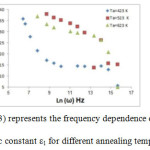
Frequency and temperature dependence of the dielectric constant ε1Dielectric analysis measures the electric properties of a material as a function of temperature and frequency. It measures two fundamental electrical characteristic of materials: the capacitive (insulating) nature, which represents its ability to store electric charge, and the conductive nature, which represents its ability to transfer electric charge. The variation of the dielectric constant ε1 with frequency and temperature was studied for the investigated film. It is observed that ε1 decreases with frequency and increases with temperature for the range of frequencies (100 Hz- 20000 Hz). After this range the behavior was changing to inverse behavior. The decrease in ε1 with increasing frequency can be attributed to the contribution of the many components of polarization, electronic, ionic, dipolar or orientation and space charge. First, valance electrons relative nucleus. This type of polarization occurs at frequencies up to 1016 Hz. Second, ionic polarization occurs due to the displacement of negative and positive ions with respect to each other. The maximum frequency of ionic polarization is 1013 Hz. Third, dipole polarization occurs as a result of the presence of molecules with permanent electric dipole moments that can change orientation into direction of the applied electric filed. Dipole polarization occurs at frequencies up at about 1010 Hz. Finally, space-charge polarization occurs due to impedance mobile charge by interface. Space-charge polarization. Typically occurs at frequencies between 1 and 103 Hz. The total polarization of dielectric material can be represented by the sum of these four polarizations (M.W Barsoum,1977).
Figure 3: represents the frequency dependence of the dielectric constant ε1 for different annealing temperature
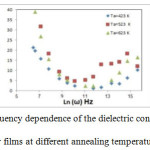
Fig.(4) shows the frequency dependence of dielectric loss ε2 at different annealing temperatures. it can be noticed from the figure that ε2 decreases with increasing frequency and increases with temperature throughout the range (100Hz- 20000 Hz) of frequency and temperature, then the behavior change to inverse behavior. The increase of ε2 with increasing temperature can be interpreted on the basis of the relaxation phenomena, which is divided into three parts; conduction loss, dipole loss and vibration loss. The losses that are attributed to conduction presumably involve the migration of ions over a large distance. This motion is the same as that occurring under direct current conditions. The ions jump over the highest barriers in the network. As the ions move, they impart some of the energy to the lattice as heat and the amount of heat lost per cycle is proportional to σa.c(ω) (J. M. Stevels,1957) . At low temperature values, conduction losses, dipole losses and vibration losses have minimum values. However, at higher temperatures, conductions, dipole and vibration losses all contribute to the dielectric loss. This will lead to an increase in ε2 with increasing temperature.
Figure 4: Frequency dependence of the dielectric constantε2 (ω) for films at different annealing temperature.
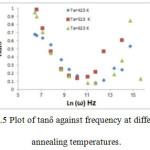
Fig.(5) shows the frequency dependence of loss tangent(tan δ) at different temperatures for a typical film Ge10Se20 Bi80 of thickness 230 nm. Tan δ has been found to increase with frequency at different temperatures, pass through a maximum value (tan δ) max and thereafter decreases. As the temperature is increased, the frequency at which (tan δ)max occurred shifted to higher frequencies. This type of behavior is similar to that described by Simmons (Safa’s M. Hraibat et al, 2013) for films having parallel RC elements of the materials in series with a parallel combination of Schottky barriers capacitance and resistance.
Figure 5 Plot of tanδ against frequency at different annealing temperatures.
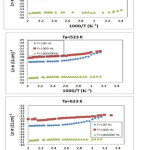
Variation of ln σac (ω) versus 1000/T for thin films Ge10Se20 Bi80 for different frequencies It is clear that at low temperatures and frequencies the conductivity is frequency dependent; however, with increasing temperature the conductivity becomes frequency independent, remaining almost constant throughout the entire frequency range. The strong temperature dependence may be due to the increase of the density of neutral defects Do (single-polaron states) at a higher temperature. The contribution toσ ac (ω,T) from(CBH) of single polarons exceeds that of bipolarons at a high temperature (Sevi Murugavel and Manisha Upadhyay, 2011), i.e. the CBH of single polarons is then the predominant contribution to the AC conduction at higher temperature. The deduced values of activation energy reported in table (2) for various values of annealing temperature. The activation energy decreases with increasing frequency. The low value of the ac activation energy and the increase of σ ac(ω), with the increase of frequency confirm that hopping conduction is the dominant current transport mechanisms. Thus, the increase of the applied frequency enhances the electronic jumps between the localized states; consequently, the activation energy ΔE, decreases with increasing frequency (M.S. Hossaina et al, 2008).
Figure 6: Variation of ln σac (ω) versus 1000/T for thin films Ge10Se20 Bi80 for different frequencies
Table 3
|
Ea.c(eV)
|
|
Temperature(K)
|
|
423K
|
523K
|
623K
|
|
Frequency(Hz)
|
102Hz
|
0.1820
|
0.191
|
0.211
|
|
|
103Hz
|
0.1510
|
0.146
|
0.121
|
|
|
106Hz
|
0.0420
|
0.02900
|
0..320
|
Conclusions
Experimental results of the AC conductivity of the studied films seem to be frequency and temperature dependence. The values of the frequency exponent s are found to be temperature dependent, decreasing with increasing temperature. This confirmed the applicability of the CBH model. Both dielectric constant ε1 and the dielectric loss ε2 increased with temperature and decreased with frequency within the range (100 Hz-20000 Hz).The activation energy decreases with increasing frequency. And the increase of σ ac(ω), with the increase of frequency confirm that hopping conduction is the dominant current transport mechanisms.
References
- 1-Mikhail Kibalchenko, Jonathan R. Yates, Carlo Massobrio, Alfredo Pasquarello, Structural assignments of NMR chemical shifts in GexSe1−x glasses via first-principles calculations for GeSe2, Ge4Se9, and GeSe crystals, Physical Review B ,vol. 82, Issue 2, P.020202(R). 2010.
- Doo Seok Jeong, Goon-Ho Park, Hyungkwang Lim, Cheol Seong Hwang, Suyoun Lee and Byung-ki Cheong, Dc current transport behavior in amorphous GeSe films, Applied 498 | International Journal of Current Engineering and Technology. 2011;4(2)
- M.W Barsoum, Fundamentals of Ceramics (Series in Material Science and Engineering), McGraw-Hill, New York. 1977;543
- J. M. Stevels. The Electrical Properties of Glass, hand Book of physics. 1957;4(20):350-391.
- Shiveom,S.k ,K.k. International Journal of emerging technology. 2012;3.2:4-18.
- A.M. Badr,H.A.Elashaikh and I.M Ashraf. Journal of Engineering and technology Research. 2011;3(3):62-76.
- M.I. Mohammed,A.S.Abd-rabo and E.A.Mahmoud. A.C. Conductivity and dielectric Behaviour of Chalcogenide GexFex Se100-2x thin film,EGYPT.sol. 2002;25.(1):49-64.
- S.R. Elliott,Advances in Physics.1987;36(2)135-217.
CrossRef
- Shiveom,S.k ,K.k. International Journal of engineering studies. 2012;4(3):169-178.
- H.E.Atyia,A.M. Farid,N.A.Hegab,A.C. conductivity and dielectric properties of amorphous GexSb40-xSe60 thin films,Physica B Condensed Matter. 2008;403:3980-3984
CrossRef
- J.C.Giuntini, J.V.Zanchetta,D.jullien,R.Eholie,P.houenou. Temperature dependence of Dielectric losses in chalcogenide glasses, journal of Non –Crystalline Solids,1981:45:57.
- Mohammad Mahbubur Rahman, 2K. Rukmani and 3Suman Chowdhury,Effect of Thallium .Addition on Thermal and electrical properties of Germanium Telluride Chalcogenide Glasses International Journal of Engineering research and Technology. 2013;2:12:390-394
- Shiveom srivastava International Journal of technology management and humanities e-ISSN 02454,566xComposition dependence of photoconductivity in chalcoginide glasses. 2(1).
- Safa,A.M. Hraibat,Rushdi,M.J.Kitaneh,Mohammad M Abu Samreh Abdelkarim M. Saleh., AC-electronic and dielectric properties of semiconducting phthalocyanine compounds: a comparative study, Journal of Semiconductors 2013;34(11).
- Sevi Murugavel , Manisha Upadhyay, A.C. Conduction in Amorphous Semiconductors, Journal of the Indian Institute of Science. 2011;91(2):303-317.
- M.S. Hossaina, R. Islama, K. A. Khana, Electrical Conduction Mechanisms Of undoped And Vanadium Doped ZnTe Thin Films, Chalcogenide Letters. 2008;5(1):1-9.
- Shiveom,S.k ,K.k International Journal of Applied research and studies. 2012;1(1):148.
- shiveom srivastava International Journal of technology management and humanities e-ISSN 02454,566x temperature dependent and optical properties of Bi based Ge-Se glasses. 2(1)

This work is licensed under a Creative Commons Attribution 4.0 International License.