A. S. Bhattacharyya1, 2 *, P. Kumar1, N. Rajak1, R.P.Kumar1, A. Sharma1 and G. Acharya1, V.Ranjan1
1Centre for Nanotechnology
2Centre of Excellence in Green and Efficient Energy Technology (CoE-GEET) Central University of Jharkhand
Brambe, Ranchi: 835205.
Corresponding Author Email: 2006asb@gmail.com
DOI : http://dx.doi.org/10.13005/msri/130203
Article Publishing History
Article Received on : 12-Oct-2016
Article Accepted on : 17-Oct-2016
Article Published : 17 Dec 2016
Plagiarism Check: Yes
Article Metrics
ABSTRACT:
Nanoindentation is an effective way of finding mechanical properties at nanoscale. They are especially useful for thin films where elimination of the substrate effect is required. The mechanism is based upon depth sensing indentation based on Oliver and Pharr modeling. The load-depth curves as well as time on sample were analyzed. Indentation impulse was found to have significant contribution in the nature of failure zone during indentation. Fracture toughness was also related to time on the sample.
KEYWORDS:
load-depth; Impulse; Nanoindentation; Time on sample
Copy the following to cite this article:
Bhattacharyya A. S, Kumar P, Rajak N, Kumar R. P, Sharma A, Acharya G, Ranjan V. Analyzing Time on Sample During Nanoindentation. Mat.Sci.Res.India;13(2)
|
Copy the following to cite this URL:
Bhattacharyya A. S, Kumar P, Rajak N, Kumar R. P, Sharma A, Acharya G, Ranjan V. Analyzing Time on Sample During Nanoindentation. Mat.Sci.Res.India;13(2). Available from: http://www.materialsciencejournal.org/?p=4583
|
Introduction
Nanoindention is a method to characterize material mechanical properties on a very small scale due to its high spatial and depth resolution of the measurement.1.2 Features less than 100 nm across, as well as thin films less than 5 nm thick, can be evaluated. Test methods include indentation for comparative and quantitative hardness determination and scratching for evaluation of wear resistance and thin film adhesion. It has been also used to determine creep properties of materials based on time on sample.3-5
For indentation, the probe is forced into the surface at a selected rate and to a selected maximum force. Nanoindentation studies were performed on the films by Nanoindenter XP (MTS, USA).6 Both bulk modulus (E) and hardness (H) are found from nanoindentation. Advantage lies in possibility of very small indentation (depth of the order of 100nm). Thus it is useful in the case of thin films.During nanoindentation a Berkovich indenter with 70.3˚ effective cone angle pushed into the material and withdrawn. The indentation load and displacement were recorded The hardness and elastic modulus are calculated simultaneously whose equations have been published previously7
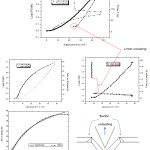
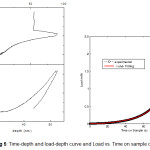
Nanoindentation can be used to measure the creep behavior by fitting the depth vs. time data at constant load. There are three models for measuring the creep constant the standard linear solid, Burgers model, and a two-dashpot Kelvin model. The creep time constants have been reported to increase monotonically with increasing holding time for all three models. However, the Burgers model has been found to be best of the three in terms of fitting and was recommended for further studies.8 A nanoindentation load-displacement –time plot is shown in Fig 1. In this study we have focused on both the loading as well as unloading portion of the curve which has been shown separately. The time on sample with displacement plot is show in Fig 2 which was fitted by a quadratic polynomial given as T= p1*d^2 + p2*d + p3 with coefficients: p1 = – 0.037791; p2 = 3.4347 and p3 = – 4.3462. Interestingly a gap in the time profile was observed corresponding to the linear region of the load depth curve. The linear unloading arises due to push back of the buckled region just beneath the indenter.9 An illustration is shown in the figure.Buckling occurs to release the compressive stress. The linear unloading region is about 3 nm where the push back force is about 0.25mN acting for a time period of 50 seconds which gives a stiffness of 84 N/m and impulse of 12.5 mNs.
Figure 1 :Time on the sample curves for loading and unloading portion of the load depth curves
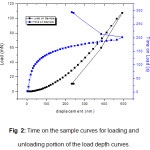
Figure 2: Time on the sample curves for loading and unloading portion of the load depth curves.
The load depth curve during unloading may also show some different features during the final stages of unloading as shown in Fig 2 where the material instead of a push back goes down just beneath the indenter. We can call this linear loading in analogy to linear loading as observed in the previous case. The reason of this phenomenon might be plastic deformation of the substrate on which a hardcoating has been deposited.
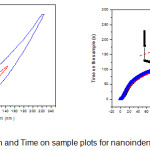
Figure 3: Load-depth and Time on sample plots for nanoindentation at different depths
The load vs displacement and corresponding time on sample plots for different final depths of penetration is shown below. It can be observed that due to different plastic energy involved, time on the sample plot end up at different depths. The region due to linear unloading is however same in all the three cases as shown by an arrow indicating the property is not influenced by loading. The parameter that differs in the three cases is the impulse which was obtained by integrating the load vs time on sample plots as shown in fig 3.
Figure 3: Time-Load and Impulse plots for Nanoindentation at different loads
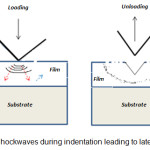
The impulse plays a major role in indentation fraction. Indentation with the same load but different impulse (due to different time on sample) may cause different failure responses.10 A lower impulse will lead to radial crack formation whereas higher impulse indentation will provide higher shock wave which gets reflected from the films surface interface making chances of buckling, delamination and chipping more. The effect of substrate will be also much higher for indentations done at higher impulse. This is the reason while we get radial cracks during loading when the impulse is low and lateral crack during unloading when the impulse is high11,13 (Fig 4).There exists a characteristic inelastic volume just beneath the sharp indenter where compressive stresses provide resistance to crack propagation. An increase in load however makes the cracks grow faster than inelastic volume. Although radial cracks may get deviated due to crystallographic orientation, the lateral cracks follow the stress field due to shock waves and are not affected by crystallography. A crystallographic anisotropy also leads to extra crack generation and the energy is not spent in crack propagation.14 These high impulse shock waves are the reason of flow of material surrounding the indentation impression which takes different geometrical shapes.A method different to nanoindentation called impulse excitation method which involves measuring two natural vibrational modes frequencies is shown in ref.15
Figure 4: Shockwaves during indentation leading to lateral cracks
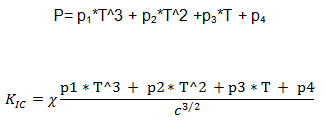
The idea of using indentation to evaluate fracture toughness was initially started with radial cracks obtained during Vicker’s Indentation. It has been observed that the crack propagation in not always purely radial but develops branches or microcracks which has been explained to be arising due to stress induced crystallization. According to Moradkhaniet. al the micro cracks can be assumed to have a regular shaped geometry and used in fracture toughness calculation. The area has been taken as rectangular with length c and thickness t such that c=A/t where A is the micro crack area. The fracture toughness is then given by
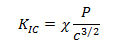
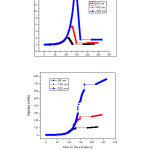
Where the constant χ = ζ (E/Hv)1/2 where ζ is a dimensionless empirical constant having value 0.016 approximately.16 The load on the sample was plotted with respected to time and the loading portion of the curve was fitted numerically as shown in Fig 5. The relation obtained between load and time on sample (with Coefficients: p1 = 4.4326e-06; p2 = -0.00034378; p3 = 0.0098697 p4 = -0.048249) as given below was again used in the fracture toughness relation with time on the sample.
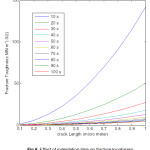
Only coefficient of P2 is of significance and others can be neglected as their variation will not cause any major change in the total value. The effect of fracture toughness for a time of 1 to 100 s is given in Fig 6.It can be observed that rapid rate of indentation leads to higher fracture toughness values. Experimental observations related to nanoindentation fracture have been published earlier.17,18,19
Figure 5: Time-depth and load-depth curve and Load vs. Time on sample curve
Figure 6: Effect of indentation time on fracture toughness
Conclusions
Time on the sample during nanoindentation was found to have significant effect on the film failure properties. Impulse was found to have a significant contribution on the nature of failure. Time on sample during nanoindentation was related to fracture toughness.Andecrease in facture toughness with an increase in indentationtime was observed.
Acknowledgements
The author acknowledges Dr. S.K.Mishra, NML Jamshedpur for nanoindentation tests
Reference
- Oliver W. C., Pharr G. M. An improved technique for determining hardness and elastic modulus using load and displacement sensing indentation experiments. Journal of Materials Research. 1992;7:1564-1583.
CrossRef
- Oliver W. C. Measurement of hardness and elastic modulus by instrumented indentation: Advances in understanding and refinements to methodology. Journal of Materials Research. 2004;19:3.
CrossRef
- He L. H., Swain M. V. Nanoindentation creep behavior of human enamel. Journal of Biomedical Materials Research A. 2009;91(2):352–359.
CrossRef
- Oyen M. L. Spherical indentation creep following ramp loading. Journal of Materials Research. 2005;20(8):2094–2100.
CrossRef
- Oyen M. L., Ko C. C. Examination of local variations in viscous, elastic, and plastic indentation responses in healing bone. Journal of Materials Science Materials in Medicine. 2007;18(4):623–628.
CrossRef
- Bhattacharyya A. S. Indentation of coatings at micro/nano scale: crack formation and deflection. arXiv:1607.06745 [cond-mat.mtrl-sci]
- Wu Z., Baker A. T., Ovaert C. T and Niebur L. G. J Biomech. 2011;7:44(6):1066–1072.
- Bull S. J. Nanoindentation of Coatings. J. Phys. D: Appl. Phys. 2005;38:393–413
- Tamin M. N. Damage and Fracture of Composite Materials and Structures, Springer.
- Burghard Z. Behaviour of glasses and polymer-derived amorphous ceramics under contact stress, PhD-Thesis, Max-Planck Institute for Metals Research & University of Stuttgart Germany
- Mishra S. K.,Bhattacharyya A. S. Silicon-based Nanomaterials Springer Series in Materials Science. 2013;187:10.
- Bhattacharyya A. S.,Mishra S. K. Journal of Micromechanics and Microengineering. 2011;21:015011
CrossRef
- CuadradoN., Seuba J., Casellas D., Anglada M., Jiménez-Piqué E. Geometry of nanoindentation cube-corner cracks observed by FIB tomography: Implication for fracture resistance estimation. JEur Ceram Soc. 2015.
CrossRef
- Chen Z.,et al., Acta Mat. 2013;61(15):5720-5734 doi:10.1016/j.actamat.2013;06.016
- Moradkhani A., Baharvandi H., Tajdari M., Latifi H. JukkaMartikainen. Journal of Advanced Ceramics 2013;2(1):87–102.
- Bhattacharyya A. S.,Mishra S. K. Journal of Micromechanics and Microengineering. 2011;21:015011.
CrossRef
- Bhattacharyya A. S., Kumar P. R., Ranjan V.,Kumar G. Nanoindentation and Scratch test of Thin Film Energy Materials. Current Smart Materials (Accepted). 2016;1 DOI:10.2174/2405465801666161130154515.
CrossRef
- User manual MTS, Nanoindentation XP, USA
- Bhattacharyya A. S., Kumar P. R., Mandal R., Kumar N., Rajak N., Sharma A., Kant S. Substrate effect and nanoindentation fracture toughness based on pile up and failure. 2016. arXiv:1602.07657[cond-mat.mtrl-sci]

This work is licensed under a Creative Commons Attribution 4.0 International License.