N. N. Sarkar1*  , K. G. Rewatkar1, V. M. Nanoti2, P. S. Hedaoo1 and M.N.Giriya3
1Department of Physics, Dr. Ambedkar College Deekshabhoomi , Nagpur , India, 440010
2Department of Applied Physics, Priyadarshani Institute of Engineering and Technology, Nagpur, India, 440019
3Department of Applied Physics, SMT. Radhikatai Pandav College of Engineering, Nagpur, India, 411204
Corresponding author Email: sarkariresearch@gmail.com
DOI : http://dx.doi.org/10.13005/msri/140214
Article Publishing History
Article Received on : 30 Nov 2017
Article Accepted on : 11 Dec 2017
Article Published :
Plagiarism Check: Yes
Article Metrics
ABSTRACT:
Ferrite samples of Zn0.5Me0.5Fe2O4 (Me = Co, Ni, and Cu) nanoparticles were synthesized by the sol-gel auto-combustion technique. Structural and magnetic properties of the samples carried out by using x-ray diffraction (XRD), vibrating sample magnetometer (VSM) respectively. On applying curve fitting of Rietveld method, unit cell dimensions, ion occupancy and exact coordinates of atoms have been determined. The cation distribution was estimated with the help of magnetization measurements and accessible occupancy of substituted ions in the crystal system. Cationic distribution was also confirmed theoretically from lattice constants calculation. The theoretically lattice constant was found to be 8.5110 Å, 8.3911 Å and 8.5229 Å for the Ni, Co, and Cu doped cations respectively. The saturation magnetization was found to be 110-148 emu/g which is good agreement with their corresponding magnetic moment and distribution of cations of their respective site preference.
KEYWORDS:
Cation distribution; Lattice parameter; Rietveld analysis; VSM; XRD
Copy the following to cite this article:
Sarkar N. N, Rewatkar K. G, Nanoti V. M, Hedaoo P. S, Giriya M. N. Cation Distribution of Zn0.5Me0.5Fe2O4 (Me = Co, Ni And Cu) on the Basis of Rietveld Refinement and Magnetization Measurement. Mat.Sci.Res.India;14(2)
|
Copy the following to cite this URL:
Sarkar N. N, Rewatkar K. G, Nanoti V. M, Hedaoo P. S, Giriya M. N. Cation Distribution of Zn0.5Me0.5Fe2O4 (Me = Co, Ni And Cu) on the Basis of Rietveld Refinement and Magnetization Measurement. Mat.Sci.Res.India;14(2). Available from: http://www.materialsciencejournal.org/?p=6563
|
Introduction
Nanosize spinel ferrites have been studied very largely due to their unique magnetic and electrical properties. The application of ferrite material relied on the various factors such as preparation method, sintering temperature, chemical composition, and distribution of cations. Magnetic interaction and distribution of cations in the tetrahedral and octahedral site play an important role in determining the applications of the material. Calculation of cation distribution between A (tetrahedral) and B (octahedral) sites for spinel ferrites has been a subject of many studies,1 since the theoretical interpretation of the chemical compositions and physical properties. ZnFe2O4 is an inverse spinel in which the tetrahedral (A) site is occupied by Fe3+ ions and the octahedral [B] site by Fe3+ and Zn2+ ion.2 We have focused our study on Nickel, Cobalt and Cupper substituted Zinc ferrites, due to their potential applications in various fields.3 Nickel – Zinc ferrite is one of the most important ferrite materials and therefore extensively applicable in high-frequency application devices due to their high resistivity and low losses.4 The substitution ions Ni2+, Cu2+, and Co2+ at Fe site may bring the variation in the properties of spinel ferrite. Keeping the importance of these substituted (Ni2+, Cu2+and Co2+) in ZnFe2O4 the present work is undertaken. The main aim of this research work is to investigate the structure using Rietveld refinement, cation distribution and magnetic properties of Zn0.5Me0.5Fe2O4 (Me = Co, Ni, and Cu). X-ray powder diffractometer (XRD) and Vibrating sample magnetometer (VSM), have been instrumental in the investigation of the structural and magnetic behavior of synthesized compounds.
Materials and Methods
Zn0.5Me0.5Fe2O4 (Me = Co, Ni, and Cu) nanoparticles were synthesized by sol-gel auto combustion method using urea as a fuel. The Stoichiometric proportions of AR grade powder of iron nitrate (Fe(NO3)39H2O), Zinc nitrate (Zn(NO3)26H2O) and Cobalt nitrate (Co(NO3)26H2O) were used while urea (NH2-CO- NH2) was introduced as a fuel. The mention chemicals were weighed in required molar proportion using a digital weighing machine. The mixture of precursor was dissolved in double distilled water in a beaker made up of borosil. The resulted solution was stirred at a constant temperature of 60°C for 4 hrs with the help of hot plate magnetic stirrer until we get a viscous gel. Then the gel was kept in a specially designed microwave oven for an instant fire at 600 watts. The entire combustion processes which produce Co-Zn spinel ferrite take only 10 minutes. Prepared ferrite powder was grinded for 4 hrs and annealed at 8000C for 4 hrs in a muffle furnace. Eventually, the powdered mass was grinded in a mortar pestle for another 4 hrs to get the final product. Similarly to synthesize Ni-Zn spinel ferrite we repeated the above procedure and replace the cobalt nitrate by nickel nitrate (Ni(NO3)26H2O) and for synthesize, Cu-Zn spinel ferrite again repeated the same procedure as discussed above only replace here Cobalt nitrate by Cupric nitrate (Cu(NO3)26H2O). The phase identification of materials has been determined with the help of XRD data similarly magnetic measurements were carried out by using VSM at room temperature. Further, the XRD data were refined through Rietveld analysis with the help of FullProf software.
Results and Discussions
Structural analysis
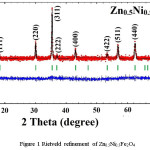
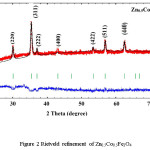
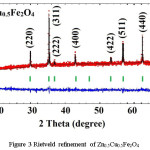
X-ray diffraction pattern along with Rietveld refinement of Zn0.5Me0.5Fe2O4 (Me = Ni, Co, and Cu) were depicted in figure 1, 2 and 3 separately. XRD pattern revealed single phase spinel structure belongs to space group Fd3m. Zn-Ni spinel ferrite shown in figure 1 has been matched with JCPDS file number 52-0278 which confirmed that the structure belongs to FCC. Also, the Zn-Co spinel ferrite shown in figure 2 has been matched with JCPDS file number 22-1086 and Zn-Cu spinel ferrite shown in figure 3 has matched with JCPDS file number 770012. The diffraction peaks at 2θ values can be ascribed to the reflection of (111) (220) (311) (400) (422) (511) (440) etc. The XRD data were analyzed through FullProf software program for the structure refinement, as shown in figure 1, 2 and 3. All the figures made up of four different colors of curves (Red, Black, Green and blue) where red color indicates the observed data and black color indicates the calculated or modulated data, where as green indicate Braggs position and blue indicates the difference between observed an calculated data. Here the Scherrer formula was employed to determine average crystallite size of studied composition.5
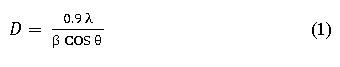
Where
λ –Corresponds wavelength of Cu. Kα radiation
β is known as full width half maximum of diffraction peak.
θ is the Bragg angle.
It has been noticed that the crystallite size changes with variation with ionic-radii, similar advertence was recorded with a lattice constant. which is calculated experimentally using equation 2, theoretically using equation 3 and from Rietveld method,6 as shown below.7
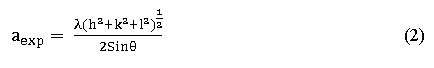
Where ‘aexp ’ is the lattice constant experimentally and (h k l) represents Miller indices for various planes,
θ is Bragg angle.
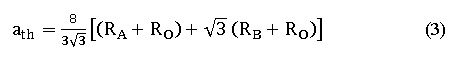
Where ath is the theoretically lattice constant, RA is the radius of A site, Ro is the radius of Oxygen and RB is the radius of B site.
Figure 1: Rietveld refinement of Zn0.5Ni0.5Fe2O4
Figure 2: Rietveld refinement of Zn0.5Co0.5Fe2O4
Figure 3: Rietveld refinement of Zn0.5Cu0.5Fe2O4
Table 1 shows the lattice parameter calculated from all the above methods, as well as Bragg R factor and the value of χ2. Values of lattice constant has been increases with substitution of larger ionic radius (Ni2+ = 0.8 Å, Co2+ = 0.83 Å and Cu2+ = 0.91 Å). We notice that the Bragg R factor and the values of χ2 are very much reliable because if the χ2 range is in between 1-8 then the goodness of fitting approach towards the particular structure. In the present study value of goodness (χ2) is less for the Zn0.5Cu0.5Fe2O4 sample. This is because the distribution cations and anions were perfectly situated of their appropriate position in the unit cell the renaming two sample also have the reliable goodness of fitting as shown in table 1.8,9
Table 1: Lattice parameter and XRD data
|
Sample
|
aexp(Lattice parameter experimentally)Å
|
ath(Lattice parameter Theoretically)
Å
|
aRiet(Lattice parameter Rietveld method) Å
|
Crystallite size (nm)
|
Bragg R factor
|
χ2
|
|
Zn0.5Ni0.5Fe2O4
|
8. 3891
|
8.5110
|
8.4098
|
32
|
31.8973
|
3.90
|
|
Zn0.5Co0.5Fe2O4
|
8.3911
|
8.5191
|
8.4118
|
37
|
61.6174
|
6.29
|
|
Zn0.5Cu0.5Fe2O4
|
8.5229
|
8.6213
|
8.5968
|
51
|
31.7149
|
3.86
|
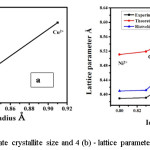
Figure 4 (a) depicts a graphical representation of the value of crystallite size versus the corresponding value of ionic radii and figure 4(b) represents lattice parameters against ionic radii of a cations, which confirmed that an entry of ions into the specific lattice site and variations in the rates of reaction for each specific ion.10,11,12 It is prominently noted (figure 4 (b)) that the lattice parameters enhances with the ionic radii. It is observed from figure 4(b) that the lattice variance increases with the substitution of Ni2+, Co2+, and Cu2+ and hence we may say lattice parameter is very sensitive to the ionic radius of metal ions.13 In order to explain crystallite size in the context of ionic radii and electronic configuration of various doped cations. We may say that the electrons of Ni2+, Co2+, and Cu2+ ions were configured as 1s 2s 2p 3s 3p 3d, here up to 3p sub-shell electrons were completely occupied but for 3d sub-shell is different. In the case of Cu2+ ion there are 27 electrons, out of which 9 electrons were occupied in 3d sub-shell therefore, it contains 1 unpaired electron, similarly, Ni2+ and Co2+ have 2 and 3 unpaired electrons respectively. As the number of unpaired electrons increased in 3d orbital as well as it loses its electron from the respective ions. During these phenomenon protons from the nucleus were attracted the outer most electrons of 3d sub-shell and come closer to 2p orbital. So the electrons from 2p orbitals have been strongly repelled the electrons of 3d orbitals. If the number of electrons in 3d sub-shell is minimum then the repulsion between 2p and 3d also minimum therefore size of atoms also gets smaller and hence the crystallite size is depends on ionic radii as well as electronic configuration as shown in figure 4(a).
Figure 4 (a): Aggregate crystallite size and 4 (b) – lattice parameter against ionic radius.
Magnetic properties
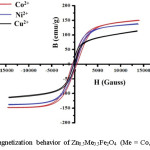
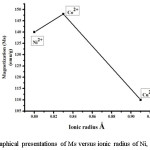
Figure 5 describes the field dependence of saturation magnetization obtained at room temperature. It is observed that the saturation magnetization is highest for the composition of Zn0.5Co0.5Fe2O4 and lowest for Zn0.5Cu0.5Fe2O4.14 The change in saturation magnetization with a respective ionic radius of different metal cations as shown in figure 6
Figure 5: Magnetization behavior of Zn0.5Me0.5Fe2O4 (Me = Co, Ni and Cu)
Figure 6: Graphical presentations of Ms versus ionic radius of Ni, Co, and Cu
In the system of Zn0.5Co0.5Fe2O4, Co2+ cations has been partially distributed among both the sides of A- site and B-site because Co2+ has the tendency to occupy 10% in A-site and remaining 90 % in B –site15 The magnetic moment concerned with cobalt ion is 3µB, which is less than the magnetic moment of Fe3+ ion (5 µB). Moreover, Fe3+ ions are known to occupy on both the sites, therefore, anti-parallel interaction does not happen for similar site preference of different cationic charges (Fe3+ and Co2+). Hence the magnetic moment of individual sites goes on increases which cause enhancement of total magnetization of the cobalt ferrite system as shown in table 2. Zn2+ has zero magnetic moments so it does not have the capability to cancel out the magnetic moment of Co2+ ion even if they are occupied at the same site. The overall magnetization of all the samples was based on the site preferences of cation as described in table 2. To support VSM result we have compared the magnetic moment of the system theoretically and experimentally using relation
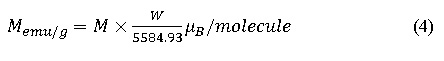
Where M is the magnetization in emu/g and W is known as the molecular weight of the sample. The magnetic moment calculated from cation distribution and from VSM results are in fair agreements.
In the present study cation distribution of Zn0.5Me0.5Fe2O4 (Me = Co, Ni, and Cu) (table -2) as is put forth with the base of magnetic moments calculated from saturation magnetization. Accommodation of Co2+ ions in A- site has been appraised to be about 10% to gives the better possible cation distributions.16. Similarly, in case of Cu2+ ferrite system, 10% of Zn2+ ions shifted towards B- site and reduced the net magnetization of Zn0.5Cu0.5Fe2O4 as mentioned in table 2.17 The Bohr magnetons calculated from cation distribution and calculated from VSM measurements are approximately same.18 Equation 2 and 3 were explored to find out the value of ‘a’ and also matched by Rietveld method.19
Table 2: Magnetization and Cation distribution
|
Sr. No
|
Distribution of cation
|
Saturation Magnetization (Ms)
(emu/g)
|
Remanence (Mr) (emu/g)
|
Coercivity (Hc) (Gauss)
|
Bohr magnetons )
|
|
|
Theoretically
|
Experimental
|
|
1
|
(Zn0.5 Fe0.5 ) [Ni0.5 Fe1.5]O4
|
140
|
21
|
522
|
6
|
6.302
|
|
2
|
(Zn0.5 Co0.05 Fe0.5 )[Co0.45 Fe1.5]O4
|
148
|
23
|
610
|
6.2
|
5.951
|
|
3
|
(Zn0.45 Cu0.5Fe0.5) [Zn0.05 Fe1.5] O4
|
110
|
25
|
140
|
4.5
|
4.730
|
Conclusions
Sol –gel auto combustion technique has successfully produced nanocrystalline Zn0.5Me0.5Fe2O4 (Me = Co, Ni, and Cu). XRD measurements and the values of χ2 confirmed all the material has single phase spinel structure. Lattice parameter has been measured with three different methods which are nearly equal to one another and increase with larger ionic radius. The enhancement of crystallite size has been observed with greater ionic radius. The distribution of cation for all the samples has been estimated with the help of saturation magnetization, which is justified by (ath) theoretical lattice parameter. The experimental and theoretical values of lattice constants are concurrent fairly in all compounds. Also, the values of Bohr magneton for both (experimental as well as Theoretical) the cases are approximately equal in magnitude.
Acknowledgement
One of the Author N.N. Sarkar acknowledges to the Department of Physics of Dr. Ambedkar College, Deeksha Bhoomi, Nagpur for extending their support to carryout research work. Author N.N Sarkar also thankful to Dr. N.T. Tayade for the valuable discussion.
References
- Ata-Allah S. S.,Balagurov A. M., Hashhash A., Bobrikov I. A., Hamdy S. Phy. B. Cond. Mater. 2016;481:118–123.
CrossRef
- Li L. Z., Zhong X. X., Wang R., Tu X. Q. J. Magn. Magn. Mater. 2017;435:58–63.
CrossRef
- Rondinone A. J.,Samia A. C. S., Zhang Z. J. J. phy. chem.B. 1999;103:6876–6880.
- Ahamad H. S., Meshram N. S., Bankar S. B.,Dhoble S. J., Rewatkar K. G. Ferroelectrics. 2017;516:67–73.
CrossRef
- Kumar L.,Kar M. J. Magn. Magn. Mater. 2011;323:2042–2048.
CrossRef
- Rietveld H. M. J. Appl. Cryst. 1969;2:65-71.
CrossRef
- Chougule P. K., Kumbhar S. S., Kolekar Y. D.,Bhosale C. H. J. Magn. Magn. Mater. 2014;372:181–186.
CrossRef
- Widatallah H. M., Johnson C., Berry F. J., Gismelseed A. M., Jartych E., Marco J. F., Gard F. S., Pekala M. J. phy. chem.of Sol. 2006;67:1817–1822.
- Deshpande A. D., Rewatkar K. G., Nanoti V. M. Mat. Tod. Proc. 2017;4:12174–12179.
CrossRef
- Masala O., Seshadri R. J. Am. chem. Soci. 2005;127:9354–9355.
- Monaji V. R., Das D. J.Allo.Com. 2015;634:99–103.
- Iqbal J., Rukh M.,Siddiquah M. J. Magn. Magn. Mater. 2008;320:845–850.
CrossRef
- Birgani N., Niyaifar A.,Hasanpour M. J. Magn. Magn. Mater. 2015;374:179–181.
CrossRef
- Sawatzky G. A., Van Der Woude F.,Morrish A. H. Phy. Rev. 1969;187:747–757.
CrossRef
- Duong G. V.,Hanh N., Linh D. V.,Groessinger R.,Weinberger P., Schafler E., Zehetbauer. J. Magn. Magn. Mater. 2007;311:46–50.
CrossRef
- Wahba A. M., Mohamed M. B.,Imam N. G. J. Magn. Magn. Mater. 2016;408:51–59.
CrossRef
- Oliva M. I., Heredia A., Zandalazini C. I., Crivello M., Corchero E. Phy. B. Cond. Mater. 2012;407:3125–3127.
CrossRef
- Safi R. Ghasemi A. Shoja-Razavi R. Ghasemi E. Sodaee T., J. Magn. Magn. Mater. 2015;396:294.
CrossRef
- Nazir S., Sami S., Haider S., Shahid M., Sher M.,Warsi M. F., Nadeem Q., Khan M. A. Cer. Inter. 2016;42:13459–13463.

This work is licensed under a Creative Commons Attribution 4.0 International License.