Introduction
The compound [M=Ca, Ba] MSnO3 belongs to the family of perovskite type alkaline earth stannates which have attractive dielectric characteristics, excellent optical and semiconducting properties. The Stannates also exhibit high band gap [3.0-3.6eV], high melting point and is stable which offers many advantages and applications. The Stannates also find their applications in display phosphor matrix, ceramic materials, thermally stable capacitors in electronic industry, lithium ion batteries, thermally stable capacitors, photo catalytic utilization and gas sensor hosts . The important luminescence properties of rare earth ions doped in perovskite electronic has become attractive during the past decade, not only for its use as a probe to investigating local centers and energy migration processes in the microstructures of electronic materials but also in the search of novel phosphors for display technologies. Among them, ABO3 (A = Ca, Sr and B) B = Ti, Zr, Si, Nb, Hf, etc) activated by rare earth ions, including Sm3+, Eu3+, Pr3+, Ce3+, Tb3+, Er3+.1 They are important materials in the electronic industry and their synthetic methods can modify their structure and hence properties. The double oxide materials of the type ABO3 are found to be thermally stable upto 2000˚C with semiconducting properties and the powders can be sintered into a solid mass.2 Phosphors are the highly purified inorganic materials doped with small impurities or additives or quencher called dopants or activator which is usually present in a very low concentration vary from a few ppm up to 5mol %of the host lattice. Some phosphors contained more than one activators and the term co- activators is used in such cases. for example, inorganic phosphors, mostly Europium is the main active centre to produce luminescence and supported by lanthanum, gadolinium, neodymium, dysprosium etc can be used as co- activators as per the phosphor requirement. Europium doped nanophosphors are very important materials and widely used in plasma displays, three colored lamps and luminescent paints etc.3 In this context, exploring the factors which will contribute towards energy and cost effective synthetic approaches for the preparation of stannate ceramics with enhanced properties has become significant. In the present study bio waste of egg shell as a precursor, plant extract as the medium and lower calcination temperature have been considered for the preparation of stannate ceramic. Further investigation on the doping of lower percentage of alkaline earth metal of Europium on the as synthesized ceramic sample has been carried out to study its effect on the structure, morphology leading to its effect on the enhancement of the photo luminescence, catalytic and anti-microbial properties.
Materials and Methods
Chemicals and Reagents
Tin (II) chloride dehydrate, Eggshell powder, Barium carbonate, Europium (III) oxide, Ethanol, Methylene blue conductivity water Aloe vera plant extracts.
Experimental Procedure
Preparation of nano tin (IV) oxide Mediated by aloe vera extract (sol –gel method)
The precursors tin (II) chloride and aloe vera plant extract were taken in the ratio of 1:4 and the reaction mixture was stirred about 2 hours using magnetic stirrer and it was kept overnight for digestion and maintained the pH and it was precalcined in the microwave oven and further calcined in the muffle furnace 600°C for 4 hours. The sample was collected and labelled as SnO2.
Preparation of Eu3+ doped Calcium Stannate (Solid State Route Method)
Egg shell powder and SnO2 were taken in the ratio of 1:1. It was subjected to solid state route followed by calcination in the muffle furnace 850°C for 9hours. The sample was collected and labeled as CaSnO3. Europium (III) Oxide was added to CaSnO3 at three different weight percentages (0.25%,0.50%,0.75%) by solid state route method and it was then calcined in the muffle furnace 1000˚C for 9hours.The samples were collected and labeled as CaSnO3:0.25%Eu3+ , CaSnO3:0.50%Eu3+ , CaSnO3:0.75%Eu3+ respectively.
Preparation of Eu3+ doped Barium stannate (Solid state route method)
Barium carbonate and SnO2 were taken in the ratio of 1:1. It was subjected to solid state route method and it was further calcined in the muffle furnace 1200°C for 9hours. The sample was collected and labeled as BaSnO3. Europium (III) Oxide was added to BaSnO3 at three different weight percentages (0.25%,0.50%,0.75%) by solid state route method and it was then calcined in the muffle furnace 1000˚C for 9hours. The samples were collected and labeled asStannates with Eu3+were subjected to physical and structural analysis and then correlated with their properties and applications.
Photo catalytic degradation of Methylene blue dye- Preliminary screening
Methylene blue dye is a very commonly used for medicinal, textile dyeing purposes which when used in larger amounts induces toxicity. Photo catalytic degradation was carried out for the dye Methylene blue with the as synthesized samples under the sunlight at the time interval of every 1 hour. Methylene blue & sample taken in the concentration of 0.1 mg /ml of 0.1 M respectively at the neutral pH was subjected to sunlight radiation. The UV-Visible absorbance of the samples were recorded at the time interval of every 1 hour starting at the zeroth time. The photo catalytic degradative efficiency of the samples was calculated by using the formula.
%d =100 *{initial absorbance – absorbance at time ‘t’}/initial absorbance
Antibacterial activity using agar well diffusion method
The synthesized samples was screened for antibacterial activity against human pathogens such as Pseudomonas aeruginosa, Staphylococcus aureus using agar well diffusion method. The samples were prepared by dissolving the 10mg of the stannate ceramic in 500 µl of a mixture of ethanol, acetone and isopropanol (mixed in the ratio of 1:1:1).
The nutrient Agar (NA) plates were inoculated and spread with test organisms. Then wells were prepared in the plates and each well was loaded with 15, 30, 45, 60 µl of corresponding concentration of sample and 10 mg of Tetracycline dissolved in 1 ml of DMSO was used as a Positive control for antibacterial activity. The plates were incubated for 24h at 37°C. The development of inhibition zone around the well was measured (diameter) and recorded.
Structural Characterization
The prepared nano samples were subjected to micro structural characterization. The parameters crystallite size, nature of the metal bonding and impurities, surface morphology, were examined using UV –Visible spectra, Powder X-ray diffractograms (PXRD), Fourier Transformed Infra-red (FTIR- SHIMADZU) spectra, Scanning Electron microscopic images along with the elemental composition on the surface (SEM- HITACHI S 3400N -EDAX), Photo Luminescence (PL- Cary 100 (Varian)) spectra respectively. The percentage degradation efficiency of the as synthesised samples upon Methylene Blue dye was studied using SCHIMADZU 1601 spectrophotometer in 400 to 800 nm range. The FTIR spectra were collected in the frequency range 4000 to 400 cm -1 against the background of KBr. The PXRD pattern for the samples were recorded using CuKα radiation with a diffraction angle between 10 and 70. The crystallite size “D” calculated using the Scherer equation. The average crystallite size was determined only after computer fitting of the peaks using the Voigt function (DIFFRAC SOFTWARE).
Results and Discussion
Fourier transformed infra- red spectrum [FT –IR spectrum]
FT-IR spectrum of Eu3+ doped nanoscale Calcium stannate ceramic
In all the three Europium doped calcium stannate samples , the peak observed at 459.08cm-1 was due to O-Sn-O stretching vibrations of CaSnO3 and 655.00- 660.65cm-1is due to Sn – O – Sn stretching vibrations which correlated well with the report of.4 The peaks at 867.04 -896.94cm-1 and 1031-1078.25cm-1 were due to Sn – O matrix and Sn = O stretching.4 The peak 1426.42-1448 cm-1 was due to the presence of undissociated carbonates based on the report of.5 The broad band in the region 3400-3600cm-1 was due to the stretching vibrations of OH group which was correlated with the report of.6
FT-IR spectrum of Eu3+ doped nanoscale Barium stannate ceramic
In all the three Europium doped Barium stannate samples, the peak observed at 650-655.00 cm -1 was due to Sn – O – Sn stretching vibrations which was correlated well with the reports of.7 The peak at 1446-1452.46 cm-1 were due to the stretching frequency of inorganic carbonate which correlated with the observations of.8,9 The broad band in the region 3413.19-3436.33cm-1 and were due to the stretching vibrations of OH group.
X-ray –Diffraction Analysis
PXRD spectrum of Eu3+ doped nanoscale Calcium stannate ceramic
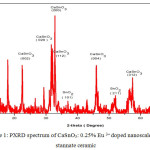
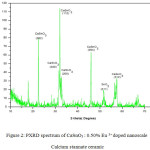
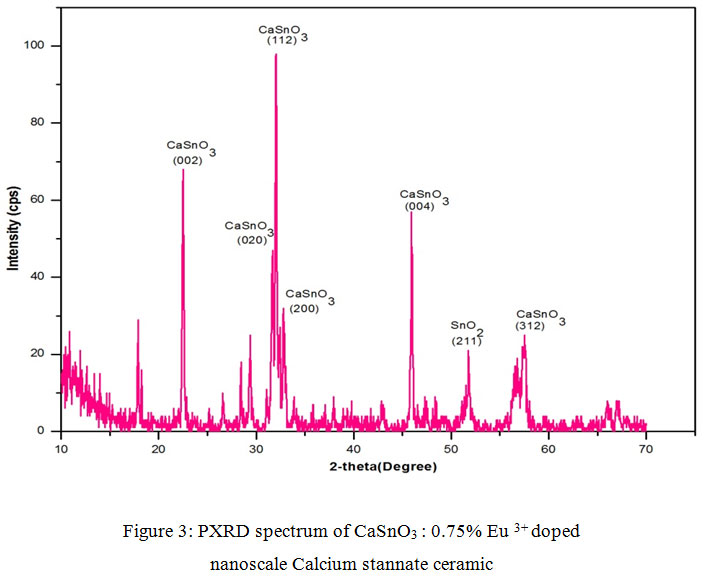
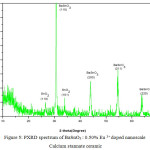
The X-ray diffraction (XRD) pattern of the as synthesized Eu3+ doped CaSnO3 (Figure- 1, 2 and 3) shows the position of various diffraction peaks at 2θ values and has good agreement with the diffraction pattern of calcium stannate in orthorhombic phase [JCPDS 77-1797] and few residual peaks with low intensity conforming to the SnO2 in tetragonal phases [JCPDS 88-0287]. It was found that the average crystallite size of SnO2 phases increased with increasing weight percentage of Europium. The number of SnO2 phases decreased with increasing weight percentage of Europium. Y.Karabulut et al.,[10]reported the average crystallite size of Europium doped calcium stannate around >30 micrometer at calcinations temperature 1400°C . In the present study, the average crystallite size of calcium stannate was found to be 32nm. Also, the peak due to SnO was absent and hence it could be concluded that aloe vera played an important role in oxidizing Sn (II) to Sn (IV) which was correlated well with the report of.11 There was no peak corresponding to Eu2O3 in the PXRD spectrum which correlated well with the FTIR results.
Figure 1: PXRD spectrum of CaSnO3: 0.25% Eu 3+ doped nanoscale Calcium stannate ceramic.
Figure 2: PXRD spectrum of CaSnO3 : 0.50% Eu 3+ doped nanoscale Calcium stannate ceramic.
Figure 3: PXRD spectrum of CaSnO3 : 0.75% Eu 3+ doped nanoscale Calcium stannate ceramic.
PXRD spectrum of Eu3+doped nanoscale Barium stannate
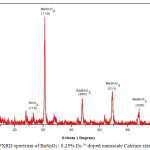
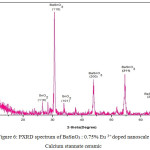
The X-ray diffraction (XRD) pattern of the as synthesized Eu3+ doped BaSnO3 (Figure- 4, 5 and 6) shows the position of various diffraction peaks at 2θ values and has good agreement with [JCPDS 89-2488] the diffraction pattern of Barium stannate in cubic phase. There were also few residual peaks due to the presence of SnO2 in tetragonal phase [JCPDS 88-0287]. However, the presence of Eu3+ ions into the crystal lattice could not be established by the PXRD peaks as the percentage is less than 1%. The number of SnO2 phases increases with increasing weight percentage of Europium. The average crystallite size of BaSnO3 was found to be 21.6nm. This is contrary to the reports of M.Ayvacikli [11] wherein the presence of orthorhombic structure for Europium doped barium stannate was identified with the crystallite size of >30 micrometer. Also, the ceramic was synthesized by sol by the solid-state method with the sintering temperature of 1400°C. The peak due to SnO was absent and hence it could be concluded that aloe vera played an important role in oxidizing Sn (II) to Sn (IV) which was correlated well with the report of.11
Figure 4: PXRD spectrum of BaSnO3 : 0.25% Eu 3+ doped nanoscale Calcium stannate ceramic.
Figure 5: PXRD spectrum of BaSnO3 : 0.50% Eu 3+ doped nanoscale Calcium stannate ceramic.
Figure 6: PXRD spectrum of BaSnO3 : 0.75% Eu 3+ doped nanoscale Calcium stannate ceramic.
Scanning electron microscopy image [SEM]
SEM images of Eu3+doped nanoscale Calcium stannate ceramic
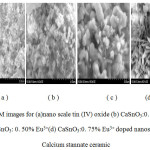
The surface morphological examination of nano scale tin (IV) oxide prepared using aloe vera plant extract and Eu3+ doped nanoscale calcium stannate ceramic as given by SEM images (Figure- 7 (a) near spherical crystallites of nano scale tin (IV) oxide (b) CaSnO3:0.25% Eu3+) showed the formation of near spherical grains with agglomeration. The SEM image of (c) CaSnO3:0.50% Eu3+showed both near spherical and rod like structures indicative of the presence of calcium stannate and Eu2O3 on the surface. The morphological variation may be due to the increasing percentage of Eu3+which was identified by EDAX analysis. In fact, there was a flower like structures of the crystallites. The SEM image (d) CaSnO3:0.75% Eu3+ also showed similar features of near spherical, rod shaped crystallites along with sticks like structure, which could not be accounted for. The surface morphology of Europium doped calcium stannate results correlated well with the PXRD results.
Figure 7: SEM images for (a)nano scale tin (IV) oxide (b) CaSnO3:0. 25% Eu3+ (c) CaSnO3: 0. 50% Eu3+(d) CaSnO3:0. 75% Eu3+ doped nanoscale Calcium stannate ceramic.
SEM images of Eu3+ doped nanoscale Barium stannate ceramic
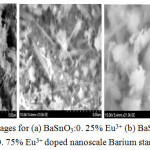
The surface examination of Eu3+ doped nanoscale barium stannate ceramic as given by SEM images (Figure- 8 (a) BaSnO3:0. 25% Eu3+ ) showed., near spherical, stick and rod like structure with agglomeration of particles. The stick morphology of the sample was reported at higher calcinations temperature of 1200°C and was due to the presence of barium carbonate.8,9 In the sample of (b) BaSnO3:0.50%Eu3+there were more rod like structures and near spherical due to increasing percentage of Eu3+ on the stannate surface. In the sample of (c) BaSnO3:0.75% Eu3+there was well developed spherical crystallites with lesser rod like structures. These observations clearly indicated the effect of doping fractional percentages of rare earth ions on the surface morphology and hence the surface properties of the ceramics. However, the SEM images were supportive of the PXRD results.
Figure 8: SEM images for (a) BaSnO3:0. 25% Eu3+ (b) BaSnO3: 0. 50% Eu3+ (c) BaSnO3:0. 75% Eu3+ doped nanoscale Barium stannate ceramic.
Energy dispersive X-ray analysis (EDAX)
The relative Europium percentage of elements on the surface identified by SEM images was shown in the Table-1. The EDAX results indicate the progressive addition of the Eu3+ ion into the crystal lattice but the crystal structures of the basic Stannates decide the exact location of the ion. In both the stannates, the relative percentage of Europium at the surface was when the weight percentage of it was 0.75%.
Table 1: EDAX analysis of Eu 3+ doped nanoscale Calcium stannate ceramics.
|
Element
|
CaSnO3:
0.25% Eu3+
|
CaSnO3:
0.50% Eu3+
|
CaSnO3:
0.75% Eu3+
|
|
Weight %
|
Weight%
|
Weight%
|
|
O
|
64.38
|
45.44
|
48.29
|
|
Ca
|
23.38
|
12.08
|
13.86
|
|
Sn
|
11.75
|
42.02
|
32.02
|
|
Eu
|
0.09
|
0.47
|
1.98
|
Application studies
Photoluminescence study
Photoluminescence spectrum of Eu 3+ doped nanoscale Calcium stannate ceramic
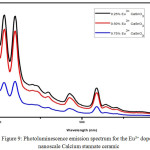
The Photoluminescence (PL) study of the nanoscale Calcium stannate ceramic doped with three percentages of Eu 3+ was carried out with the excitation wavelength of 380 nm. In the PL spectra of CaSnO3: 0.25 % Eu3+ there were emission bands observed at 407.07 nm , 420.00 nm, 485.07 nm and 518.05 nm as shown in Figure-9. There were two sharp and twobroad emission bands were observed while in the sample CaSnO3: 0. 50% Eu3+there were emission bands observed at 407.07 nm, 420.00 nm, 485.07 nm and 518.05 nm. In the sample CaSnO3: 0.75% Eu3+there were the emission bands were observed at 406.00 nm 420.00 nm and 518.05 nm as shown in figure and the reports were correlated.10 All the emission spectra were observed in visible region. Anyhow the extent to which the intensity was lowered was lesser compared to that of zinc stannate ceramic.
Figure 9: Photoluminescence emission spectrum for the Eu3+ doped nanoscale Calcium stannate ceramic.
Photoluminescence spectrum of Eu 3+ doped nanoscale Barium stannate ceramic
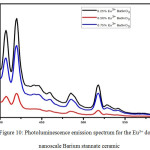
Photoluminescence study of the nanoscale Barium stannate ceramic was carried out with the excitation wavelength of 380 nm and following observations were made. In the sample of BaSnO3: 0.25% Eu3+there were emission bands observed at 407.07 nm 420.00 nm, 485.07 nm and 518.05 nm for the sample as shown in Figure-10. There are two sharp and two broad emission bands were observed.In the sample BaSnO3: 0.50 % Eu3+ there Emission bands observed at 407.07 nm, 420.00 nm, 485.07 nm and 518.05 nm for the sample as shown in figure. There are two sharp and two broad emission bands were observed. BaSnO3: 0.75 % Eu3+there were emission bands observed at 407.07 nm 420.00 nm 485.07 nm and 518.05 nm for the sample as shown in figure. There are two sharp and two broad emission bands were observed and the emission spectra are observed in visible region and correlated with the reports of.12 While 0.50 % doping of Eu3+ at surface of Europium doped Barium stannate ceramic reduces PL intensity and chromaticity of this compound when compared to 0.25% and 0.75 % of Eu3+.
Figure 10: Photoluminescence emission spectrum for the Eu3+ doped nanoscale Barium stannate ceramic.
Preliminary screening for Photocatalytic degradative efficiency
Photo catalytic degradation of Methylene blue dye with Eu3+ doped nanoscale Calcium stannate ceramic
Among the three samples of Eu3+ doped Calcium Stannates, the photo degradative efficiency of 0.50% Eu3+ doped calcium stannate was found to be the highest compared to the other two stannate ceramic against Methylene blue dye was relatively low at the neutral pH as shown in the Figure -12. But it was found to be less efficient than its absence (without the catalyst). It can be concluded that photocatalytic efficiency of calcium stannate and Europium doped are not noteworthy.
Table 2: EDAX analysis of Eu 3+ doped nanoscale Barium stannate ceramics.
|
Element
|
BaSnO3:
0.25% Eu3+
|
BaSnO3:
0.50% Eu3+
|
BaSnO3:
0.75% Eu3+
|
|
Weight%
|
Weight%
|
Weight%
|
|
O
|
38.11
|
32.48
|
36.35
|
|
Ba
|
29.07
|
30.45
|
32.35
|
|
Sn
|
32.18
|
33.82
|
29.62
|
|
Eu
|
0.65
|
3.26
|
1.67
|
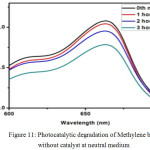
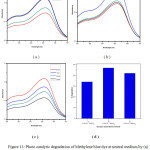
Figure 11: Photocatalytic degradation of Methylene blue without catalyst at neutral medium.
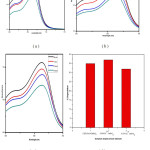
Figure 12: Photo catalytic degradation of Methylene blue dye at neutral medium by (a) CaSnO3:0.25%Eu3+ (b) CaSnO3:0.50%Eu3+ (c) CaSnO3:0.75%Eu3+ (d) comparison of degradative property of Eu3+ doped Calcium Stannates.
Photo catalytic degradation of Methylene blue dye with Eu3+ doped nanoscale Barium stannate ceramic
The Photo degradative efficiency of 0.50% Eu3+ doped barium stannate ceramic against Methylene blue dye was relatively higher at the neutral pH compared to other doped samples (0.25% and 0.75% Eu3+) was shown in the Figure-13. This behaviour was like that of calcium stannate.
Figure 13: Photo catalytic degradation of Methylene blue dye at neutral medium by (a) BaSnO3:0.25%Eu3+ (b) BaSnO3:0.50%Eu3+ (c) BaSnO3:0.75%Eu3+ (d) Comparison of degradative property of Eu3+ doped Barium stannate.
Antibacterial activity using agar well diffusion method
So far there are no reports available on the anti-microbial activity of Europium doped calcium and barium stannate ceramic. In the present study, Table – 3 and 4 shows there was a 50 percent toxicity to Pseudomonas aeruginosa, Staphylococcus aureus cells at the concentration level of 600 µg compared to the control of Tetracycline (500 µg) in the case of all the three Eu 3+ doped calcium and barium stannate samples. The anti-bacterial activity can be improved further with increased concentration of the stannate ceramic samples.
Table 3: Shows Antibacterial activity of samples against Staphylococcus aureus and Pseudomonas aeruginosa.
|
Sample
|
Concentration (µg)
|
Zone of inhibition (mm)
|
|
Sample
|
Control (500 (µg)
|
|
Staphylococcus aureus
|
Pseudomonas aeruginosa
|
Staphylococcus aureus
|
Pseudomonas aeruginosa
|
|
CaSnO3:0.25%Eu3+
|
150
|
–
|
–
|
35
|
15
|
|
300
|
11
|
–
|
|
450
|
12
|
11
|
|
600
|
14
|
13
|
|
CaSnO3:0.50%Eu3+
|
150
|
–
|
–
|
35
|
16
|
|
300
|
–
|
–
|
|
450
|
–
|
11
|
|
600
|
11
|
12
|
|
CaSnO3:0.75%Eu3+
|
150
|
–
|
–
|
35
|
16
|
|
300
|
–
|
11
|
|
450
|
–
|
12
|
|
600
|
11
|
13
|
Table 4: Shows Antibacterial activity of samples against Staphylococcus aureus and Pseudomonas aeruginosa.
|
Sample
|
Concentration (µg)
|
Zone of inhibition (mm)
|
|
Sample
|
Control (500 (µg)
|
|
Staphylococcus aureus
|
Pseudomonas aeruginosa
|
Staphylococcus aureus
|
Pseudomonas aeruginosa
|
|
BaSnO3:0.25%Eu3+
|
150
|
–
|
–
|
35
|
16
|
|
300
|
11
|
–
|
|
450
|
12
|
11
|
|
600
|
13
|
13
|
|
BaSnO3:0.50%Eu3+
|
150
|
–
|
–
|
36
|
16
|
|
300
|
–
|
–
|
|
450
|
15
|
10
|
|
600
|
17
|
12
|
|
BaSnO3:0.75%Eu3+
|
150
|
–
|
–
|
34
|
16
|
|
300
|
–
|
–
|
|
450
|
11
|
10
|
|
600
|
13
|
11
|
Conclusion
In the present study, a simple and energy effective process of introducing the rare earth metal of Eu3+ ion into the Stannates of Ca and Ba which were prepared by an energy effective green method was investigated. A lower percentage of less than one by weight of Europium with respect to the stannate samples was doped and the effect was considered in terms of its Photo luminescence and degradative property upon the organic dye of Methylene Blue. The microstructure, surface morphology of the samples were correlated with the luminescence and catalytic property. There was a drastic reduction in the calcination temperatures for the introduction of Europium into Stannate structures. There were observable changes in the morphology of all the three Stannates even though the percentage of Europium was less than one. The Cubic structure of Europium doped barium stannate was achieved at a lower calcination temperature of 1000°C contrary to the reported temperature of 1400°C by solid state mixing. There was a progressive decrease in the photo luminescence intensity of the Stannates of Ca with increasing doping percentage of Europium which were correlative of the influence of defect structures in the crystal lattice. It can also be concluded that photocatalytic efficiency of Europium doped calcium and barium stannate upon degradation of methylene blue dye are not noteworthy under the given experimental conditions and further studies on various reaction conditions are needed. The anti-microbial activity is encouraging as indicated by their toxicity on Pseudomonas aeruginosa, Staphylococcus aureus bacteria. The study ultimately provided a novel method of doping of the rare earth metal into the crystal lattice of Calcium and Barium stannate ceramic to widen its applications.
Acknowledgement
The authors would like to thank Ethiraj College for Women, Chennai, India for their support and encouragement.
Funding Source
The author(s) declare(s) that the funding is done by author only.
Conflict of interest
The author(s) declare(s) that there is no conflict of interests regarding the publication of this article.
References
- Dutta P. Investigation on the synthesis and photoluminescence properties of Eu3+ doped CaSnO3 nanophosphor for solid state lighting applications. Thesis, School of materials science and nanotechnology, Jadavpur University, Kolkata. 2014.
- Bosch R. G. Methods for producing a ceramic multi –layer component and ceramic multi-layer component. Patent No W0 2013013910 A1. 2013.
- Singh D., Tanwar V., Bhagwan S., Nishal V., Sheoran S.,Kadyan S., Anura P. Samantilleke and Pratap Singh Kadyan, Synthesis and Optical Characterization of Europium Doped MY2O4 (M = Mg, Ca, and Sr) Nanophosphors for Solid State Lightening applications. Indian Journal of Materials Science. 2015:8. Article ID 845065.
- Sudha S. p., Gnanamani A., Baran A .M. Egg shell powder as the Precursor for the synthesis of nano crystalline calcium stannate (CaSnO3) with orthorhombic perovskite structure: Exploration on Phase. Morphology and Antioxidant property, Chemical Sciences Review and Letters. 2012;2(5):267-277.
- Nakamato. Infrared spectra and Raman spectra of Inorganic and Coordination compounds. John Wiley and sons New York. 1986.
- Parimala S. S., Lingeswari S., Subhshini L., Aishwarya G. Aloe Barbadensis Miller Mediated Synthesis of Nano Crystalline Tin (Iv) Oxide – Influence Of The Plant Extract Concentration. Period of Digestion And Calcinations Temperature International Journal of Medical and Applied Sciences. 2014;3(1).
- Ze-qiang H. E., Xin-hai L. I.,En-hui L. I. U., Zhao-hui H. O. U., Ling-feng D. E. N. G., Chuan-yue H. U. School of metallurgical science and engineering. central south University, China. 2003.
- Sarkar D., samir S. s. synthesis and dispersion of Barium stannate nanopowders. Journals of Department of ceramic engineering, National institute of Technology. ROURKELA. 2007 -2011.
- parimala S. S.,Rajarajeshwari M. Green Synthesis of Nano Scale Barium Stannate Ceramic – Influence of Calcination Temperature on Phase Purity and Luminescence Property. International journal Applied Physical and Biochemistry research. 2017;7(2):2277-4793.
- Karabulut Y., Ayvacıklı M., Canimoglu A., Garcia J. G., Kotan Z., Ekdal E., Akyuz O & Can N. Synthesis and Luminescence Properties of Trivalent Rare-Earth Element-Doped Calcium Stannate Phosphors. Spectroscopy Letters. 2014;47:(8):630-641.
CrossRef
- Ayvacikli M. Radioluminiscence and photoluminescence characterization of Eu and Tb doped barium stannate phosphors ceramics. Journals of alloys and compounds. 2015;590:417-423.
CrossRef
- Cerda J., Arbiol J., Diaz R., Ezanneau G. D., Morante J. R. Synthesis of perovskite -type BaSnO3 particles obtained by a new simple wet chemical route based on sol-gel process. Materials Letters. 2002;56:131-136.
CrossRef

This work is licensed under a Creative Commons Attribution 4.0 International License.

 and Prashanna Suvaitha S