Visible light-driven High Photocatalytic Activity of Cu-doped TiO2 Nanoparticles Synthesized by Hydrothermal Method

1Department of Physics, Jaysingpur College Jaysingpur-416101, Maharashtra India.
2Department of Physics, Shivaji University, Kolhapur-416004, Maharashtra India.
3Department of Chemistry, Shivaji University, Kolhapur-416004, Maharashtra India.
Corresponding Author E-mail: kmg_chem@unishivaji.ac.in
DOI : http://dx.doi.org/10.13005/msri/150301
Download this article as:
![]()
TiO2 and Cu-doped TiO2 nanoparticles (NPs) with totally extraordinary substance of Cu by exploitation hydrothermal method. The part immaculateness, morphology, molecule estimate, optical properties, and elemental composition of as-incorporated Cu-doped TiO2 NPs were investigated by numerous systematic methods. The XRD designs unveiled Cu-doped TiO2 NPs inside the part unadulterated anatase phase. The plane of (101) XRD and XPS results show the lucky doping of Cu2+ inside the TiO2 lattice. The optical edges of Cu-doped TiO2 demonstrated a transparent light absorption in visible region that assumes an essential part inside the photocatalytic action underneath characteristic daylight. Certain Cu2+ content shows least PL intensity that backings the decrease in recombination rate of charge species. In addition, to get a handle on photocatalytic action, we have tried Cu-doped TiO2 for the degradation of Malachite Green (MG) under visible light. A large portion of 85% degradation was found for Cu-doped TiO2 (1.71 wt.%) underneath daylight minimum of 180 min, severally, that is past that of TiO2 (53%). Also, the degradation of the MG was affirmed by measurement of the chemical oxygen demand of the photodegraded solution. These outcomes demonstrates that the Cu-doped TiO2 NPs are extremely productive for the photodegration of the MG.
KEYWORDS:Chemical Oxygen Demand; Cu-doped TiO2; Hydrothermal Method; Malachite Green; Photocatalysis
Introduction
Environment-friendly visible light determined photocatalyst for wastewater treatment are right now an exciting zone of research. In view of extraordinary properties of TiO2 like high stability, minimal effort, photoelectric, and security to every human and the environment. TiO2 as a metal oxide semiconductor has been generally utilized in ecological control of contamination, transformation and vitality storage, sensors, photovoltaics and Li-ion batteries.1-2 As of late a lot of interest has been dedicated for the photocatalytic degradation of natural water containing poisons group that begins from textile or any pharmaceutical industry by semiconductor materials.2 Textiles materials are bad for ecological system because of their far reaching use and potential for dangerous fragrant species, while pharmaceutical industry is conceivable to continue expanding utilization of the organic compound that has extreme unfriendly impacts on the environment.3-4
Industries like paper, material, and printing produces an outsized measure of nephrotoxic and non-biodegradable color effluents that goes into the surroundings. Overabundance utilization of different colors in the material business has prompted the contamination of surface water and groundwater.5-6 For mechanical application, anatase TiO2 has been favoured over rutile and brookite because of its higher photocatalytic activity.7 The photocatalytic degradation of a color includes the development of electrons (e–) and holes (h+) on the surface of the catalyst, which acts as redox sources that produces oxidative species, bringing about the destruction of pollutants.8
Nowadays, entirely scientific community everywhere attracted towards photocatalysis. The globe has connected towards the heterogeneous photocatalysis, particularly for the photocatalytic degradation of hazardous natural contaminants like azo dyes,9 drugs10 and natural pollutants.11 A band gap of 3.2 eV of Anatase TiO2 corresponds to 387.45 nm. Thus, it is photocatalytic upon exposure to light having wavelength less than or equal to 387.45nm that spreads exclusively 3-5% of the sunlight radiation.12-13 Consequently, developing visible-light- active TiO2 fundamentally based structures with expanded photoactivity is basic need for a considerable measure of prudent use of sunlight. Dynamic photocatalytic materials with wavelengths inside the visible radiation vary square measure necessity for indoor applications.14
The most economical way to extend the photoresponse of TiO2 into visible is doping or surface modification with transition metals15 like Cr3+ 16-17, Mn2+ 18, Fe3+ 19-20, Co2+ 21, Ni2+ 22, Cu2+.23 Among these dopants, Cu2+ has been widly utilised for the doping, because the radius of Cu2+ (0.87 Å) is totally different from that of Ti4+ ion (0.74 Å).24-25 Cu generally as a Cu2+ ion in oxide and Ti exist as a Ti4+ ion in TiO2, along these lines it’s trusted that doping of Cu in TiO2 could give oxygen opportunities inside the lattice that should upgrade the superhydrophilicity and photocatalytic activity.
In 2011, Nishikiori et al.,26 detailed a sol-gel blend of Cu-doped TiO2 and tried its movement beneath visible radiation for the decolourization of Methylene Blue (MB) and trichloroethylene. The Cu-doped TiO2 demonstrated a respectable photocatalytic action beneath visible radiation light as a result of the progress of the TiO2 valence band to Cu2+ impurity states. In 2013, Hudson et al.,27 distributed their work on the combination of Cu-TiO2 photocatalyst ready by the sol-gel system. The brilliant degradation proficiency was found for Cu-TiO2 NPs (> 95%) in 30 min underneath daylight illumination, in contrast with TiO2 (< 40%) for the degradation of Methylene Blue dye.
In 2014, Janezarek et al.,28 examined the amalgamation of Cu-TiO2 clear skinny films utilizing the sol-gel dip-coating procedure. The vital rate of phenol and 4-chlorophenol mineralization was resolved underneath light illumination. The photoactivity of total organic carbon (TOC) which is the concentration of organic carbon diminishes within 3 hours of illumination (λ>420 nm) was 53% and 45% individually.
In 2015, Pongwan et al29 distributed their work on Cu-doped TiO2 NPs utilizing the adjusted sol-gel strategy. Great photocatalytic activity was seen under visible light illumination for the mineralization of oxalic acid and formic acid with respect to TiO2. The ideal amount of Cu doping was 2.0mol.% demonstrating the best execution of oxalic and formic acid mineralization under light irradiation. In 2016, Bensouici et al.,30 revealed a sol-gel dip coating blend of Cu doped TiO2 thin films kept on the glass substrate and tried its activity for deterioration of MB under UV light. The incredible photocatalytic activity was watched for the TiO2 thin film (92%) in 180 minutes, while just 16 % degradation was seen in 4.6 and 10% Cu doped TiO2 films
To the best of our insight, we report here to integrate Cu-doped TiO2 NPs by a basic hydrothermal method utilizing Titanium (IV) tetraisopropoxide (TTIP) as a source. This arrangement course offers the tuning of the band gap of TiO2 to the coveted level through the doping of Cu2+ NPs. The photocatalytic action of Cu-doped TiO2 NPs under UV, visible and coordinate daylight is explored towards the degradation of Malachite Green (MG) as a model contaminant. Malachite Green is cationic dye it refers to the chloride salt [C6H5C(C6H4N(CH3)2)2]Cl.
There are no reports on the doping of Cu2+ in TiO2 by hydrothermal method at 120 °C in 5 hours. The goal in this examination work is to grow exceedingly effective, visible light dynamic photocatalyst in view of nanotechnology for detoxification of MG.
Experimental
Materials
All chemicals used were of AR grade and used as received without any purification. Titanium (IV) tetraisopropoxide (TTIP) (98%), Copper nitrate (99%), Glacial acetic acid (99%) were purchased from Spectrochem Pvt. Ltd., S D Fine-Chem Ltd., Mumbai (India) and Pune Chemical Laboratory. Throughout the experiment ethanol (99.9%) and double distilled water were used.
Synthesis of Cu-doped TiO2 NPs
Cu-doped TiO2 nanoparticles were synthesized by the hydrothermal method. TTIP and glacial acetic acid were taken in stoichiometric amount to get a transparent solution. Then the stoichiometric amount of copper nitrate (1, 2 and 3 wt.%) dissolved in double distilled water (DDW) which was then added into the above solution to get transparent solution. Afterword, solution was moved to Teflon lined autoclave that was sealed and kept for heating for a period of 5 hours at 120 °C. Autoclave was permitted to cool down to room temperature after heating. Ethanol was used to wash the catalyst. The total mixture was dried at 60°C to get Cu-doped TiO2 NPs and annealed at 350 °C for 2 hours.
Characterization of the catalyst
The X-ray pattern of samples were recorded using (Rigaku miniflex 600) with Cu-Kα (λ =1.5406 Å) radiation in the 2θ range from 20-80°. The optical properties were recorded by UV-Visible -NIR Spectrophotometer (Model V-770, Jasco). Transmission electron microscope (Jeol 3010) and energy dispersive X-ray spectrometer (Joel JSM 5600) was used to determine the composition of the element. The PL spectra was used to study the recombination of electron hole pairs (Model F.P. 8200). X-ray photoelectron spectroscopy (XPS) was used to study the surface composition of the photocatalyst using (K-alpha Thermo VG scientific). Raman spectra were recorded in the spectral range 100-700 cm-1 using Raman spectrometer (Horiba Jobin Vyon, France).
Photocatalytic activity of Cu-doped TiO2 nanoparticles
The photodegradation efficiency of Cu-doped TiO2 NPs were evaluated by the degradation of MG dye. The UV tubes were placed inside a circular box. The 50 ppm MG dye solution with 5 mg of photocatalyst in a glass jar was stirred magnetically. To ensure the adsorption-desorption equilibrium, the suspension was stirred 30 min magnetically dark at room temperature and then exposed to UV light. After a precise time intervals, aliquots were taken out from the suspension and centrifuged, to separate the catalyst. The solution was additionally used to monitor the concentration of MG dye by recording the absorbance of the solution on a UV-visible spectrophotometer. Similar experiments were done for the degradation of MG dye in visible and direct sunlight under the same reaction conditions.
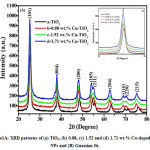
Figure 1A: XRD patterns of (a) TiO2, (b) 0.88, (c) 1.52 and (d) 1.71 wt.% Cu-doped TiO2 NPs and (B) Guassian fit
 Click on image to enlarge |
Figure 1B: Guassian fit
 Click on image to enlarge |
Results and Discussion
The XRD patterns of TiO2 and Cu-doped TiO2 NPs is shown in (Fig. 1A) and the diffraction peak matches with the standard JCPDS card no. 21-1272. The main peak (101) Cu-doped TiO2 had been found to be shifted to left side from 25.50°to 25.26°(Fig. 1B inset). The explanation for addition may be owing to the substitution of the six-coordinate Cu2p ions into the six-coordinate Ti4p D2d sites because the radius of Cu2p ion (ionic radius 0.87 Å) is larger than the Ti4p ion (ionic radius 0.74 Å). This was confirmed by XPS estimations later.31 It is because of doping of Cu-doped TiO2, which confirms pure crystalline phase was developed throughout the synthesis. This was confirmed by XPS measurements mentioned later. The crystallite size, X-ray density, and specific surface area of the synthesized TiO2 and Cu-doped TiO2 NPs were estimated as per using the formula reported in the literature and our previous work22 and the calculated values are given in Table 1. The crystallite size of Cu-doped TiO2 nanoparticles were smaller than those of TiO2 nanoparticles. It has been seen that as the dopant concentration increases, the crystallite size reduces. This reduction in crystallite size are often altered and corrected to the rise in structural defects that makes particle bigger. The ionic radius of Cu2+ ion (0.87 Å) is totally different from that of Ti4+ ion (0.74 Å) that results to interchange some portion of Ti4+ ions by Cu2+ ions within the TiO2 lattice.32-33 The right substitution of doping Cu2+ with associate oxidation state of lower in the TiO2 host lattice generates a charge-correct ion vacancy and reduces the free electron concentration.
Table 1: Crystallite size calculated from XRD (DXRD), TEM diameter (DTEM), Lattice constant (a/b, c), X-ray density (rx), Specific surface area (Sa/m2g-1), Unit cell volume (V/Å3) and Band gap (eV)
|
Sample |
DXRD (nm) |
DTEM (nm) |
Lattice Constant (Å) |
rx (g/cm3) |
Sa/m2g-1 |
V/Å3 |
Band gap (eV) |
|
|
|
|
|
a/b |
c |
|
|
|
|
|
a |
11.01 |
11.00 |
3.775 |
9.509 |
0.3914 |
139.35 |
135.50 |
3.18 |
|
b |
10.08 |
10.00 |
3.783 |
9.513 |
0.3896 |
154.00 |
136.14 |
2.72 |
|
c |
8.80 |
9.00 |
3.783 |
9.511 |
0.3897 |
174.95 |
136.11 |
2.48 |
|
d |
7.76 |
8.00 |
3.780 |
9.501 |
0.8266 |
197.84 |
135.75 |
2.34 |
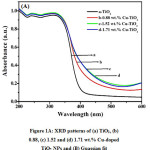
Figure 2A: Optical absorbance spectra of (a) TiO2, (b) 0.88, (c) 1.52, (d) 1.71 and (B) Determination of band gap by plotting (ahu)2 versus energy (eV) for (a) TiO2, (b) 0.88, (c) 1.52 and (d) 1.71 wt.% Cu-doped TiO2 NPs
 Click on image to enlarge |
The absorption spectra of TiO2 and Cu-doped TiO2 NPs are shown in Fig. 2A. The absorption spectra of samples show band edge at 387, 453, 500, 530 nm for TiO2, 0.88, 1.52 and 1.71 wt.% Cu-doped TiO2 NPs. This means that Copper-doping contributed to the band gap reduction. With rise in copper content band gap energy values of catalyst decreases and also the calculated band gap values are shown in Table 1. The longer wavelength absorption can be allotted to the formation of impurity levels among the lattice of TiO2.34 The concentration of Cu2+ dopant ions within the host lattice of TiO2 makes oxygen vacancies due to the charge compensation impact and this could shift the optical absorption of Cu-doped TiO2 nanoparticles extended within the visible light region.35
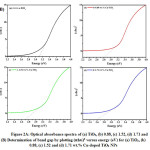
Figure 3A: (a). TEM image of TiO2, (b) SAED pattern of TiO2, (c) 1.71 wt.% TEM image and (d) SAED pattern of Cu-doped TiO2
 Click on image to enlarge |
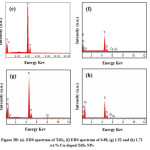
Figure 3B: (e). EDS spectrum of TiO2, (f) EDS spectrum of 0.88, (g) 1.52 and (h) 1.71 wt.% Cu-doped TiO2 NPs
 Click on image to enlarge |
Fig. 3A a-b is that the TEM micrographs and SAED pattern showing TiO2 NPs, whereas that of Fig. 3A c-d shows Cu-doped TiO2 (1.71 wt.%) NPs. The Cu-doped TiO2 particle size obtained from TEM within the range 8-10nm. TEM micrographs show the particles agglomerated and non-uniform shape and size. The obtained size of the particle matches with the results of XRD. To study the presence of elements within the sample EDS analysis was used which is shown in Fig. 3B e, f, g and h. The existence of all elements like Ti, O and Cu in the sample shows by elemental map and therefore the corresponding values of Ti, O and Cu is shown in Table 2.
Table 2: EDS Composition (wt.%) of TiO2 and Cu-doped TiO2 NPs
|
Composition (wt.%) |
||
|
Ti |
O |
Cu |
|
56.34 |
43.66 |
0 |
|
65.80 |
33.32 |
0.88 |
|
61.39 |
37.09 |
1.52 |
|
56.12 |
42.17 |
1.71 |
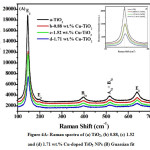
Figure 4A: Raman spectra of (a) TiO2, (b) 0.88, (c) 1.52 and (d) 1.71 wt.% Cu-doped TiO2 NPs (B) Guassian fit
 Click on image to enlarge |
Fig. 4 shows the Raman spectra of TiO2 and Cu-doped TiO2 NPs. The highest peak seems at a 144, 200, 398, 517 and 640 cm-1 is recognized to Eg, B1g, A1g+B1g were found within the modes of all anatase TiO2 samples. The Raman Eg peak of Cu-doped TiO2 NPs exhibits a reduction within the peak intensity in addition as changes within the FWHM, ever-changing to 149 cm-1 likened to TiO2.
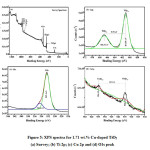
Figure 5: XPS spectra for 1.71 wt.% Cu-doped TiO2 (a) Survey; (b) Ti 2p; (c) Cu 2p and (d) O1s peak
 Click on image to enlarge |
The quantitative investigation of electronic and chemical properties of the representative Cu-doped TiO2 NPs was analysed by XPS as shown in Fig. 5. Fig. 5a shows the carbon impurities arising at 284.99 eV in the survey scan spectrum of XPS analysis. Fig. 5b shows the core level Ti2p spectra of Cu-doped TiO2 sample. For TiO2, Ti 2p3/2 and Ti 2p1/2, peaks are observed at 461.01 and 466.76 eV respectively. The splitting between the Ti 2p1/2 and Ti 2p3/2 is 5.75 eV, demonstrating a normal state of Ti4+ ion in the sample.36-37 Fig. 5c shows the XPS spectra of O1s configuration. The binding energies at 532.4 eV disclose the existence of surface hydroxyl groups and O1s electron binding energy arising from titanium lattice correspondingly. The tiny amendment within the binding energy of Ti atom clearly reveals the substitution of the few sites of the Ti4+ ion by Cu2+ ions.38-39 Fig. 5d shows the 1.71 wt.% Cu-doped TiO2 sample, the Cu 2p3/2, and Cu 2p1/2 core-level peaks are located at 934.60 and 954.19 eV of Cu2+ ions respectively, indicating a traditional state of Cu2+ within the sample. The binding energy distinction between the Cu 2p3/2 and Cu 2p1/2 core level is 19.5 eV respectively.
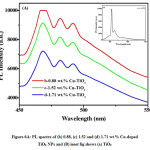
Figure 6A: PL spectra of (b) 0.88, (c) 1.52 and (d) 1.71 wt.% Cu-doped TiO2 NPs and (B) inset fig shows (a) TiO2
 Click on image to enlarge |
B shows the PL spectra of TiO2 and Cu-doped TiO2 NPs. It is a helpful technique to review the electronic structure and optical possessions of semiconductor materials. PL spectra is accustomed analyze the destiny of photo-generated e– and h+ during a semiconductor meanwhile PL emission results from the recombination of free charge carriers. The excitation wavelength 318 nm and the emission peak detected at 411. 13 nm for TiO2. The rise in Cu2+ concentration shifts the wavelength towards the upper region (469.72, 482.66 and 492.66 nm) with reducing peak strength for Cu-doped TiO2 as shown in Fig. 6. The recombination rate of photogenerated charge transporters is reduced by surface imperfections. The oxygen opening and metal ions trap the energized e– and h+ separately. The energized e– will move from the valence band to the new vitality levels presented by doping therefore will reduce the PL intensity.40
Table 3: Degradation of malachite green dye under UV, visible and direct sunlight using Cu-doped TiO2 NPs
|
Sample |
Time of Irradiation in minute |
|||||
|
30 |
60 |
90 |
120 |
150 |
180 |
|
|
Under UV Light |
||||||
|
a |
46.71 |
61.04 |
65.12 |
67.34 |
72 |
77.58 |
|
b |
33.53 |
44.66 |
50.02 |
53.18 |
58.08 |
62.13 |
|
c |
22.37 |
31.19 |
36.78 |
41.26 |
45.38 |
49.15 |
|
d |
13.32 |
18.57 |
21.41 |
22.22 |
23.24 |
29.1 |
|
Under Visible Light |
||||||
|
a |
21.83 |
30.12 |
36.46 |
42.86 |
46 |
49.66 |
|
b |
28.67 |
35.31 |
43.41 |
48.32 |
53.23 |
57.58 |
|
c |
36.7 |
44.02 |
51.74 |
58.29 |
64.08 |
69.87 |
|
d |
46.32 |
54 |
62.1 |
66.16 |
71.84 |
78.32 |
|
Under direct Sunlight |
||||||
|
a |
25.33 |
33.62 |
39.96 |
46.36 |
49.5 |
53.16 |
|
b |
27.22 |
38.18 |
43.75 |
50.49 |
54.41 |
59.88 |
|
c |
36.81 |
45.67 |
53.41 |
59.65 |
63.17 |
69.88 |
|
d |
48.72 |
60.32 |
67.86 |
72.48 |
77.5 |
85.1 |
TiO2 and Cu-doped TiO2 NPs samples were explored for the photodegradation of MG dye. In order to evaluate the photocatalytic activity of the Cu-doped TiO2 for the degradation of dye under UV light, visible light and direct sunlight irradiations were investigated and summarized in Table 3. The absorption of the dye solution was measured using UV-visible spectrophotometer at its typical wavelength. The % degradation of each dye at different irradiated time intervals was calculated in step with the following equation.41
Percentage Degradation = [(A0-At)/A0] × 100 (3)
Figure 7: Photocatalytic activity of (a) TiO2, (b) 0.88, (c) 1.52 and (d) 1.71 wt.% Cu-doped TiO2 under (A) UV light, (B) visible light and (C) sunlight for degradation of malachite green dye
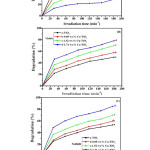 Click on image to enlarge |
Where, At is the absorbance after time‘t’ and A0 is absorbance of dye solution before degradation. (Fig. 7) shows the photocatalytic activity of pure TiO2 and Cu-doped TiO2 samples under A) UV light B) Visible light and C) Direct sunlight. It is observed that the pure TiO2 sample is more efficient than the Cu2+ doped samples in UV light irradiation. In contrast, under direct sunlight, the percentage degradation increases with increase in Cu2+ concentration. The important aspect of this work is that the degradation response of MG dye of synthesized catalyst is quick to the exposure to direct daylight. Hence it can be further used to study the degradation activities of various dyes in the industry for better color combinations. The degradation efficiencies were calculated for UV, visible and direct sunlight and the samples were characterized by using various techniques.
Table 4: COD values, with respect to the irradiation time of an aqueous solution of malachite green using TiO2 and Cu-doped TiO2 catalysts
|
Sample |
Time of Irradiation in minute |
|||||
|
30 |
60 |
90 |
120 |
150 |
180 |
|
|
Under UV light |
||||||
|
a |
292.02 |
213.50 |
191.14 |
178.97 |
153.44 |
122.86 |
|
b |
364.25 |
303.26 |
273.89 |
256.57 |
229.72 |
207.52 |
|
c |
425.41 |
377.07 |
346.44 |
321.89 |
299.31 |
278.65 |
|
d |
475.00 |
446.23 |
430.67 |
426.23 |
420.64 |
388.53 |
|
Under Visible Light |
||||||
|
a |
428.37 |
382.94 |
348.19 |
313.12 |
295.92 |
275.86 |
|
b |
390.88 |
354.50 |
310.11 |
283.20 |
256.29 |
232.46 |
|
c |
346.88 |
306.77 |
264.46 |
228.57 |
196.84 |
165.11 |
|
d |
294.16 |
252.08 |
207.69 |
185.44 |
154.31 |
118.80 |
|
Under direct Sunlight |
||||||
|
a |
409.19 |
363.76 |
329.01 |
293.94 |
276.74 |
256.68 |
|
b |
398.83 |
338.77 |
308.25 |
271.31 |
249.83 |
219.85 |
|
c |
346.28 |
297.72 |
255.31 |
221.11 |
201.82 |
165.05 |
|
d |
281.01 |
217.44 |
176.12 |
150.80 |
123.30 |
81.65 |
To affirm the degradation of MG, the chemical oxygen demand (COD) is a consumption of oxygen present in water during the oxidation of inorganic compound and decomposition of organic content was resolved at various times, which is appeared in Table 4. Estimations at time interims of debasement process demonstrated a fall in the COD qualities, which additionally affirms the improved photodegradation of MG utilizing the Cu2+ doped TiO2 catalysts. The fall in COD qualities demonstrated the comparable pattern as that seen by UV-visible spectrometer utilizing TiO2 following 3 hours UV light illumination, the most extreme COD expulsion rate was 77.58 %. The COD expulsion rate was watched at least for TiO2 following 3 hours of visible light illumination. The same expanded for COD exhaustion under visible light 57.58%, 69.87% and 78.32% for 0.88-1.71 wt.% Cu-doped TiO2 nanoparticles. The comparative pattern was watched for COD consumption under direct daylight 59.88%, 69.88% and 85.10 for 0.88-1.71 wt.% Cu2+ doped TiO2 nanoparticles. The observations obviously show higher photocatalytic movement can be gotten even with low measure of Cu2+ doped TiO2. The uppermost fall in COD was seen in 1.71 wt.% Cu-doped TiO2 under direct daylight. By and large, under UV light the COD evacuation effectiveness diminishes with increment in Cu2+ dopingattentiveness. While the COD evacuation effectiveness of Cu-doped TiO2 increments with increment in the doping grouping of Cu2+ under visible and direct daylight.
Conclusions
Among the varied strategies, efficient and easy hydrothermal technique is employed for the synthesis of nanosized TiO2 and Cu-doped TiO2 NPs. The key focus of the work is targeting on assess photocatalytic activity photodegradation of MG color. X-ray designs were researched the substitutional doping of Cu2+ into the TiO2 lattices. The vitality bandgap is tuned into the visible region from 3.18 to 2.34 eV with an expansion in Cu2+ content in TiO2 NPs. A more grounded actinic radiation absorption demonstrating the abatement inside the band gap while doping. The more drawn out wavelength absorption is designated to the development of polluting influence levels at interims the band gap of TiO2. TiO2 displays unadulterated anatase segment and accordingly the particles achieve non-round and grouped uneven frame when doping of Cu2+. XPS results uncovered that Cu was effectively joined into the TiO2 grid. The least PL power was watched for ideal Cu2+ (1.71 wt.%) content because of more partition of the electron and hole pairs. The most elevated 85% photocatalytic degradation was seen inside 180 min under visible light for 1.71 wt.% Cu-doped TiO2 nanoparticles contrasted with unadulterated TiO2. Molecule size diminishes with expanding Cu2+ content, the synergistic impact of Cu2+ doping and broadened the lifetime of a photogenerated e–-h+ pair were in charge of the change in photocatalytic action. The amount of photocatalytic degradation of the dye has also been studied by COD measurement.
Acknowledgments and Funding Source
Authors are thankful to Department of Science and technology, New Delhi for sanctioning the grant under DST-FIST program (No/SR/FST/College-151/2013 ©) to Jaysingpur College, Jaysingpur.
References
- N. R. Khalid., E. Ahmed., Z. Hong., M. Ahmad., Y. Zhang., S. Khalid., Cu-doped TiO2 nanoparticles graphene composites for efficient visible-light photocatalysis, Ceramics Inter. 2013; 39:7107-7113.
CrossRef - R. Singh., S. Dutta., Synthesis of solar photoactive TiO2 nanoparticles with enhanced structural and optical properties, Adv. Powder Technol. 2018;29:211-219.
CrossRef - Z. Zhang., C. Shao., X. Li., C. Wang., M. Zhang., Y. Liu., Electrospun Nanofibers of p-Type NiO/n-Type ZnO Heterojunctions with Enhanced Photocatalytic Activity, ACS Appl. Mater. Inter. 2010;2:2915-2923.
CrossRef - R. Campos., A. C. Paulo., Indigo Degradation with Laccases from Polyporus sp. and Sclerotium rolfsii, Textile Res. J. 2001;71:420-424 .
CrossRef - A. Desale., S. P. Kamble., M. P. Deosarkar., Photocatalytic degradation of paracetamol using degussa Tio2 photocatalyst. Inter. J. Chem. Phys. Sci. 2013;2:140-148.
- I. A. Salem., El Maa Sawi M. S., Kinetics and mechanism of color removal of methylene blue with hydrogen peroxide catalyzed by some supported alumina surfaces, Chemosphere. 2000;41: 1173-1180.
CrossRef - R. Chauhan., A. Kumar., R. P. Chaudhary. Structural and photocatalytic studies of Mn-doped TiO2 nanoparticles, Spectrochim. Acta A: Mol. Biomol. Spectrosc. 2012;98:256-264.
CrossRef - V. Binas., D. Venieri., D. Kotzias., G. Kiriakidis., Modified TiO2 based photocatalysts for improved air and health quality. 2017;3:3-16.
- R. Kamble., S. Sabale., P. Chikode., V. Puri., Xiao-Ying. Yu and S. Mahajan, Studies on the Fe3+ Doping Effect on Structural, Optical and Catalytic Properties of Hydrothermally Synthesized TiO2 Photocatalyst, Nanosci. And Nanotechno-Asia. 2017;7:230-242.
- N. S. Arul., D. Mangalaraj., P. C. Chen., N. Ponpandian., P. Meena., Y. Masuda., Enhanced photocatalytic activity of cobalt-doped CeO2 nanorods, J. Sol-Gel. Sci. Technol. 2012;64:515-523.
CrossRef - S. K. Kansal, P. Kundu, S. Sood, R. Lamba, A. Umar, S. K. Mehta. Photocatalytic degradation of the antibiotic levofloxacin using highly crystalline TiO2 nanoparticles, New J. Chem. 2014;38: 3220-3226.
CrossRef - D. Chen., Z. Jiang., J. Geng., Q. Wang., D. Yang. Carbon and Nitrogen Co-doped TiO2 with Enhanced Visible-Light Photocatalytic Activity, Ind. Eng. Chem. Res. 2007;46:2741-2746.
CrossRef - M. Asilturk., S. Funda., Arpac E. Effect of Fe3+ ion doping to TiO2 on the photocatalytic degradation of Malachite Green dye under UV and vis-irradiation, J. Photochem. Photobiol. A: Chem. 2009;203:64-71.
CrossRef - S. S. Mali., P. S. Shinde., C. A. Betty., P. N. Bhosale., W. J. Lee., P. S. Patil. Multistep hydrothermal route for nanocoral architecture of anatase TiO2: synthesis and characterization of dye-sensitized solar cell performance, Prog. Photovolt. Res. Appl. 2014;22:525-539.
CrossRef - J. Zhao.,X. Yang. Photocatalytic oxidation for indoor air purifi- cation: a literature review. Build Environ. 2003;38:645–654.
CrossRef - M. Palaez., N. T. Nolan., S. C. Pillai., M. K. Seery., P. Falaras., A. G. Kontos., P. S. M. Dunlop., J. W. J. Hamilton., J. A. Byrne., K. O’shea., M. H. Entezari., D. D. Dionysiou. A Review on the Visible Light Active Titanium Dioxide Photocatalysts for Environmental Applications, Appl. Catal. B: Environ. 2012;125 331.
- O. Y. khai., Leny Yuliati., S. L. Lee. Cr Doped TiO2 Supported on TUD-1 Photocatalyst for Dye Photodegradation, J. Teknologi (Sciences and Engineering). 2014;69:81-86.
CrossRef - Y-H Peng., G-F Huang., W-Q Huang. Visible-light absorption and photocatalytic activity of Cr-doped TiO2 nanocrystal films, Adv. Powder Technol. 2012;23:8-12.
CrossRef - R. Kamble., S. Sabale., P. Chikode., V. Puri., S. Mahajan. Structural and photocatalytic studies of hydrothermally synthesized Mn2+–TiO2 nanoparticles under UV and visible light irradiation, Mater. Res. Express. 2016;3:1-10.
CrossRef - T. Ali., P. Tripathi., A. Azam., W. Raza., A. S. Ahmed., A. Ahmed., M. Muneer. Photocatalytic performance of Fe-doped TiO2 nanoparticles under visible-light irradiation, Mater. Res. Express. 2017;4 1-12.
CrossRef - X. Xiong., Z. Wang., F. Wu., X. Li., H. Guo. Preparation of TiO2 from ilmenite using sulfuric decomposition of the titania residue combined with separation of Fe3+ with EDTA during hydrolysis, Adv. Powder Technol. 2013;24:60-67.
CrossRef - S. Thota., S. Tirukkovalluri., S. Bojja. Visible Light Induced Photocatalytic Degradation of Methyl Red with Co-doped Titania, J. Catalysis. 2014;1-7.
- R. Kamble., S. Sabale., P. Chikode., V. Puri., S. Mahajan. Structural characterization and photocatalytic properties of hydrothermally synthesized Ni2+-TiO2 nanoparticles for dye degradation under direct sunlight, Indian Journal of Chemistry. 2017;56:479-487.
- M. Liu., X. Qiu., M. Miyauchi., K. Hashimoto. Cu(II) Oxide Amorphous Nanoclusters Grafted Ti3+ Self-Doped TiO2: An Efficient Visible Light Photocatalyst, Chem. Mater. 2011;22:5282-5286.
CrossRef - B. Choudhury., A. Choudhury. Structural, optical and ferromagnetic properties of Cr doped TiO2 nanoparticles, Mater. Sci. Eng. B. 2013;178:794-800.
CrossRef - J. Choi., H. Park., M. R. Hoffmann. Effects of Single Metal-Ion Doping on the Visible-Light Photoreactivity of TiO2, J. Phys. Chem. C. 2010;114:783-792.
CrossRef - H. Nishikiori., T. Sato., S. Kubota., N. Tanaka., Y. Shimizu., T. Fujii. Preparation of Cu-doped TiO2 via refluxing of alkoxide solution and its photocatalytic properties, Res. Chem. Intermed. 2012;38:595-613.
CrossRef - Hudson W. P. Carvalho., Marcus V. J. Rocha., Peter Hammer., Teodorico C. Ramalho. TiO2–Cu photocatalysts: a study on the long- and short-range chemical environment of the dopant, J. Mater. Sci. 2013;48:3904–3912.
CrossRef - M. Janczarek., A. Zielińska-Jurek., I. Markowska., J. Hupka. Transparent thin films of Cu–TiO2 with visible light photocatalytic activity, Photochem. Photobiol. Sci. 2015;14:591-596.
CrossRef - P. Pongwan., K. Wetchakun., S. Phanichphant., N. Wetchakun. Enhancement of visible-light photocatalytic activity of Cu-doped TiO2 nanoparticles, Res. Chem. Intermed. 2015;42:2815-2830.
CrossRef - M. You., T. G. kim., Y-M Sung., Synthesis of Cu-doped TiO2 nanorods with various aspect ratios and dopant concentrations, Cryst. Growth. Des. 2010;2:983-987.
CrossRef - F. Bensouici., M. Bououdina., A. A. Dakhel., R. Tala-Ighil., M. Tounane., A. Iratni., T. Souier., S. Liu., W. Cai. Optical, structural and photocatalysis properties of Cu-doped TiO2 thin films, Appl. Surf. Sci. 2017;395:110-116.
CrossRef - J. Choi., H. Park., M. R. Hoffmann, Effects of Single Metal-Ion Doping on the Visible-Light Photoreactivity of TiO2, J. Phys. Chem. C. 2010;114:783-792.
CrossRef - A. Kadam., R. Dhabbe., D-S. Shin., K. Garadkar., J. Park. Sunlight driven high photocatalytic activity of Sn doped N-TiO2 nanoparticles synthesized by a microwave assisted method. 2017;43 :5164-5172.
- M. Sahu., P. Biswas. Role of Surface Area, Primary Particle Size, and Crystal Phase on Titanium Dioxide Nanoparticle Dispersion Properties, Nanoscale Res. Lett. 2011;61-8.
- N. V. Minh., D. H. Long., N. T. Khoi., Y. Jung., S. J. Kim., I. S. Yang. Raman Studies of Ti1−x1−xFexxO22 Nanoparticles, Nanotech-Nol. 2008;7:177-180.
- K. Lalitha., J. Krishna Reddy., M. V. Phanikrishna Sharma., V. DurgaKumari., M. Subrahmanyam. Continuous hydrogen production activity over finely dispersed Ag2O/TiO2 catalysts from methanol:water mixtures under solar irradiation: A structure–activity correlation, Int. J. Hydrogen Energy. 2010;35:3991-4001.
CrossRef - C. D. Wagner., W. M. Riggs., L. E. Davis., J. F. Moulder., G. E. Muilenberg. Handbook of X-ray Photoelectron Spectroscopy, Perkin-Elmer Corp., Physical Electronics Division, USA. 1979.
- M. You., T. G. Kim., Y. M. Sung. Synthesis of Cu-Doped TiO2 Nanorods with Various Aspect Ratios and Dopant Concentrations, Cryst. Growth. Des. 2009;10:983-987.
CrossRef - H. Tang., H. Berger., P. E. Schmid., F. Levy., G. Burri. Photoluminescence in TiO2 anatase single crystals, Solid State Commum. 1993;87:847-850.
CrossRef - A. Bandgar., S. Sabale., S. H. Pawar. Studies on influence of reflux time on synthesis of nanocrystalline TiO2 prepared by peroxotitanate complex solutions, Ceram. Int. 2012;38:1905-1913.
CrossRef
Accepted on: 12-Oct-2018
Second Review by: Anuj Saini
Final Approval by: Jit Satyabrata


![]()
![]()
![]()