Establishment of Grid connected Solar Photovoltaic Power Plant on Rooftop of CSIR- Staff Quarter Building--Scientific & Industrial Research Scientist Apartment (SIRSA)
Introduction
From Literature review it was found, the strength of the solar PV system with Net-metering arrangements has increased from 7.6 GW in 2007 to 13.5 GW in 2008 and was 21 GW at the end of 2009. Similarly, annual solar PV generation also had increased from 3.7 GW in 2007 to 10.7 GW in 2009.1
The geographical location of India is in the equatorial sun belt of the earth, is advantageous because it receives enormous radiant energy from the sun. Clear sunny weather is available 250 to 300 days per annum in the most part of India, resulting in 1600 to 2200 kWh/sq.m radiation, which is comparable with radiation received in the tropical and subtropical regions. The equivalent energy potential is about 60,000 Lakhs GWh of energy per year.2
It is observed that during 2014-2017 India was able to achieve a non-conventional energy milestone, which includes solar power, wind energy or possibly small hydro plant which pushed the country’s renewable generation more than one lakh gigawatt hours (GWh) in a single year for the first time.3
The Central Electricity Authority reported 93,207 GWh of renewable electricity up to the end of February, and the more updated daily data from POSOCO’s National Load Despatch Centreshowed that a further 6,832 GWh had been generated by the end of March 29, to push the total over the 100,000 GWh line in FY 2017-18 with two days to spare.3
India’s renewable energy production now stands well ahead of the total electricity generation of relatively populous developing nations like the Philippines, or small but advanced economies like Belgium. It also exceeds all the electricity produced by Israel and Hong Kong combined – where virtually all power comes from burning coal, gas or oil.
More importantly, “actual generation” is a conservative and more revealing index of a country’s transition to clean energy than the widely used term “generation capacity”.3
Thermal coal plants in India are currently running at a little below 60% of their capacity, but these numbers are still substantially higher than those for renewables, dependent as they are on adequate sunshine for SPV plants. The energy actually generated for the grid puts the various sources on a more comparable footing.
Coal still dominates power production, but renewable generation now accounts for 7.7% of grid power averaged over the last 12 months – more than twice as much as nuclear energy. In December 2017, it exceeded large-scale hydro for the first time.3
Renewables are on track to contributing 10% of India’s year-round power by the end of 2019 – 21 years ahead of the forecast made by World Coal Association CEO Benjamin Sporton, who claimed in London’s Financial Times that “renewables like wind and solar in India (are) unlikely to reach 10 per cent of the (grid) mix before 2040”. On a monthly basis, Sporton’s claim was wrong even before he made it, as last July’s renewable generation produced 11.7% of India’spower.
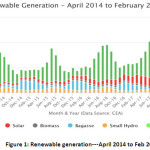
Figure 1: Renewable generation—April 2014 to Feb 2018.3
The major development this year has been the arrival of solar as a substantial contributor to the overall renewable generation – shown in red in the chart above. Several large solar parks are now up and running. Just this month, the first 600 MW of the 2000 MW Pavagada plant in Karnataka were commissioned, putting it on course to being the world’s largest solar plant.
However, it’s not all smooth sailing for renewable energy in India. As recently reported, solar investment has been threatened by the prospect of safeguard tariffs on imported solar equipment, the result of contradictory policy goals and the government’s clear commitment to renewables is matched by equivocal statements regarding the future of coal.
But renewable generation will keep growing, and next financial year, the 100 billionth unit of renewable energy will probably be produced in January or February, not the end of March.
In the light of above studies, CSIR-Central Glass & Ceramic Research Institute (CGCRI), one of the foremost laboratories in the family of the Council of Scientific and Industrial Research under the aegis of Central Government had already installed 100.5KWp(as per agreement)grid-connected solar power plant at SIRSA in order to supplement their energy consumption of the residential complex and it is running successfully. Initially, a capacity of 37.5KWp(as per agreement) roof-top grid-connected solar photo-voltaic plant was commissioned on February 2014 and another 63KWp(as per agreement) SPV plant was commissioned on the roof-top of same premises buildings on September 2017. Up to 31st March’2018 total generation from the plant is 251918 KWh, out of which we sold to CESC 46302 KWh after captive consumption in day time. The energy generation up to March’2018 saved Rs. 18.9 Lakhs approximately for CSIR-CGCRI.
Parameters involved in performance evaluation
Collection of the following data pertaining to Irradiation, Performance ratio, Degradation, life expectancy should be done for total performance evaluation [4];(see Appendix-I)
Terminology [5-9]; (See Appendix-II)
One needs to have a thorough understanding of the following terminologies for the execution of a Solar Power Plant: —
Beam Radiation, Diffuse Radiation, Total Solar Radiation, Irradiance (W/m2), Irradiation (J/m2), Solar Constant, Direct Normal Insolation (DNI)
Methodology
Considering the ever depleting fossil fuel sources, the conventional energy charges are expected to increase, whereas allocation for maintenance expenditure remains almost constant, thus leaving the scope for widening the gap. Considering the usage of Renewable Energy Source, we had explored possible economic solutions and approached the West Bengal Renewable Energy Development Agency (WBREDA), State Nodal Agency for implementation of Jawaharlal Nehru National Solar Mission (JNNSM) under Ministry of New & Renewable Energy (MnRE), Govt. of India. As per JNNSM criteria, MnRE shall bear approximately 30% of the total project cost related to Renewable Energy utilization, and balance 70% shall be borne by the Client Agency. Moreover, as per West Bengal Energy Regulatory Commission (WBERC) Notification, Net-Metering has been introduced in the state of West Bengal. Net Metering is an arrangement, by which customer can generate own electricity through Renewable Energy route, which can offset conventional energy and related expenditure. Any excess energy generated, can be given back to the grid, thus monthly billing cycle shall consider the only Net unit of energy. No Battery Bank is required for the purpose, thus recurring cost is avoided.
The benefit of the Plant
i) Supplementation of Conventional Energy.
ii) Peak Saving of demand.
iii) Green Energy— Environment-friendly.
iv) Reduction in the recurring monthly electricity bill of our Institute against that complex.
The uniqueness of the work
- Conceiving this work on a multistoried building rooftop (Ground + 10).
- To counter the technical uncertainties for maintaining the good health of the system.
- Weather pattern uncertainty and vulnerability of the total system on such height which counters lightning and wind pressure. To implement preventive measure against lightning CSIR-CGCRI was installed Early Streamer Emission (ESE) Arrestors and to counter the wind pressure at that height STAAD-PRO software was used to determine the load calculation and structural design for withstanding the load.
- This renewable energy generation root is the most suitable and clean form of energy, taking care of global warming and climate change phenomenon.
- Quality of all components including the structural system was adequately taken into consideration and has been suitably addressed.
- After witnessing a set back of an inverter getting burnt due to thunder and lightning in the first phase of work, reasons were searched and additional remedial actions were taken and hence replaced by the developers free of cost as per terms of the agreement.
Detail of the Project (Site)
The proposed project site is located on the campus of CSIR Residential Complex (SIRSA), 59 Lake Road, Kolkata- 700029. In the roof of all the buildings (excluding CSIR Guest-House).
Summary of the Project
CSIR-Central Glass & Ceramic Research Institute has set up Solar PV System at their residential complex in order to supplement their energy consumption for common service of the residential complex install 100.5kWp(as per agreement) Grid-connected Solar Plant.
Output voltage of the Power Plant was 440V AC and has to be synchronized with grid at the AC bus bar of the Main service panel at 440V, 3ø 4 Wire system.
There was no need for storage battery because the system is grid interfaced.
Virtually there was no need of installation of distribution network since there will be a dedicated line feeding the PV generated power into the AC Bus Bar of main Service panel i.e. the LT receiving and load distribution point.
Major system components are— Solar PV Module, Array Junction Box, Inverter, AC Distribution Board, Data-logger and Import-Export energy meter.
An agreement with CESC was executed for Net Metering facility.
The entire plant was insured from fire and other perils through National Insurance Co. Ltd.
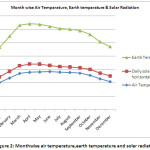
Table 1: Summarizes the meteorological data along with air temperature, earth temperature and irradiation.
Table 1: Meteorological Data
|
|
Unit
|
Climate Data of location
|
|
Latitude
|
̊N
|
22.57
|
|
Longitude
|
̊E
|
88.37
|
|
Elevation
|
M
|
22
|
|
Frost days at site
|
day
|
0
|
|
Month
|
Air Temperature (degC)
|
Daily solar radiation- horizontal (kWh/ m2/ d)
|
Earth Temperature(degC)
|
|
January
|
20.2
|
4.27
|
22
|
|
February
|
23.6
|
4.93
|
26.4
|
|
March
|
27.1
|
5.66
|
30.5
|
|
April
|
27.9
|
6.11
|
30.3
|
|
May
|
28.1
|
5.82
|
29.9
|
|
June
|
28.4
|
4.51
|
29.4
|
|
July
|
28
|
4.11
|
28.6
|
|
August
|
27.8
|
3.99
|
28.4
|
|
September
|
27.3
|
3.94
|
27.9
|
|
October
|
25.7
|
4.36
|
26.2
|
|
November
|
23
|
4.24
|
23.5
|
|
December
|
20.9
|
4.14
|
22
|
|
Annual Average
|
25.7
|
4.67
|
27.1
|
Figure 2: Monthwise air temperature, earth temperature and solar radiation.
Results and Discussion
For the first time in India’s power generation history, the financial year 2017-18 saw renewable energy production reach the 1 lakh Gigawatt-hour mark. This achievement came almost at the end of the financial year on 29 March, tracked by the National Load Dispatch Centre of the Power Systems Operations Company (POSOCO). Within a span of two years, Pavagada Solar Park in Karnataka would be the largest single-site solar plant in the world after attaining its full 2 GW installed capacity.10
The city of Diu, which is actually a centrally administered territory was recognized as the first city in India to meet-up its day-time power requirement through the solar plant. This small city has historically been dependent on Gujarat to supply almost all its power. This changed with the Smart Cities mission. Diu set up a 9 Megawatt (MW) solar plant and installed another 1.3 MW capacity using government building rooftops. Diu also started incentivizing rooftop solar installations, paying Rs 10,000 subsidy for every kilowatt (KW) of installed capacity. Running entirely on solar power during day-time, even negotiating the summer peaks is no mean achievement for any Indian city. Gandhinagar in Gujarat also aspires to use solar as its predominant power supply source. The city is working towards creating a 5 MW captive installed base, using government and private residential buildings to put up generation units.10
Off-grid & On-grid solar PV systems
The “Usage of Solar power” benefits to the society by the means of green revolution along with the economy. It is noteworthy that in the long run there is a reduction in electrical energy charges. However, there are two types of the system we choose —1) grid-tied solar power systems and 2) off-grid systems, in order to select the solar power option that is suitable to us.
Off-Grid Solar PV Systems
This type of solar electric system is not connected to the electrical utility grid. It relies on batteries to store the electricity produced by the solar panels for use when the system is unable to produce sufficient energy (for example: at night) to meet household functions or any other electrical loads. This system is expensive than Grid-tied system due to Battery cost and it will require a recurring maintenance cost of battery at the same time disposal of waste battery is another big issue.
Grid-Tied Solar PV Systems
The system comprising grid interfacing between Utility supply and Solar Power. It includes the possibility to earn, sell, and generate revenue from local DISCOM’s. In this case, the utility company will pay us for the exported solar energy, which we could inject in the utility grid after captive use. Further, where the Solar Power Plant is not capable to generate enough electricity to power the home/ Electrical loads, the utility supply grid will supply electricity whenever needed. This system also is more cost-effective than Off-grid system.
When choosing a solar power system, it is important to decide when we are going to utilize the system. For example, if we want to utilize solar power at night, then a battery based off-grid system is the only option, otherwise, a grid-tied system may be the best choice.
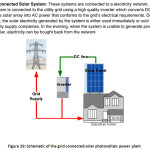
Grid-tied solar power systems is connected, or “tied” to the existing utility electrical grid. The electricity that is produced by the solar power plant flows freely back to the grid, and to the utility company through net-metering arrangements. The direct benefit for the electricity generated by the solar panels of the consumers is obtaining credit. As long as the solar array generates more electricity than the captive use, the electricity will be free to inject in the utility grid. If the consumer consumes more electricity than is generated, then they will be billed for only the excess consumption.
For the SIRSA SPV Plant, energy generated through solar modules is initially consumed by the connected load at day time (captive use). If solar power generation exceeds the load demand, then the excess power will feed to the DISCOM’s grid.
Why does the solar panel size matter?
Output Power is directly proportional to the no. of the solar cell in a panel. The more solar cells working in tandem, the more power they’ll create. Therefore, the size of a panel matters.
The efficiency of the solar cell is increasing day by day, resulting in comparatively more electricity generation from similar size solar panel than earlier.
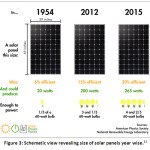
Figure 3: Schematic view revealing the size of solar panels year wise.11
If one looks closely at the solar panel in the image above, one would notice 60 little squares. These squares are actually individual solar “cells,” which are linked together by wires. The cells are where electricity is made, and the wires carry the electricity to a junction box where the panel is hooked into a larger array.
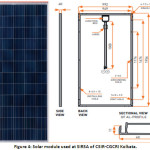
In the SIRSA Plant, each 240 Wp(1639 mm x 982 mm x 36 mm) module consisting 60 cells and each 315 Wp (1956mm x 992mm x 40mm) module consisting 72 number of cells.
Figure 4: Solar module used at SIRSA of CSIR-CGCRI Kolkata.
How is a solar panel’s rating calculated?
Solar panels would have a number listed on the back that indicates how much power they would pump out during ideal conditions. This is called the Standard Test Condition rating (STC for short).
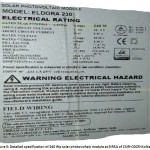
Here is what a label looks like on the back of the solar panel:
Figure 5: Detailed specification of 240 Wp solar photovoltaic module at SIRSA of CSIR-CGCRI Kolkata.
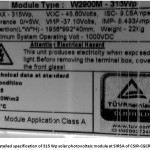
Figure 6: Detailed specification of 315 Wp solar photovoltaic module at SIRSA of CSIR-CGCRI Kolkata.
To determine an STC rating, solar labs test the panels under ideal conditions called “peak sun,” or 1000 watts of sunlight per square meter of surface. That approximately equals to the power of the sun at noon, on a sunny day, at the equator.
In (Figs. 5&6), the label shows an STC rating of 240 watts (Figure.5) & 315 watts (Figure.6) for the panel. If that panel received full sun for one hour, one would get 240 watt-hours& 315 watt-hours respectively of electricity.
The results of solar power generation at our SIRSA complex have been explained in their proper perspective.
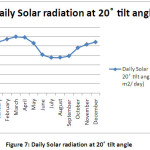
Month-wise daily average Terrestrial Solar radiation on an inclined plane of PV Array at SIRSA complex is revealed in Table. 1.….
Table 2: Month-wise daily average Terrestrial Solar radiation on an inclined plane of PV Array
|
Month
|
Daily Solar radiation at 20 ̊ tilt angle (kWh/ m2/ day)
|
|
January
|
5.42
|
|
February
|
5.72
|
|
March
|
5.98
|
|
April
|
5.91
|
|
May
|
5.30
|
|
June
|
4.08
|
|
July
|
3.78
|
|
August
|
3.79
|
|
September
|
3.95
|
|
October
|
4.81
|
|
November
|
5.17
|
|
December
|
5.41
|
|
Annual Average
|
4.94
|
Figure 7: Daily Solar radiation at 20 ̊ tilt angle
Table 2 depicts the design input data of SPV Plant at SIRSA.
Table 3: Design Input Data:
|
Description
|
Unit
|
Data
|
|
PV Array Data
|
|
Nominal PV array capacity
|
kWp
|
101.31
|
|
Slope angle of PV Array
|
Degree
|
20
|
|
Number of Module
|
Nos.
|
359
|
|
Spacing factor between two row
|
|
Almost 1.65
|
|
PV Array Yard Data
|
|
Albedo
|
|
0.20
|
|
Azimuth angle of PV Array wrt true south
|
Degree
|
0.00
|
|
Inter Array Strip space data
|
|
Shadow free time start (24 hr basis)
|
hr
|
8.00
|
|
Shadow free time end (24 hr basis)
|
hr
|
15.00
|
|
PV Module data at 25̊ C
|
|
PV Module Rating
|
Wp
|
240 (157 nos.) & 315 (202 nos.)
|
|
Rated efficiency of PV Module
|
%
|
14% (240Wp) &16.15% (315Wp)
|
|
Fill factor
|
%
|
70-75
|
|
Temperature Coefficient
|
%/C
|
0.5
|
|
Overall system efficiency
|
%
|
90
|
|
Inverter
|
|
Total Capacity
|
kVA
|
95
|
|
Nos. of Inverter
|
Nos.
|
7 (20 KVA- 3 nos., 10KVA- 3nos. & 5 KVA- 1 no.)
|
Energy Generation Scenario
Financial year (FY) wise, the Energy Generation Scenario has been exemplified in Tables (3-7) & also in Figs. (8-17).
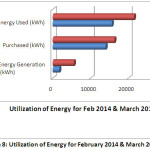
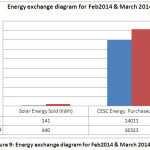
Table 4: Energy generation for the FY- 2013-14 ( Feb 2014-March 2014)*
|
|
Solar Energy Used (kWh)
|
Solar Energy Sold (kWh)
|
Total Solar Energy Generation (kWh)
|
CESC Energy Purchased (kWh)
|
Total Energy Used (kWh)
|
|
February’14
|
1618
|
141
|
1759
|
14011
|
15770
|
|
March’14
|
5168
|
440
|
5608
|
16323
|
21931
|
|
Total
|
6786
|
581
|
7367
|
30334
|
37701
|
*For the year 2013-14 ( As the SPV Plant was installed in Feb’2014, the general energy generation is taken for two months)
Figure 8: Utilization of Energy for February 2014 & March 2014
Figure 9: Energy exchange diagram for Feb2014 & March 2014
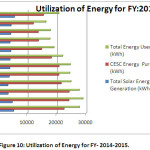
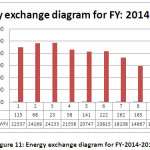
Table 5: Energy generation for the FY -2014-2015
|
Month
|
Solar Energy Used kWh
|
Solar Energy Sold kWh
|
Total Solar Energy Generation (kWh)
|
CESC Energy Purchased (kWh)
|
Total Energy Used (kWh)
|
|
April’14
|
5242
|
115
|
5357
|
22537
|
27779
|
|
May’14
|
4821
|
68
|
4889
|
24169
|
28990
|
|
June’14
|
3458
|
23
|
3481
|
24233
|
27691
|
|
July’14
|
3355
|
58
|
3413
|
21556
|
24911
|
|
August’14
|
3735
|
141
|
3876
|
20747
|
24482
|
|
September’14
|
3836
|
222
|
4058
|
20815
|
24651
|
|
October’14
|
3878
|
262
|
4140
|
18208
|
22086
|
|
November’14
|
4234
|
185
|
4419
|
14867
|
19101
|
|
December’14
|
3938
|
190
|
4128
|
13806
|
17744
|
|
January’15
|
4153
|
232
|
4385
|
13716
|
17869
|
|
February’15
|
4286
|
229
|
4515
|
12074
|
16360
|
|
March’15
|
5238
|
398
|
5636
|
15519
|
20757
|
|
Total
|
50174
|
2123
|
52297
|
222247
|
272421
|
|
Average p.m.
|
4181.17
|
176.92
|
4358.08
|
18520.58
|
22701.75
|
Figure 10: Utilization of Energy for FY- 2014-2015.
Figure 11: Energy exchange diagram for FY-2014-2015.
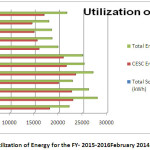
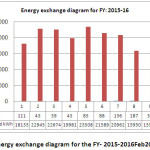
Table 6: Energy generation for theFY- 2015-2016
|
Month
|
Solar Energy Used, kWh
|
Solar Energy injected to the grid of utility provider, kWh
|
Total Solar Energy Generation, kWh
|
CESC Energy Purchased, kWh
|
Total Energy consumed, kWh
|
|
April’15
|
4028
|
111
|
4139
|
18133
|
22161
|
|
May’15
|
5021
|
43
|
5064
|
22945
|
27966
|
|
June’15
|
3493
|
59
|
3552
|
22674
|
26167
|
|
July’15
|
2871
|
43
|
2914
|
19981
|
22852
|
|
August’15
|
3586
|
85
|
3671
|
23508
|
27094
|
|
September’15
|
3685
|
88
|
3773
|
21589
|
25274
|
|
October’15
|
4006
|
136
|
4142
|
20962
|
24968
|
|
November’15
|
3917
|
187
|
4104
|
15950
|
19867
|
|
December’15
|
3057
|
54
|
3111
|
15567
|
18624
|
|
January’16
|
3603
|
67
|
3670
|
14933
|
18536
|
|
February’16
|
3466
|
114
|
3580
|
14506
|
17972
|
|
March’16
|
4685
|
320
|
5005
|
16996
|
21681
|
|
Total
|
45418
|
1307
|
46725
|
227744
|
273162
|
|
Average p.m.
|
3784.83
|
108.92
|
3893.75
|
18978.67
|
22763.50
|
Figure 12: Utilization of Energy for the FY- 2015-2016February 2014 & March 2014
Figure 13: Energy exchange diagram for the FY- 2015-2016Feb2014 & March 2014
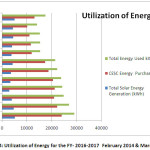
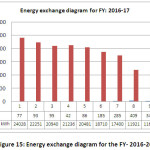
Table 7: Energy generation for theFY 2016-2017
|
Month
|
Solar Energy Used, kWh
|
Solar Energy injected to the grid of utility provider, kWh
|
Total Solar Energy Generation, kWh
|
CESC Energy Purchased, kWh
|
Total Energy consumed,kWh
|
|
April’16
|
5060
|
77
|
5137
|
24028
|
29088
|
|
May’16
|
4644
|
93
|
4737
|
22251
|
26895
|
|
June’16
|
3889
|
95
|
3984
|
20940
|
24829
|
|
July’16
|
2939
|
42
|
2981
|
21236
|
24175
|
|
August’16
|
3332
|
86
|
3418
|
20481
|
23813
|
|
September’16
|
3458
|
185
|
3643
|
18710
|
22168
|
|
October’16
|
3953
|
285
|
4238
|
17400
|
21353
|
|
November’16
|
3447
|
409
|
3856
|
11921
|
15368
|
|
December’16
|
3675
|
346
|
4021
|
11657
|
15332
|
|
January’17
|
4133
|
400
|
4533
|
11071
|
15204
|
|
February’17
|
3912
|
480
|
4392
|
10159
|
14071
|
|
March’17
|
4384
|
698
|
5082
|
13104
|
17488
|
|
Total
|
46826
|
3196
|
50022
|
202958
|
249784
|
|
Average p.m.
|
3902.17
|
266.33
|
4168.50
|
16913.17
|
20815.33
|
Figure 14: Utilization of Energy for the FY- 2016-2017 February 2014 & March 2014
Figure 15: Energy exchange diagram for the FY- 2016-2017
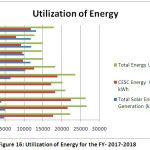
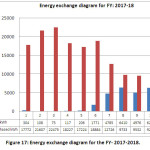
Table 8: Energy generation for the FY- 2017-2018
|
Month
|
Solar Energy Used kWh
|
Solar Energy Sold kWh
|
Total Solar Energy Generation (kWh)
|
CESC Energy Purchased kWh
|
Total Energy Used kWh
|
|
April’17
|
4453
|
304
|
4757
|
17772
|
22225
|
|
May’17
|
4977
|
108
|
5085
|
21607
|
26584
|
|
June’17
|
3908
|
75
|
3983
|
22475
|
26383
|
|
July’17
|
2768
|
117
|
2885
|
18227
|
20995
|
|
August’17
|
3062
|
206
|
3268
|
17224
|
20286
|
|
Total
|
19168
|
810
|
19978
|
97305
|
116473
|
|
September’17
|
4650
|
1771
|
6421
|
18884
|
23534
|
|
October’17
|
5524
|
4785
|
10309
|
12726
|
18250
|
|
November’17
|
5298
|
6410
|
11708
|
9733
|
15031
|
|
Dece,ber’17
|
5154
|
4976
|
10130
|
9532
|
14686
|
|
January’18
|
5628
|
6288
|
11916
|
9248
|
14876
|
|
February’18
|
4904
|
6895
|
11799
|
7916
|
12820
|
|
March’18
|
6086
|
7163
|
13249
|
11825
|
17911
|
|
Total
|
37244
|
38288
|
75532
|
79864
|
117108
|
* FY 2017-18 (The 2nd phase Solar Plant having capacity of 63 KWp(as per agreement) was installed at the same premises to enhance the entire plant capacity by 100.5 KWp(as per agreement) in the month of September-2017
Figure 16: Utilization of Energy for the FY- 2017-2018
Figure 17: Energy exchange diagram for the FY- 2017-2018.
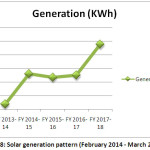
Table 9: Year-wise Solar generation ( February 2014 – March 2018)
|
Financial year
|
Generation (KWh)
|
|
FY 2013-14
|
7367
|
|
FY 2014-15
|
52297
|
|
FY 2015-16
|
46725
|
|
FY 2016-17
|
50022
|
|
FY 2017-18
|
95510
|
Figure 18: Solar generation pattern (February 2014 – March 2018)
Performance Ratio (PR) of the Plant
Performance Ratio (PR) of a plant for a period of time is:–
energy measured(kWh)/(Irradiance(kWh/m2) on the panel x Active area of PV module(m2) x PV module efficiency……….(1)
Year wise performance ratio
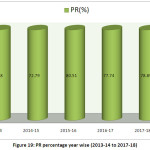
Figure 23 and Table 13 depict the trend and performance of the year-wise performance ratio of our Solar Power Generating System.
Table 10
|
Financial Year
|
PR(%)
|
|
2013-14
|
73.28
|
|
2014-15
|
72.79
|
|
2015-16
|
80.51
|
|
2016-17
|
77.74
|
|
2017-18
|
78.89
|
Figure 19: PR percentage year wise (2013-14 to 2017-18)
Energy Compensation Scenario by Solar Plant at SIRSA
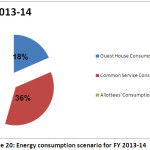
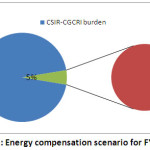
Table 11: Energy Compensation Scenario for FY 2013-14
|
Financial Year: 2013-14
|
|
Guest House Consumption
|
48200
|
|
Common Service Consumption
|
93908
|
|
Allottees’ Consumption
|
118652
|
|
CSIR-CGCRI burden
|
134741
|
|
Solar Compensated
|
7367
|
Figure 20: Energy consumption scenario for FY 2013-14
Figure 21: Energy compensation scenario for FY 2013-14
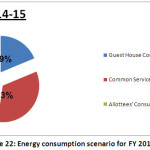
Table 12
|
Financial Year: 2014-15
|
|
Guest House Consumption
|
50918
|
|
Common Service Consumption
|
91404
|
|
Allottees’ Consumption
|
129588
|
|
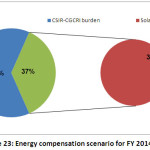
CSIR-CGCRI burden
|
90025
|
|
Solar Compensated
|
52297
|
Figure 22: Energy consumption scenario for FY 2014-15
Figure 23: Energy compensation scenario for FY 2014-15
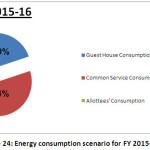
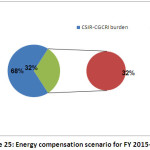
Table 13
|
Financial Year : 2015-16
|
|
Guest House Consumption
|
54409
|
|
Common Service Consumption
|
92701
|
|
Allottees’ Consumption
|
126771
|
|
CSIR-CGCRI burden
|
100387
|
|
Solar Compensated
|
46723
|
Figure 24: Energy consumption scenario for FY 2015-16
Figure 25: Energy compensation scenario for FY 2015-16
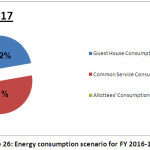
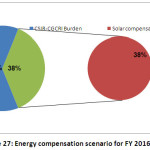
Table 14
|
Financial Year : 2016-17
|
|
Guest House Consumption
|
55580
|
|
Common Service Consumption
|
77082
|
|
Allottees’ Consumption
|
117134
|
|
CSIR-CGCRI Burden
|
82640
|
|
Solar compensated
|
50022
|
Figure 26: Energy consumption scenario for FY 2016-17
Figure 27: Energy compensation scenario for FY 2016-17
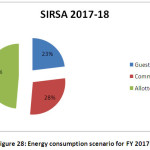
Table 15
|
FY 2017-18
|
|
Guest House Consumption
|
53896
|
|
Common Service Consumption
|
66111
|
|
Allottees’ Consumption
|
113571
|
|
CSIR-CGCRI burden
|
24497
|
|
Solar Compensated
|
95510
|
Figure 28: Energy consumption scenario for FY 2017-18
Performance Monitoring Mechanism:
Performance data monitoring (Daily, Monthly, Yearly energy generation) system will be provided for generation and other parameters data-logging.
The web-enabled data logging system is a separate unit. The data logging system includes a PV string monitoring system also. The data Logger should have the provision of recording the data of solar insolation and ambient temperature and associated electrical parameters at different stages to study the performance of the system as well as to study the status of the system at a particular instant. The data logger should have required transducer to monitor and record the required system data. The data logger should be provided with an insolation meter and a temperature meter matched with the system. The data logger shall have reliable battery backup and data storage capacity to record all sorts of data simultaneously round the clock. Web-based Data Logger and remote monitoring must be compatible with data logger software. The system shall be provided with GSM Modem with the required SIM card. The modem must be compatible with GSM and /or GPRS system. The other required accessories, hardware and compatible software shall have to be provided as an integrated part of the system to monitor the real-time data (maximum 20 minutes delay) through a web server. The Datalogger shall continuously send data to the server. The system can be monitored from anywhere through the internet without installing any special software.
The Schematic of the grid-connected solar photovoltaic power plant is revealed in Figure 34.
Figure 29: Schematic of the grid-connected solar photovoltaic power plant
Conclusion
The aforesaid study leads to the following conclusions:
At present, the most crucial global challenge is to control the global warming which in turn largely depends upon carbon emission which eventually depends upon the type of energy generated. Solar Photovoltaic Energy Generation is such a key technology to produce decarbonised electrical energy and has currently emerged as an attractive alternate electricity source to combat such temperature rise.
As a contribution to the above global green energy revolution, CSIR-CGCRI has utilised the entire available rooftops of the residential quarters and installed 37.5(as per agreement) kWp Solar Photovoltaic Power Plant in 2014 and further enhanced its capacity in 2017 to 100.5 kWp (as per agreement)thereby reducing the carbon footprint to a substantial level.
Results revealed that due to the capacity enhancement, there is an overall growth of solar power energy generation having on an average performance ratio of more than 80%.
Apart from generating clean energy, CSIR-CGCRI is also benefitted by less energy purchase from local DISCOM.
Acknowledgments
The authors wish to express their gratitude to the Director, Dr. K. Muraleedharan and to Shri Avijit Ghosh for their guidance and constant encouragement throughout the tenure of this work. The authors would like to acknowledge Mr. Rajib Kar, Mr. Arup Chatterjee, and Bidyut Kumar Das for their enormous assistance throughout the tenure of this work.
Funding Source
This is not at all any externally funded project, the funding is done by CSIR-Central Glass & Ceramic Research Institute
References
- Global Status Report on “Renewables 2010”, REN21.
- Status Report on “Performance of Solar Power Plants in India”, Central Electricity Regulatory Commission, New Delhi Feb (2011).
- Charles Worringham, Update on Renewable Generation, [Source: indiapowerreview.com] https://indiapowerreview.com/indian-solar-grid-generation-keeps-on-growing/March 29 (2018)
- International Energy Agency, “Methodology Guidelines on Life Cycle Assessment of Photovoltaic Electricity”, IEA PVPS Task 12, Subtask 20, LCA Report IEA-PVPS T12-01;(October 2009).
- M.Chegaar, A. Lamri and A. Chibani, “Estimating Global Solar Radiation Using Sunshine Hours”, Physique Energétique (1998) 7 – 11.
- Zaharim Azami, Razali Ahmad Mahir, Gim Tee Pei, Sopian Kamaruzzaman, “Time Series Analysis of Solar Radiation Data in the Tropics”, European Journal of Scientific Research, Vol.25 No.4 (2009), pp.672-678.
- Duffie John A, William Beckman A, “Solar Engineering of Thermal Processes, 3rd Edition, 2006, John Wiley and Sons Inc, Pp 3 – 138.
- Sen, Zekai, Solar energy fundamentals and modelling techniques: atmosphere, environment, climate change and renewable energy, Springer, 2008, Pp 44-70.
- Solar Radiation Hand Book, Solar Energy Centre, MNRE and Indian Metrological Department (2008).
- IMD Pune website, http://www.imdpune.gov.in/, accessed on 20th June 2010.
- Hall James and Hall Jeffrey, “Evaluating the Accuracy of Solar Radiation Data Sources”, Solar Data Warehouse.(February 2010).
- M. Chegaar, P. Mialhe, “Effect of atmospheric parameters on the silicon solar cells performance”, Journal of Electron Devices, Vol. 6, 2008, pp. 173-176.
- Aashish Chandorkar, Swarajya, https://swarajyamag.com/infrastructure/solar-power-in-india-several-bright-spots-amidst-periodic-question-marks?utm_source=one-signal( April 2018).,
- Ben Zientara, https://solarpowerrocks.com/solar-basics/how-much-electricity-does-a-solar-panel-produce/
Appendix-I, Ref.-4
A. Irradiation – Data from different sources has been analysed and the source identified based on the accuracy perception for the present study.
B.. Performance ratio – It is observed that performance ratio depends on the irradiation, the optimum angle of tilt, air temperature, design parameters, quality of modules, the efficiency of inverter etc. The results have been compared with some data available on the recently installed grid-connected power plants in India.
C. Degradation – All manufacturers stand a guarantee of performance over a period of 25 years with 90% output for the first 12 years and up to 80% after 25 years of operation. Various studies carried out by global renowned institutions on the extent of degradation of the output of modules after long term operation in the field. These results are analyzed to arrive at the actual field performance.
D. Life expectancy – Trends in the accelerated tests for modules, inverters, supporting structure and cabling have been studied.
Appendix-II, Ref.-5-9
Beam Radiation – solar radiation received from the Sun without being scattered by the atmosphere and propagating along the line joining the receiving surface and the sun. It is also referred to as direct radiation. It is measured by a pyrheliometer.
Diffuse Radiation – the solar radiation received from the Sun after its direction has been changed due to scattering by the atmosphere. It does not have a unique direction and also does not follow the fundamental principles of optics. It is measured by shading pyranometer.
Total Solar Radiation – the sum of the beam and diffuse radiation on a surface. The most common measurements of solar radiation is total radiation on a horizontal surface often referred to as ‘global radiation’ on the surface. It is measured by a pyranometer.
Irradiance (W/m2) – the rate at which incident energy is incident on a surface of unit area. The symbol G is used to denote irradiation.
Irradiation (J/m2) – the incident energy per unit area on a surface, found by integration of irradiation over a specified time, usually an hour (I) or a day (H).
Solar Constant – The solar constant is the amount of incoming solar radiation per unit area, measured at the outer surface of Earth’s atmosphere, in a plane perpendicular to the rays
Direct Normal Insolation (DNI) – It is the direct component of the solar radiation incident normal to the collector; that is, the angle of incidence of solar radiation with the normal of the collector is zero throughout the day.

This work is licensed under a Creative Commons Attribution 4.0 International License.

 , Sujoy Roy and Susapta Ghosh