Xuan-Dung Mai1* , Quang-Trung Le1, Lan-Anh Nguyen Thi1, Phuong Nguyen Thi1, Phuong Le Thi1 and Viet-Hong La2
1Department of Chemistry, Hanoi Pedagogical University, Vietnam
2Department of Biology, Hanoi Pedagogical University, Vietnam
Corresponding Author’s Email: xdmai@hpu2.edu.vn
DOI : http://dx.doi.org/10.13005/msri/160205
Article Publishing History
Article Received on : 28-July-2019
Article Accepted on : 07-Aug-2019
Article Published : 10 Aug 2019
Plagiarism Check: Yes
Reviewed by: Rajender Boddula
Second Review by: Abhisek Sasmal
Final Approval by: Simona Condurache
Article Metrics
ABSTRACT:
Nanocomposites (NCs) of silver nanoparticles (Ag NPs) and carbon quantum dots (CQDs) have been received increasing attention for diverse applications including sensing, photocatalyst, surface enhanced Raman scattering detection and antibacterial. Herein, we report a unique photosynthesis of Ag NPs-CQD using CQDs as photo-reducing agent. Highly luminescent CQDs were prepared by a hydrothermal method using a mixture of citric acid (CA) and ethylenediamine (EDA) as starting precursors. X-ray diffraction pattern (XRD), transmission electron microscope (TEM), infrared (IR) and Raman spectroscopies confirmed the formation of NCs. We have demonstrated that the formation of Ag NPs accompanied with the degradation of surface fluorophores, which responded for the resolved absorption peak at ca. 346 nm and high luminescence of pristine CQDs. The NCs showed excellent antibacterial affinity to Escherichia coli. The results provide new understandings on the interactions between CQDs and silver ions as well as potential applications of Ag NP – CQD nanocomposites.
KEYWORDS:
Antibacterial; Carbon Quantum Dots; Nanocomposites; Surface Fluorophore; Silver Nanoparticles
Copy the following to cite this article:
Mai X-D, Le Q-T, Thi L-A N, Thi P. N, Thi P. L, La V-H. Photosynthesis of Silver Nanoparticle – Carbon Quantum Dots Nanocomposites. Mat. Sci. Res. India; 16 (2).
|
Copy the following to cite this URL:
Mai X-D, Le Q-T, Thi L-A N, Thi P. N, Thi P. L, La V-H. Photosynthesis of Silver Nanoparticle – Carbon Quantum Dots Nanocomposites. Mat. Sci. Res. India; 16 (2). Available from: http://bit.ly/2TiDW55
|
Introduction
Ag NPs have gained significant interest for diverse applications, such as bio-sensing,1 catalysts,2 antimicrobial,3 and antibacterial applications.4 Ag NPs have been widely synthesized by reducing of Ag+ ions with suitable reducing agents such as ascorbic acid,5 chitosan,6 NaBH4,7 glucose8 and other naturally extract products. In these protocols, a stabilizing agent is usually needed to prevent Ag NPs from aggregation.9 Carbon quantum dots (CQDs) are a new class of carbon nanomaterials that are currently accepted to consist of a carbogenic core containing polyaromatic hydrocarbons, surface fluorophores, and surface simple groups, e.g. –COOH, -NH-, -OH, etc. CQDs have emerged to be nontoxic, bio-compatible, and highly luminescent materials for diverse applications including bio-imaging,10,11 light emitting diode12 and photo-catalysts in the visible region.13 Although CQDs could be synthesized by several methods and many carbon resources could be used, CQDs synthesized from a mixture of CA and EDA by a hydrothermal method have been demonstrated to have excellent luminescence and biocompatibility. From now on, we denoted CQDs synthesized from CA and EDA as CA-CQDs. It was reported that the lowest unoccupied molecular orbital (LUMO) level of CA-CQDs to be about -0.96 V with respect to the standard hydrogen electrode (SHE),14 making CA-CQDs possible to reduce many metal ions when excited. In fact, efficient electron transfer from CA-CQDs to metal ions has been utilized to use CQDs as photoluminescence sensors for the detection of heavy metal ions such as Hg2+, Cu2+ or Fe3+.14,15 Several types of CQDs have been used as reduction to synthesize Ag NPs.16,17 However, the changes in the physicochemical properties of CQDs after the reaction with Ag+ have not been reported. In this work, we demonstrate the synthesis of Ag NPs by using CA-CQDs as a photo- reducing agent. Study the morphology of Ag NPs as well as the optical properties of CQDs revealed that the formation of Ag NPs accompanied with the degradation of surface fluorophore of CQDs.
Materials and Methods
Materials
Chemicals including citric acid monohydrate (CA, 99%, Aladdin Chemical), ethylenediamine (EDA, 99%, Aladdin Chemical), AgNO3 (99.8%, Aladdin Chemical) and NaOH (99.9%, Merck Chemical) were purchased and used without any purifications. Deionized water was prepared by a double distillation process and used as a solvent for the synthesis of CA-CQDs.
The synthesis and purification of CA-CQDs
The CA-CQDs were prepared by a hydrothermal method. Briefly, 1.2608 (g) CA and 0.780 ml of EDA were dissolved in 35 ml of DI water and then transferred into a Teflon lined autoclave. The reaction was carried out at 200oC for 5 hours. After being cooled down to room temperature naturally, acetone was added to precipitate CA-CQDs, which were then collected by centrifugation and re-dispersed in DI water. The purification process was repeated several times. Finally, CA-CQDs were filtered through 0.2 µm PTFE filters to remove large aggregates.
The synthesis of NCs
1 ml of 1-weight percentage CA-CQDs solution and 2 ml of 70 mM NaOH solution were mixed in a quartz beaker. 1 ml of 140 mM AgNO3 solution was then added and the mixture was and stirred under UV illumination at 365 nm for 1 hour. NCs formed as a black precipitate, which was collected by filtration and rinsed with DI water until the filtrate did not form a white precipitate with a NaBr solution. CA-CQDs that remained soluble in water were separated by precipitation with acetone and denoted as Af-CQDs.
Characterizations
Fourier-transform infrared (FT-IR) spectra were obtained by means of a Jasco FT / IR6300 spectrometer. Raman spectra were obtained on a LabRAM HR (HORIBA Jobin Yvon). X-ray diffraction patterns were obtained on a Bruker D5005 diffractometer. Transmission electron microscope (TEM) images were obtained on a JEM 2100, JEOL. The UV/VIS spectra were obtained by using a Shimadzu UV 2450 spectrophotometer.
Antibacterial Test
Gram-negative Escherichia coli (E. coli) bacteria were selected to evaluate the antibacterial activity of NCs. The identity of the bacterial strains was confirmed morphologically by using biochemical techniques. The agar plate punching method was used to evaluate the antimicrobial activity of the sensitized NCs. 10 ml of nutrient agar medium was poured into sterile Petri dishes and then plated homogeneously with 50 µl of E. coli solution. After incubation at 37°C for 18 h, NCs solutions with different concentrations (1wt%, 0.5wt% and 0.25 wt%) were dropped into pre-made holes. After incubation for another 18 h at 37oC, the diameter of rings was measured to evaluate the antibacterial activity of NCs.
Result and Discussion
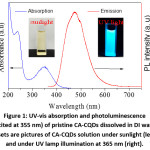
Figure 1: UV-vis absorption and photoluminescence (excited at 355 nm) of pristine CA-CQDs dissolved in DI water. Insets are pictures of CA-CQDs solution under sunlight (left) and under UV lamp illumination at 365 nm (right).
The optical properties of pristine CA-CQDs are summarized in Fig. 1. CA-CQDs exhibited a broad absorption band at 346 nm, which originated from HOMO→LUMO transition in surface fluorophore.14,18–20 An absorption shoulder at 237 nm could be attributed to π→π* transition in polyaromatic hydrocarbons within the carbogenic core of CA-CQDs.21,22 When excited with a wavelength of 355 nm, CA-CQDs exhibited a broad emission spectrum, maximized at 475 nm, the features have been widely reported for CA-CQDs.14,18–20,23 In addition, CA-CQDs also showed an absorption tail originated from the transitions related to surface groups 21 or π-π stacked CQDs.24 The absorption tail that extended into the visible region with decreasing absorption coefficient was clearly visible from the absorption spectra of concentrated CA-CQDs solutions.
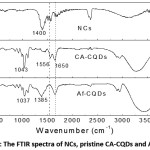
Figure 2: The FTIR spectra of NCs, pristine CA-CQDs and Af-CQDs.
FT-IR spectra of pristine CA-CQDs, Af-CQDs and NCs are shown in Fig. 2. All samples exhibited a broad absorption in the region from 3050 cm-1 to 3600 cm-1, which could be attributed to stretching vibrations of O-H, N-H or water remained in the samples 15. The absorption in the 2800 cm-1 – 3000 cm-1 was due to C-H stretching vibrations of aliphatic hydrocarbon.13,15 The absorption peak at 1650 cm-1 was due to stretching vibration of C=O in amide (-CONH-) or vibration of C=C in N-containing aromatics while the absorption at 1556 cm-1 was assigned to bending vibration of N-H in amide.14,18 In FT-IR spectra of NCs and CA-CQDs after the reaction, a strong absorption appeared at ca. 1380 – 1400 cm-1, which could be attributed to stretching vibration of N-O in nitro groups, bending vibration of α-CH2 in ketones or stretching vibration of –COO– groups.25 The absorption at ca. 1040 cm-1 observed in CA-CQDs could be due to O-C stretching vibration.
It has been reported that CA-CQDs consist of polyaromatic hydrocarbons embedded in aliphatic hydrocarbon, so called carbogenic core, surface fluorophore and other surface simple functional groups such as –OH, -COOH, -NH-, etc.21,23,26 The existence of surface fluorophore, which is derivatives of citrazinic acid in the case of CA-CQDs,18,20,26 was indicated by the amide absorption bands at 1650 and 1556 cm-1. However, after the reaction between CA-CQDs and Ag+, the bending vibration of N-H bond in amide groups at 1556 cm-1 disappeared in the FT-IR spectrum of Af-CQDs. This disappearance accompanied with the appearance of IR peaks of carboxylate or nitro groups at 1380-1400 cm-1 observed in NCs and Af-CQDs, implying the oxidative-ring opening of the surface fluorophores.
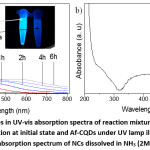
Figure 3: a) The changes in the UV-vis absorption spectra of the reaction mixture with UV illumination time. Inset in a is a solution at initial state and Af-CQDs under UV lamp illumination at 365 nm. b) UV-vis absorption spectrum of NCs dissolved in NH3 (2M) solution.
To study how CA-CQDs change upon reacting with Ag+, we measured the absorption spectrum of the mixture solution at different reaction times and the results are shown in Fig. 3a in comparison with Af-CQDs. Obviously, the characteristic absorption band at 346 nm of the surface fluorophore degraded continuously and the absorbance at long wavelengths increased. The decrease in the absorbance at 346 nm was in line with the previous conclusion from FT-IR analysis that the surface fluorophore was oxidized upon reaction with Ag+. As seen in the absorption spectrum of Af-CQDs, the absorption band of surface fluorophore at 346 nm was totally eliminated. In addition, the emission of CA-CQDs was also significantly quenched after the reaction with Ag+ as shown in the inset in Fig. 3a. The increasing absorbance seen at the long-wavelength region was due to light-scattering induced by insoluble NCs. To obtain UV-vis absorption spectra of NCs, we dissolved NCs into NH3 solution and a representative spectrum is shown in Fig. 3b. NCs solution exhibited a broad absorption, ranging from 320 nm to over 600 nm, maximized at ca. 410 nm, which is the characteristic plasmon resonance of Ag nanoparticles.4,7,8,27–29 The broadness of the plasmon peak was due to the inhomogeneity in the size distribution of Ag NPs involved in the NCs.
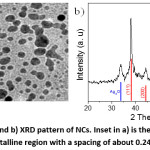
Figure 4: a) TEM image and b) XRD pattern of NCs. Inset in a) is the HR-TEM image of an NC particle showing a crystalline region with a spacing of about 0.24 nm and a grey region.
The structures of NCs were investigated by TEM and XRD as shown in Fig. 4. TEM image (Fig. 4a) showed that NCs consisted mainly semispherical particles with a diameter ranging from 4 nm to 14 nm. XRD pattern in Fig. 4b exhibited diffraction peaks at 2θ of 38.3°, 44.03°, 64.52°, 77.45°, which could be indexed respectively to (111), (200), (220), and (311) planes of fcc-structured silver metal (JCPDS no 89-3722).30 One peak at 2θ of 33.83° could be attributed to Ag2O impurity that remained unreduced after the reaction with CA-CQDs.30 The average diameter (D) of silver nanoparticles was calculated using the Debye – Scherrer’s equation: , where 0.9 is the shape factor; is the wavelength of X-ray of 1.54184Å; is the full width at half-maximum intensity in radian and is the (111) diffraction angle. The mean size of Ag NPs was about 11.9 nm, which was consistent with the TEM results mentioned above. We noted here that the diffraction of aggregated CQDs peaking at about 25o 14 was lacking in Fig. 4b, indicating the absence of pure solid phase of CQDs in the final NCs. Each composite particle consisted of an Ag NP and a CQD. As could be seen from HT-TEM image shown as inset in Fig. 4a, a crystalline region with a spacing of ca. 0.24 nm and an amorphous region are distinguishable. The spacing matched with (111) plan of Ag, implying the crystalline region was Ag NPs while the amorphous could be attributed to CQDs.
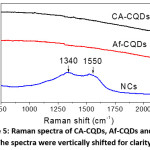
Figure 5: Raman spectra of CA-CQDs, Af-CQDs and NCs. The spectra were vertically shifted for clarity.
To confirm the existence of CQD phase in resultant NCs, we conducted Raman measurements and the Raman spectra are shown in Fig. 5. Interestingly, while CA-CQDs and Af-CQDs exhibited featureless Raman spectra, NCs showed two bands at 1340 and 1550 cm-1, which respectively are characteristic Raman shifts of D band and G band of graphitic carbon.21 The Raman peaks could be assigned to the carbogenic core of CQDs, indicating the existence of CQDs in final NCs. The reason why the Raman peaks of CQDs were absent in CA-CQDs and Af-CQDs is still unclear.14 Nevertheless, the presence of Raman peaks in the case of NCs implies that Ag NPs enhance the Raman signals of CQDs. It is reasonable because Ag NPs have been widely reported to enhance Raman scattering,1,29 especially in current NCs where Ag NP and CQD were closely connected as seen in the HR-TEM image (Fig. 4a).
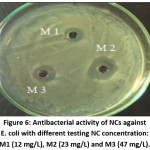
Figure 6: Antibacterial activity of NCs against E. coli with different testing NC concentration: M1 (12 mg/L), M2 (23 mg/L) and M3 (47 mg/L).
Finally, NCs showed excellent antibacterial activity against E. coli. By varying experimental conditions including NCs concentration and volume of dose, we found that with a dose of 250 μL of NCs dispersion (23 mg/L) was sufficient, as indicated by an inhibition zone of about 2.2 cm in diameter (Fig. 6).
Conclusion
The synthesis of nanocomposite consisting of Ag NPs and CQDs has been demonstrated by using CA-CQDs as a photo-reducing agent. As the reduction of Ag+ into metallic Ag NPs relied on photo-induced electron transferring from CA-CQDs to Ag+ ions, Ag NPs and CQDs were closely connected. At the same time, the formation of Ag NPs accompanied with the degradation of surface fluorophores that respond for the UV absorption band at 346 nm and highly luminescence of CA-CQDs. In addition to previously documented sensing and catalytic applications, the results demonstrated herein suggest that novel Ag NP – CQD nanocomposite could be applied to surface enhanced Raman scattering detection and antibacterial.
Funding Source
This work was funded by Vietnam Ministry of Education and Training and Hanoi Pedagogical University 2 via Project number B.2018-SP2-13.
Conflicts of interest
The authors have no conflicts of interest to disclose.
References
- S. Habouti, C.H. Solterbeck, M. Es-Souni, Synthesis of silver nano-fir-twigs and application to single molecules detection, J. Mater. Chem. 20: (2010); 5215–5219. doi:10.1039/c0jm00564a.
CrossRef
- X.Y. Dong, Z.W. Gao, K.F. Yang, W.Q. Zhang, L.W. Xu, Nanosilver as a new generation of silver catalysts in organic transformations for efficient synthesis of fine chemicals, Catal. Sci. Technol. 5: (2015); 2554–2574. doi:10.1039/c5cy00285k.
CrossRef
- G. Chen, J. Lu, C. Lam, Y. Yu, A novel green synthesis approach for polymer nanocomposites decorated with silver nanoparticles and their antibacterial activity, Analyst. 139: (2014); 5793–5799. doi:10.1039/c4an01301h.
CrossRef
- I. Sondi, B. Salopek-Sondi, Silver nanoparticles as antimicrobial agent: A case study on E. coli as a model for Gram-negative bacteria, J. Colloid Interface Sci. 275: (2004); 177–182. doi:10.1016/j.jcis.2004.02.012.
CrossRef
- L. Malassis, C.B. Murray, R. Dreyfus, R.J. Murphy, L.A. Hough, B. Donnio, One-step green synthesis of gold and silver nanoparticles with ascorbic acid and their versatile surface post-functionalization, RSC Adv. 6: (2016); 33092–33100. doi:10.1039/C6RA00194G.
CrossRef
- N.M. Zain, A.G.F. Stapley, G. Shama, Green synthesis of silver and copper nanoparticles using ascorbic acid and chitosan for antimicrobial applications, Carbohydr. Polym. 112: (2014); 195–202. doi:10.1016/j.carbpol.2014.05.081.
CrossRef
- I. Nzekwe, C. Agubata, C. Umeyor, I. Okoye, C. Ogwueleka, Synthesis of Silver Nanoparticles by Sodium Borohydride Reduction Method: Optimization of Conditions for High Anti-staphylococcal Activity, Br. J. Pharm. Res. 14: (2017); 1–9. doi:10.9734/bjpr/2016/30324.
CrossRef
- S. Chen, X. Hai, X.W. Chen, J.H. Wang, In Situ growth of silver nanoparticles on graphene quantum dots for ultrasensitive colorimetric detection of H2O2 and glucose, Anal. Chem. 86: (2014); 6689–6694. doi:10.1021/ac501497d.
CrossRef
- S. Mehtab, M.G.H. Zaidi, T. Irshad Siddiqi, Designing Fructose Stabilized Silver Nanoparticles for Mercury(II) Detection and Potential Antibacterial Agents, Mater. Sci. Res. India. 15: (2019); 241–249. doi:10.13005/msri/150305.
CrossRef
- S.K. Bhunia, A. Saha, A.R. Maity, S.C. Ray, N.R. Jana, Carbon nanoparticle-based fluorescent bioimaging probes, Sci. Rep. 3: (2013). doi:10.1038/srep01473.
CrossRef
- Y.Y. Yao, G. Gedda, W.M. Girma, C.L. Yen, Y.C. Ling, J.Y. Chang, Magnetofluorescent Carbon Dots Derived from Crab Shell for Targeted Dual-Modality Bioimaging and Drug Delivery, ACS Appl. Mater. Interfaces. 9: (2017); 13887–13899. doi:10.1021/acsami.7b01599.
CrossRef
- B. Cui, X.T. Feng, F. Zhang, Y.L. Wang, X.G. Liu, Y.Z. Yang, H.S. Jia, The use of carbon quantum dots as fluorescent materials in white LEDs, Xinxing Tan Cailiao/New Carbon Mater. 32: (2017); 385–401. doi:10.1016/S1872-5805(17)60130-6.
CrossRef
- B.Y. Yu, S.-Y. Kwak, Carbon quantum dots embedded with mesoporous hematite nanospheres as efficient visible light-active photocatalysts, J. Mater. Chem. 22: (2012); 8345. doi:10.1039/c2jm16931b.
CrossRef
- S. Zhu, Q. Meng, L. Wang, J. Zhang, Y. Song, H. Jin, K. Zhang, H. Sun, H. Wang, B. Yang, Highly photoluminescent carbon dots for multicolor patterning, sensors, and bioimaging, Angew. Chemie – Int. Ed. 52: (2013); 3953–3957. doi:10.1002/anie.201300519.
CrossRef
- L. Rao, Y. Tang, H. Lu, S. Yu, X. Ding, K. Xu, Z. Li, J. Zhang, Highly Photoluminescent and Stable N-Doped Carbon Dots as Nanoprobes for Hg2+ Detection, Nanomaterials. 8: (2018); 900. doi:10.3390/nano8110900.
CrossRef
- J.C. Jin, Z.Q. Xu, H.F. Zou, Z.Q. Zhou, Q.Q. Yang, B.B. Wang, F.L. Jiang, Y. Liu, Carbon dots reduced and stabilized silver nanoclusters: Synthesis and formation mechanisms, RSC Adv. 6: (2016); 76989–76995. doi:10.1039/c6ra14233h.
CrossRef
- M. Jahanbakhshi, B. Habibi, A novel and facile synthesis of carbon quantum dots via salep hydrothermal treatment as the silver nanoparticles support: Application to electroanalytical determination of H 2 O 2 in fetal bovine serum, Biosens. Bioelectron. 81: (2016); 143–150. doi:10.1016/j.bios.2016.02.064.
CrossRef
- J. Schneider, C.J. Reckmeier, Y. Xiong, M. Von Seckendorff, A.S. Susha, P. Kasak, A.L. Rogach, Molecular fluorescence in citric acid-based carbon dots, J. Phys. Chem. C. 121: (2017); 2014–2022. doi:10.1021/acs.jpcc.6b12519.
CrossRef
- R.C. So, J.E. Sanggo, L. Jin, J.M.A. Diaz, R.A. Guerrero, J. He, Gram-Scale Synthesis and Kinetic Study of Bright Carbon Dots from Citric Acid and Citrus japonica via a Microwave-Assisted Method, ACS Omega. 2: (2017); 5196–5208. doi:10.1021/acsomega.7b00551.
CrossRef
- Q.-B. Hoang, V.-T. Mai, D.-K. Nguyen, D.Q. Truong, X.-D. Mai, Crosslinking induced photoluminescence quenching in polyvinyl alcohol-carbon quantum dot composite, Mater. Today Chem. 12: (2019); 166–172. doi:10.1016/j.mtchem.2019.01.003.
CrossRef
- A. Sharma, T. Gadly, S. Neogy, S.K. Ghosh, M. Kumbhakar, Molecular Origin and Self-Assembly of Fluorescent Carbon Nanodots in Polar Solvents, J. Phys. Chem. Lett. 8: (2017); 1044–1052. doi:10.1021/acs.jpclett.7b00170.
CrossRef
- M. Fu, F. Ehrat, Y. Wang, K.Z. Milowska, C. Reckmeier, A.L. Rogach, J.K. Stolarczyk, A.S. Urban, J. Feldmann, Carbon Dots: A Unique Fluorescent Cocktail of Polycyclic Aromatic Hydrocarbons, Nano Lett. 15: (2015); 6030–6035. doi:10.1021/acs.nanolett.5b02215.
CrossRef
- M.X. Dung, M. Van Tuan, P.T. Long, N.T. Mai, Tuning the Emission Color of Hydrothermally Synthesized Carbon Quantum Dots by Precursor Engineering, VNU J. Sci. Nat. Sci. Technol. 35: (2019); 1–7. doi:10.25073/2588-1140/vnunst.4831.
CrossRef
- F. Ehrat, S. Bhattacharyya, J. Schneider, A. Löf, R. Wyrwich, A.L. Rogach, J.K. Stolarczyk, A.S. Urban, J. Feldmann, Tracking the Source of Carbon Dot Photoluminescence: Aromatic Domains versus Molecular Fluorophores, Nano Lett. 17: (2017); 7710–7716. doi:10.1021/acs.nanolett.7b03863.
CrossRef
- N.A. Alarfaj, M.F. El-Tohamy, H.F. Oraby, CA 19-9 pancreatic tumor marker fluorescence immunosensing detection via immobilized carbon quantum dots conjugated gold nanocomposite, Int. J. Mol. Sci. 19: (2018). doi:10.3390/ijms19041162.
CrossRef
- A. Das, V. Gude, D. Roy, T. Chatterjee, C.K. De, P.K. Mandal, On the Molecular Origin of Photoluminescence of Nonblinking Carbon Dot, J. Phys. Chem. C. 121: (2017); 9634–9641. doi:10.1021/acs.jpcc.7b02433.
CrossRef
- S. Kapoor, Preparation, Characterization, and Surface Modification of Silver Particles, Langmuir. 14: (2002); 1021–1025. doi:10.1021/la9705827.
CrossRef
- T. Das, B.K. Saikia, H.P. Dekaboruah, M. Bordoloi, D. Neog, J.J. Bora, J. Lahkar, B. Narzary, S. Roy, D. Ramaiah, Blue-fluorescent and biocompatible carbon dots derived from abundant low-quality coals, J. Photochem. Photobiol. B Biol. 195: (2019); 1–11. doi:10.1016/j.jphotobiol.2019.04.004.
CrossRef
- Y. Dong, Q. Wang, L. Wan, X. You, Y. Chi, Carbon based dot capped silver nanoparticles for efficient surface-enhanced Raman scattering, J. Mater. Chem. C. 4: (2016); 7472–7477. doi:10.1039/c6tc01943a.
CrossRef
- V.A. Litvin, R.L. Galagan, B.F. Minaev, Kinetic and mechanism formation of silver nanoparticles coated by synthetic humic substances, Colloids Surfaces A Physicochem. Eng. Asp. 414: (2012); 234–243. doi:10.1016/j.colsurfa.2012.08.036.
CrossRef

This work is licensed under a Creative Commons Attribution 4.0 International License.