R. Gopalakrishnan1 and D. Govindarajan2
1Department of Physics, SRM University, SRM Nagar - 603 203, India.
2Department of Physics, Annamalai University, Annamalai Nagar - 608 002, India.
DOI : http://dx.doi.org/10.13005/msri/070127
Article Publishing History
Article Received on : 10 Apr 2010
Article Accepted on : 19 May 2010
Article Published :
Plagiarism Check: No
Article Metrics
ABSTRACT:
The present works reports the hydration processes of Portland cement through Electron paramagnetic resonance study. Cement pastes in a Water to cement ratio (W/C) of 0.4 at different hydration time intervals have been prepared. The g-factor of Fe(III) and Mn(II) impurities at different hydration ages has been related to changes in setting time of cement. Both gFe and gMn values are reach a maximum values at final setting time of OPC paste.
KEYWORDS:
EPR; Cement paste; Hydration; g-factor
Copy the following to cite this article:
Gopalakrishnan R, Govindarajan D. Hydration Processes of Cement Paste-An EPR Study. Mat.Sci.Res.India;7(1)
|
Introduction
EPR is a non-destructive standard method which enables a quick and very sensitive measurement of paramagnetic radicals in solids and gives unambiguous information about the valence state and site symmetry. This has been successfully applied to hydration of cement paste and observes the behaviors of Fe(III), Fe(II) and Mn(II) ions. The hydration mechanism of cement paste was explained by number of author’s using Fourier Transform Spectroscopy, Scanning Electron Microscopy, Differential Thermal Analysis, g-ray Spectrometry, Dielectric and Electrical conductivity measurements.1-5 Lubomir lapcik and Zdenek simek6 measured X-range electron paramagnetic resonance spectra of dry cements and reported that the configuration of iron ions is mainly in Fe(III) oxidation state in distorted octahedral and purely tetragonal symmetry of the surrounding ligands. According to Bruckner et al.,7 reported that in addition to oxygen the internal cement components Fe(III) and Mn(III) act as oxidizing agents being reduced to Fe(II) and Mn(II) ions respectively. In the present study, the authors’ reports EPR study on cement paste hydrated with different intervals of time.
Materials and Experimental
In the present study commercial Ordinary Portland cement was used. Cement is subjected to the chemical analysis using standard procedure and found in percent as follows; CaO; 63.32, SiO2; 21.70, Al2O3; 5.40, Fe2O3; 3.40, MgO; 2.69, SO3; 2.70, MnO; 0.02, Loss on ignition; 0.79.
Cement nomenclature: C=CaO; S=SiO2; H=H2O; C3S=3CaO.SiO2 ; C2S=2CaO.SiO2; C3A=3CaO.Al2O3; C4AF=4CaO.Al2O3.Fe2O3; CH=Ca(OH)2
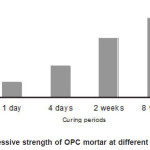
Initial setting time and final setting time has been measured on OPC paste in a water to cement ratio of 0.4 [8]. The initial setting time of cement paste is 5 hours 05 minutes and the final setting time of cement paste is 6 hours 50 minutes. Compressive strength of the cement mortar at different curing periods (1 day , 4 days, 2 weeks and 8 weeks) were determined in a water to cement ratio of 0.4 [8] and reported in Fig 1.
Figure 1: Compressive strength of OPC mortar at different curing periods
EPR measurements were made using a JEOL JES-TE 100 ESR Spectrometer at the EPR Laboratory, Pondicherry University, Puducherry. Measurements were conducted on 100mg powdered samples at room temperature with X-band frequencies, having a 100 KHz field modulation. The magnetic field is accurate to ±0.05 mT and the frequency to ±0.00005 GHz. The g-value is main key parameter in identifying paramagnetic results in a particular symmetry.
In this investigation, OPC paste was prepared in a water to cement ratio (W/C) of 0.4. The samples were thoroughly mixed using glass rod for two minutes and then allowed to hydrate in air-tight plastic containers. The hydrations were stopped at different time intervals viz., 15 minutes, 2 hours, 4 hours, 6 hours, Final set (6hours. 50 minutes), 1 day, 4 days, 2 weeks and 8 weeks by a consecutive soaking in acetone. To remove water content the hydrated pastes were oven dried at 105°C for 1 hour [9]. The samples hydrated for more than 1 day were cured properly. The dried samples were powdered using agate mortar and stored in desiccators and using for EPR study.
Results and Discussion
The EPR spectrum of anhydrous cement is shown in Fig 2(a). The spectrum of anhydrous cement showing that mainly iron ions and manganese ions. Iron and manganese ions are occurring in the state of Fe(III) and Mn(II). It has the same electronic structure of the valence electronic layer of 3d.5 The presence of an unpaired electron in the electronic structure of these elements is causing their paramagnetic properties, the configuration of iron ions is mainly in Fe(III) oxidation state in distorted octahedral and purely tetragonal symmetry of the surrounding ligands. The spin Hamiltonian parameters of g-factors values was calculated by using the formula ην = gµβB. Where h is plank’s constant, B is a vector of induction of the external magnetic field, µb is the Bohr magneton and ν is the frequency.10 The g-factor of anhydrous cement is gFe = 4.13 and gMn = 2.14. These values are good agreement with the previous literature.6 The g-factor gives us information about the paramagnetic centers of electron structure. The anhydrous cement of g-values can be proposed distorted octahedral and purely surrounding ligands around the central atom.6,11 An identical observation was reported earlier in glasses.12 According to Vladimir Vasyukov et al., 13 assume that the g-factor of Mn ≈ 2 corresponding to a center for with the low symmetry component of the crystalline field is much less than the zeeman energy and the g-factor of Fe ≈ 4 corresponds to center for which the low symmetry components of the crystalline field is much larger than the zeeman energy.
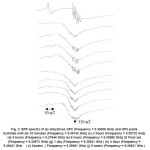
The EPR spectra of hydrated cement pastes of various hydration time intervals are shown in Fig. 2 (b-j) and the corresponding g- factor values are shown in Figs. 3 and 4.
Figure 2: EPR spectra of (a) anhydrous OPC (Frequency = 9.39638 GHz) and OPC paste hydrated with (b) 15 minutes (Frequency = 9.39743 GHz) (c) 2 hours (Frequency = 9.38732 GHz) (d) 4 hours (Frequency = 9.37644 GHz) (e) 6 hours (Frequency = 9.39565 GHz) (f) Final set (Frequency = 9.39673 GHz) (g) 1 day (Frequency = 9.39531 GHz ) (h) 4 days (Frequency =9.39431 GHz) (i) 2weeks (Frequency = 9.39661 GHz) (j) 8 weeks (Frequency = 9.39621 GHz )
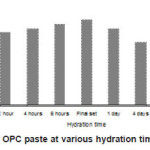
Figure 3: gFe of OPC paste at various hydration time intervals
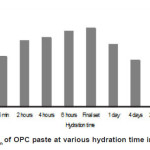
Figure 4: gMn of OPC paste at various hydration time intervals
When the cement comes in contact with water, the hydration of cement proceeds both inward and outward in the sense that the hydration products get deposited on the outer periphery and the nucleus of the an hydrated cement inside gets gradually diminished in volume. C3A and C4AF are responsible for the setting of cement. Aluminate and ferrite phases contain high amount of iron and also the miner elements soluted in the structure. Ettringite is the first hydration products in cement. Ettringite is produced through the consumption of gypsum by C4AF. When the C4AF consumption of gypsum continuous beyond a certain time point, monosulphate is produced. Monosulphate contains more Fe(III). The reaction of C3A and C4AF can be represented by the following manner:
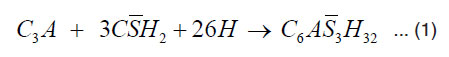
Tricalcium Gypsum Water Ettringite aluminate
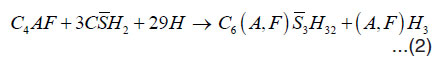
Tetra calcium Gypsum Water Ettringite Aluminoferrite aluminoferrite hydrate
All the iron-rich elements reflect strong paramagnetism. This process continues upto the Final setting of cement (6 hours: 50 minutes). In this hydrated periods of g-factors are gFe = 4.18 and gMn= 2.25. This is due to Fe(III) species gives effective g-values and a broad line distributed over the whole range of spectrum. The broad signal is attributed to magnetically ordered Fe-O-Fe species with Ferri-Ferro, or anti ferromagnetic behaviour.7 The high gFe (= 4.19) value of the OPC paste caused by Fe(III) ions in sites of strong rhombic distortion7, 11,14 The high values of the gFe factor components of the high field spectrum are caused by Fe(III) ions with small zero field splitting in a highly symmetric surrounding . They are octahedral coordinated by oxygen and located in the ferrite phase of the cement paste. After setting of cement paste, the Ca2+ concentration reaches the saturation level and the crystallization of calcium hydroxide and C-S-H gel are formed.15 The availability of ions and water is lower. C3A and C4AF reactions are dominant. Hence after the setting of cement paste the g-factor of Fe and Mn values are gradually decreased. Because Fe(III) and Mn(II) ions are responsible for the hardening of the main silicate component. It is due to mobility of particular silicate aggregate is reflected in the vigorous changes in polycrystalline quasi-isotropic character of electron paramagnetic spectra of Fe(III), Fe(III) ions to the anisotropic.7 The decreased g-factor values reflect the structural changes of Fe(III) ions to Fe(II) ions. This structural change is affected the Spin Hamiltonian parameters.12 This process continued up to 4 days of hydrated cement pastes. At 2 weeks hydration period C3S and C2S react with water to form strong hydrated mass. The reaction of C3S and C2S can be represented by the following manner16:
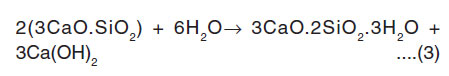
Tricalcium silicate water C-S-H Calcium hydroxide
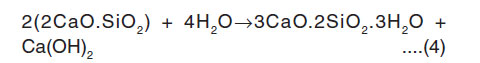
Dicalcium silicate water C-S-H Calcium hydroxide
The availability of Fe3+ ions and Mn2+ ions are reduced and hence the g-factor values are decreases for advance hydration period.
Conclusions
The following conclusions can be drawn based on the experimental study
The present work reports that the EPR study on the cement paste mixed with ground water corroborates with results obtained from the setting time and compressive strength measurements.
EPR is a good tool to detect very small concentration s of Fe(III) and Mn(II) ions present in cement.
gFe and gMn values are increased from 15 minutes and reach a maximum values at final setting time of cement and then decreased.
The high gFe (= 4.19) value of the OPC paste caused by Fe(III) ions in sites of strong rhombic distortion.
References
- Rai U. S. and Singh R. K., Mat. Sci. Eng A., 392: 42 (2005).
CrossRef
- Kjellsen K. O. and Lagerblad B., Cem. Conc. Res., 37: 13 (2007)
CrossRef
- Hidalgo A., Petit S., Domingo C., Alonso C. and Andrade C., Cem. Conc. Res., 37: 63 (2007).
CrossRef
- Eiafifi E.M., Hilal M.A., Khalifa S.M. and Aly H.F. Radiation measurements, 41: 627 (2006).
CrossRef
- Barathan S., Govindarajan D., Sivakumar G. and Raghu K. Indian J. Pure and Appl. Phys, 44: 334 (2006).
- Lubomir Lapcik, Jr. and Zdenek simek. Cem. Conc. Res., 26, 237 (1996).
CrossRef
- Bruckner A., Luck R., Wieker W., Winkler A., Andreae C. and Mehner H. Cem. Conc. Res., 22, 1161 (1992).
CrossRef
- Shetty M.S. Concrete Technology, S.Chand and Co.Ltd., New Delhi, 2004.
- Voglis N., Kakali G., Chaniotaki S. and Tsivilis S. Cem. Conc. Res., 27: 191 (2005).
CrossRef
- John Weil A., James Bolton R., John Wertz E. Electron paramagnetic resonance. Elementary theory and practical applications, John Wiley & Sons. New York, 1994.
- Sambasiva Rao P., Part 3. Spectrochimica Acta A, 52: 1127 (1996)
CrossRef
- Sands R. H., Physics Reveiw, 99: 1222 (1955)
CrossRef
- Vladimir Vasyukov N., Vladimir Shapovalov V., Steven Schwarz A., Miriam Rafailovich H., Jonathan Sokolov C., Vladimir Shapovalov A. and Viktor Beloshenko A., J. Mag. Res., 154: 15 (2002)
CrossRef
- Sambasiva Rao P. and Subramanian S. Mol. Phys., 54: 415 (1985)
CrossRef
- Neville A. M. and Brooks J. J. Concrete Technology (Addison Wesley Longman Ltd) 1987.
- Mollah M.Y. A., Yu W., Schennach R. and Cocke D. L. Cem. Conc Res, 30: 267 (2000).
CrossRef

This work is licensed under a Creative Commons Attribution 4.0 International License.