Introduction
Pitting is an extremely hazardous corrosion type. While causing relatively low metal losses, it disables large metal structures and renders inoperative expensive constructions. Thus, great effort was always under- taken to control pitting. The problem of pitting theory may be divided into three interrelated but, nevertheless, autonomous parts:
origination of pits, i.e., their nucleation;
interaction of the pits formed, their competition and ‘’struggle for life’’;
development of survived pits, i.e., the growth of the strongest. This work is devoted to the third problem. As regards the first two problems, the following should be mentioned.
The first problem, namely the mechanism of pit nucleation requires considering the local depassivation of small areas δS on the metal surface. Depending on the conditions ( for example, the activity of δS), these bare areas can either heal or begin to grow. They may be called the pit nuclei.
The second problem that concerns the interaction of pits formed remains very poorly developed. To date, none of theoretical models of interaction are sufficiently complete.
The problem of local depassivation is S considered in detail in [1]; however, it is rather cumbersome, and we restrict ourselves to several remarks.
Many authors assume that pits are formed due to random defects of the passivating oxide layer ( scratches, random micropores, etc ). However, the attribution of pitting to pores and random defect is hardly consistent with the regular and reproducible dependence of the pitting potential on the solution concentration and the very fact of the existence of this potential. The idea of static defects as the cause of pitting also contradicts the fact that the passivating oxide has no stable structure and is thermodynamically non-equilibrium. It exists dynamically by constantly renewing its ionic composition and structure.
A principally different approach to the problem of pitting was put forward by Ya. M. Kolotyrkin². He claimed that two factors are decisive during the pit nucleation. The first factor is the known presence of activating ions (Cl–, Br–, I–) in the solution, and the second factor is the energetic inhomogeneity of the surface. This inhomogeneity entails the discreteness of the properties of the whole passivating layer. It is also the reason for the discreteness of depassivation. Indeed, due to heterogeneity, the layer structure contains weak points, and the distribution of the dissolution current across the layer becomes non uniform. The energetic inhomogeneity of the surface is transmitted across the layer to the interface with electrolyte. In these ‘’weak points,’’ pits form. Other conditions being equal, the pitting initiation–potential is a determinate function of the electrolyte composition and the energetic spectrum of the surface.
Aggressive anions An− involved in the actsof transfer of actions to the electrolyte not only accelerate the metal depassivation but also make it irreversible.
This follows from the fact that pits formed at the pitting potential do not develop further in the absence of . At the pitting potential, the anions change the dissolution kinetics in such a way that it no longer corresponds to the extrapolation from the Tafel domain.
During the depasssivation of an area, a local increase in the density of dissolution current i occurs, which represents a fluctuation i of the current density relative to the whole passivated surface S. This causes a corresponding increase in metal ion M z+ concentration in the vicinity of δ S and, hence, an increase in the supplied aggressive anions, which compensate the positive charges of metal ions. The initial fluctuation of current generates a secondary fluctuation of aggressive anions, that is Cl−, Br−, I− , etc. In as much as the latter are involved in the elementary acts of the detachment of cations from the metal lattice (pit’s bottom) and stimulate the acts, the origination of δC accelerates these acts still more. Hence, an increase in the current by increases the over all concentration by δC, which in turn increases by. Thus, the dissolution becomes not only irreversible but also self-accelerating. Hence, a growing pit represents an electrochemical system with a feedback. The initial fluctuation can be expressed via by using the common equations of diffusion kinetics
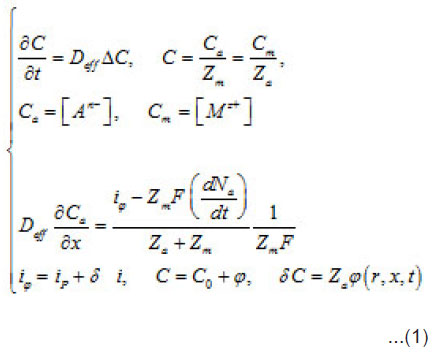
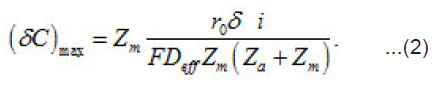
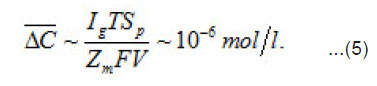
Where a C,C and m C are the normalized concentration and those of anions and metal, respectively; a N is the coverage of surface S by adsorbed anions; 0 r is the initial radius of the area δS with a center at x = 0; P i is the mean current of passive dissolution; 0 C is the concentration in the solution bulk. The solution of this problem gives the maximum value of δC ,namely
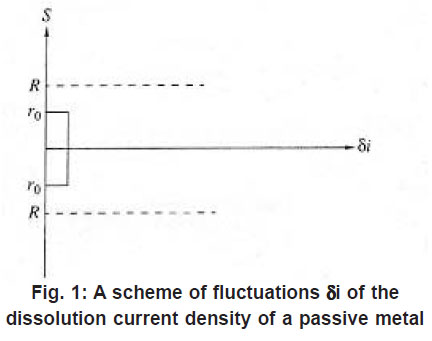
On each cm2 of the surface S, depending on its energetic spectrum and other factors, a multitude of pit nuclei arises, which divide the near–electrode layer into areas δV with mobile boundaries. These areas are the source of aggressive anions An−and water molecules necessary for the growth of pit, i.e., represent their “life spans”. For each area δS depending on the parameters i eff r, δi , z D 0 and C , a critical value cr δV sufficient for the growth of a pit exists. It is determined by the growth rate, the diffusion rates of solution components, etc. If cr δV 〈δV then pits start to interact and compete with one another, and, as a result, only the strongest of them survive. According to Fig. 1, the neighboring fluctuations of current δ i each of a radius do not interact if the radii R of the corresponding cylindrical solution volumes at least twice exceed.
Figure 1: A scheme of fluctuations δi of the dissolution current density of a passive metal
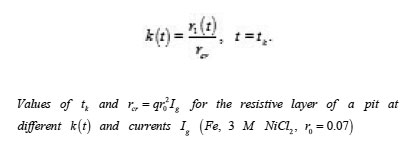
The pitting potential is determined by the expression (3) at [1]
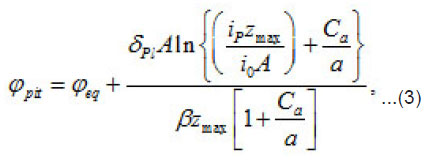
where eq ϕ is the potential of oxygen equilibrium [3], and Pl δ is the average thickness of passive layer. Thus, in each case, all other factors being equal, the potential of pit formation is a function of two parameters: the concentration of the aggressive medium a C and the heterogeneity parameter
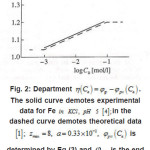
Figure 2 shows the pit a ϕ vs.C dependence for an iron electrode in KCl solution. It illustrates the agreement between the discussed theory and experimental results (in Fig. 2, the function
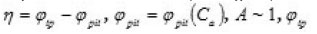
is the transpassivation potential), and
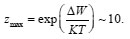
Figure 2: Department η(Ca)=φp-φpit(Ca). The solid curve demotes experimental data for Fe in KCL, PH 5 [4]; in the [1]; Zmax = 8, a = 0.33 x 10⁻² , φpit (Ca) dashed curve demotes theoretical data is determined by Eq (3) and φpit is the end potential of passive rage at Ca=0
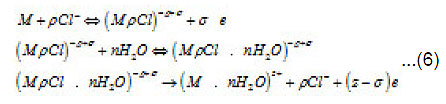
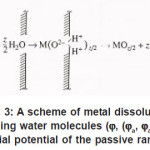
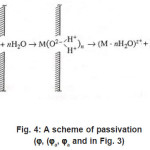
Thus, only a part of N nuclei develops into pits. The interaction between them suppresses weak pits and, concurrently, affects the activation of nucleation, which is decisively dependent on solution anions. The anions participate in elementary acts of the processes on the metal surface S Schemes of these processes are shown in Figs. 3- 5. In the range from ϕ to pit ϕ, the presence of Cl−1 ions, which strongly interact with the surface S, changes the situation shown in Fig. 4. Being locally bared, the most active areas are covered by chloride complexes, which arise via the reaction
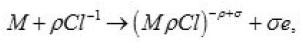
and displace water molecules.
Figure 3: A scheme of metal dissolution involving water molecules (ϕ, (ϕa, ϕa is the initial potential of the passive range)
Figure 4: A scheme of passivation (ϕ, (ϕa, ϕa and in Fig. 3)
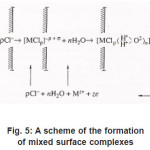
Figure 5: A scheme of the formation of mixed surface complexes
Because Cl−1 ions are weakly hydrated, the adsorption complexes ( MρCl )−ρ +σ do not leave the surface themselves. However, by interacting with water dipoles, they apparently form the bonds giving rise to mixed surface complexes of a type of (MρCl.nH2O)−ρ +σ ,which can pass to solution via the scheme of Fig. 5. According to this figure, those metal atoms pass to solution that, firstly, are bound with ρCl−1 and, secondly, interact with n oriented water molecules. When, during their dissolution, the mixed complexes rapidly dissociate, the anions are recovered and can again take part in the elementary act. The liberated M z+ ions acquire hydrate shells and are removed to the periphery.
Pit Development
The mechanism of pit growth can be understood on the basis of model experiments [4] with two groups of measurements.
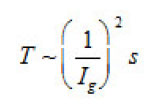
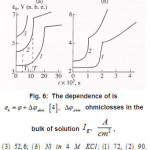
The first group represent galvanostatic measurements on Ni and Fe by a polarizing–current density Ig from 5 to100 A cm2. Acylindrical sample of a radius r ~0.1cm, in armored Teflon casing, was exposed to concentrated aqueous solution of 1− 3 M KCl and, 5 2 NiCl pH, and, upon a corresponding treatment dissolved uniformly. At Ig 〉 1A cm2 , the samples surface was cleaned and operated as a large pit. Then, the ϕ vs. t curves were measured, which are shown in figs. 6a and 6b. Each curve demonstrates two time intervals 0 ≤ t ≤ T and t〉T , which correspond to two successive stages of the pit growth mechanism. In both cases, the time of the first stage turns out to be
The second group includes potentiostatic measurements on the same samples in a 0.1M KCl
aqueous solution at potentials of 1.5 − 2 V (n.h.e). In this case, the current densities ia range from 5 to 100 A cm2. The results of both groups are well reproducible and inter-consistent.
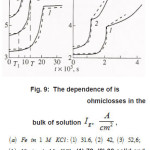
Figure 6 : The dependence of εk = φ + φohm [4], Δφohm is ohmiclosses in the bulk of solution Ig2, A/cm2, (3) 52,6; (b) Ni in 4 M KCL: (1) 72, (2) 90.
The mentioned high current densities Ig and ia determine the kinetics of pit growth. They correspond to the number of atomic layers
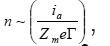
which every second pass to the solution from 1cm2 of pit’s bottom, where Zme is the charge of metal
ions and Γ ~ 105 is their number on a cm2 of the surface. Hence, it follows that n ~ 3(103 −104 ), the rate of pit deepening
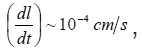
and the flow of species to the solution j ~ 3×10¹⁹ species /(cm2 s). With the mentioned orders of magnitudes, the solution properties should
substantially change in the vicinity of a pit. Thus, when
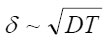
the increment of the normalized concentration ΔC at the pit’s bottom, in a layer of a thickness of
that is equal to the depth of diffusion penetration for the characteristic time of the first stage
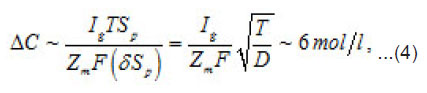
that is, the solution concentration approaches a complete salvation limit Ct, where all water molecules find themselves in hydrate shells of metals ions Mz+. Correspondingly, by the end of the first stage at t~T ,the solution at the pit’s bottom is virtually “deprived”of free water, which transfers, from the free state into the bonded one. At the same time, the average change of concentration ΔC in the whole cell volume
V ~ 1cm3 is small.
For convenience sake, the appeared layer
of “dehydrous” solution is called the resistive layer. By its structure, the resistive layer is intermediate between solutions and crystal hydrates (with high coordination numbers). Apparently, it can be represented as a combination of two ionic subsystem (sublattices): firstly, a sublattice of chloride ions and, secondly, a cationic lattice of dissolving metal. Water molecules that enter into hydrate shells, and, hence, are oriented in a certain way, are located between the opposite charges of these subsystems. Under the effect of electric field, vacancies and the ionic current arise in the positive subsystem. Ions move by successive jumps from there own hydrate shells to vacant neighboring shells. The electric field is the driving force of these relay-race transitions. When an ion is transferred, its hydrate water is freed for a while. This should prevent the possible salt crystallization in the resistive layer and the formation of salt plugs. Immediately at the pit’s bottom, this process produces a corresponding amount of free water capable of participating in the further acts of dissolution via the scheme in Fig. 5. Hence, the dissolution kinetics is limited by the liberation of hydrating water, which depends on the polarizing current or the external potential.
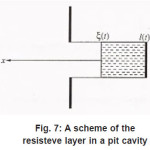
Thus, by the end of the first stage, the electrolyte solution at the pit’s bottom is “dehydrated” and the concentration of ions reaches its maximum possible value t C . However, the sample continues to dissolve, and the arising metal ions M z+ acquire hydrate shells. Hence, the processes of water binding and solution dehydration go on. The resistive layer becomes thicker and, in the general case, at sufficiently great currents Ig, can fill the whole pit’s cavity and come out to the periphery (Fig.7).
Figure 7: A scheme of the resisteve layer in a pit cavity
At the resistive-layer boundary x =ξ (t ), the flow of metal ions M z+ splits into tow. The first part consists of ions going to solution and thesecond builds up the layer. That’s why, at the observed currents Ig, the boundary ξ (t ) moves, approaching the mouth of the pit. In doing so, the solution near the boundary ξ (t ) is apparently dehydrated, and the motion of ions to solution is impeded due to their low mobility and, probably the exhanced interaction of incompletely hydrated ions. We can assume that, at the boundary , the free and bound water molecules form opposite flows, and, at sufficiently high currents, the boundaryreaches the pit’s mouth.
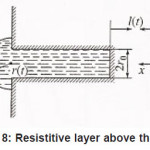
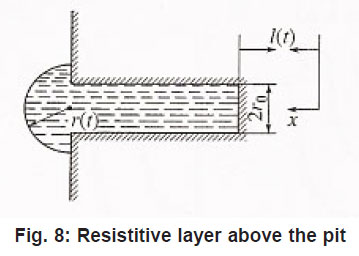
Then, in the general case, the resistive layer comes out of the pit’s cavity and begins to develop into a hemisphere (Fig. 8). Its radius constantly grows, and the situation changes, because the initial flow of metal ions from the pit’s bottom through the resistive layer now comes to the growing hemispherical surface Σ = 2π r 2 (t ), i.e., the current density of ions decreases and the water deficiency disappears . the pit is stable now.
Figure 8: Resistitive layer above the pit
Thus, in its development, a pit passes three stages: (1) the solution at the pits bottom is ‘’dehydrated’’; (2) the pits cavity is the filled with the resistive layer and the latter comes out to the periphery; (3) the pit becomes stable.
At the first stage, the kinetics of processes occurring at the pit bottom, which are shown by a scheme in fig .5 , is of prime importance
At this stage, due to their strong (at the pitting potential) interaction with the metal surface pit S, the activating anions force out water molecules so that the latter can no longer play the role of a passivator according to Fig. 4. The surface S is occupied by adsorption complexes. However, Cl − ions are not hydrated, and the formation of complexes ( MρCl )−ρ +σ is yet insufficient for the metal to dissolve. For this to happen, the second stage of (6), which results in the formation of a resistive layer, is essential. As this layer is formed and the solution is dehydrated, the kinetics of dissolution (6) becomes directly related to the current i . As was noted above, the foregoing factors suppress the dissolution, because the function of free water is now performed solely by water molecules of interfacial hydrate shells in as much as the latter remain unoccupied.
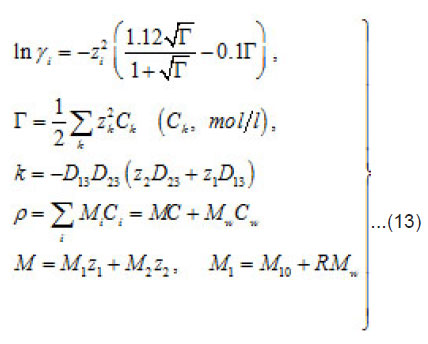
The mechanisms of the elementary act and ionic conduction, as well as the ohmic losses in the near electrode layer, change correspondingly. This is reflected in the break in ϕ − t curves of Fig. 6. The solution density ρ, which is determined by the concentration C of all components, also changes
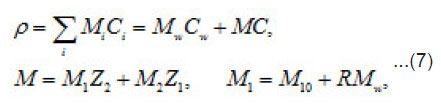
Where 1 2 M ,M ,and w M , are the masses of the metal, the counterion, and water; w C is the water concentration; R is the hydration number of ions Mz+ . The quantity ρ varies from to in a completely dehydrated solution (for 2 FeCl and 2 NiCl , it is found that Ct~ 5.85 t , and pt~ 2 g/cm2 ). The mass distribution along the pit axis gives rise to the convection at a rate v . Therefore, the full flow of each component is combined of diffusion, migration, and convection components.
Equations [1] that describe the growth of a pit pertain to the Onsager general theory of transport processes in concentrated solution, where the concentrations of ionic components are commensurable with that of solvent. Hence, one must not consider them independently, neither assume that the motion of ionic components does not affect the equilibrium states of the solvent. Actually, the latter is involved in the transport processes. This theory is known as a hydrodynamic view on diffusion. Onsager equations used in this work determine the mean statistical rates of species of the component, which are involved in
the expressions the density Ii of the full mass flow
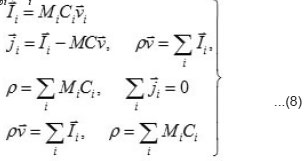
Where

are the molar mass, concentration, and diffusion flow of the component, respectively; this automatically means that

The mean statistical rates are related to the gradients of chemical potentials of an m-component mixture by the Onsager equation
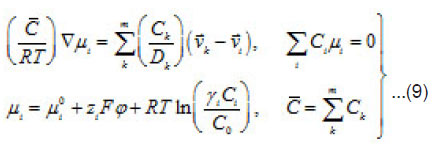
Where Dik are the diffusivities in the corresponding binary mixtures, which are related to Onsager coefficients. From this expression, at small concentrations, i.e., in a linear approximation, we can obtain usual expressions for the current density, which involve diffusion, migration, and convection components. From (9), the explicit equations for mass flows

follow
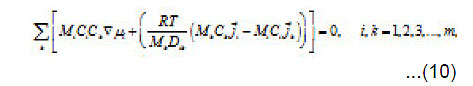
and
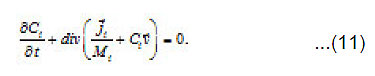
From Eqs (10) and (11), one can determine the sought concentrations Cw of solution components in the pit and also their flows

and [1] as the functions of and other parameters. More over, due to the presence of the factors, k, i γ,and ρ specified below, the expressions (8)-(10) take into account the effects of ionic interaction, electrical field, and changes in the solvent concentration
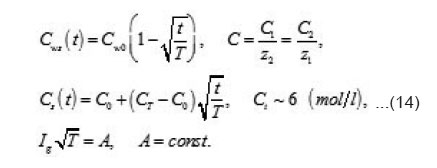
The normalized concentration of ionic components and solvent at the pits bottom are as follows [1] :
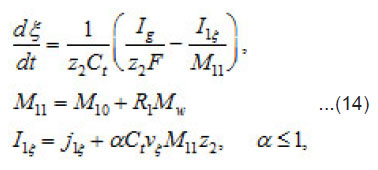
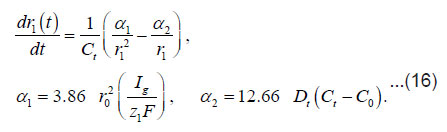
By using the shown expressions, one can calculate ϕ vs.t curves in a galvanostatic mode and the dependence of the first stage time T on the galvanostatic current g I (Figs. 9-11). Below, the formulas for the resistive layer in the pit are shown. The equations [1] for the movement of its boundary ξ (t ) are as follows:
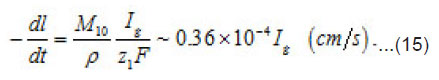
Where I1ξ is the flow of cations that depart from the resistive layer to solution. The equation for the shift of the pits bottom l(t), i. e. its deepening is as follows:
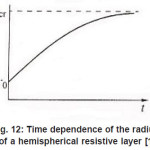
As was mentioned above, for sufficiently great currents Ig the resistive layer fills the pits cavity and, having come out to the periphery, develops into a hemisphere.Therefore, the former current πr02 Ig of metal ions is fed to the growing hemispherical interface 2πr12(t). Consequently, the current is dissipated, and the pit is stabilized. The equation describing the shift of this surface [1] is as follows (Fig .12 ):
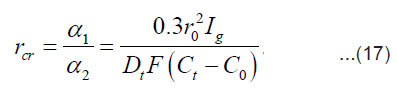
A stable (maximum) value of the radius rcr is
By integrating Eq. (16) for and taking intoaccount Eq. (17), we obtain for

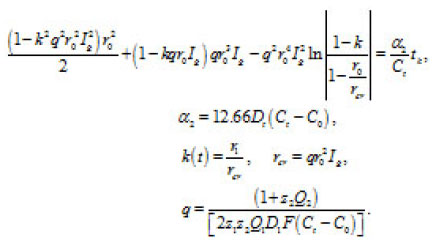
Figure 9: The dependence of εk = φ + φohm [4], Δφohm is ohmiclosses in the bulk of solution Ig2, A/cm2, (3) 52,6; (b) Ni in 4 M KCL: (1) 72, (2) 90 solid and dashed curves represent experimental [4], and calculated [1] data, respective ly
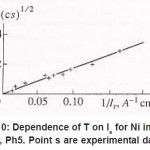
Figure 10: Dependence of T on Is for Ni in a 3MNICl2, Ph5. Point s are experimental data (4)
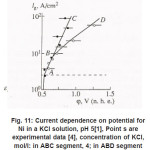
Figure 11: Current dependence on potential for Ni in a KCl solution, pH 5[1], Point s are experimental data [4], concentration of KCl,mol/l: in ABC segment, 4; in ABD segment
Figure 12: Time dependence of the radius of a hemispherical resistive layer [1]
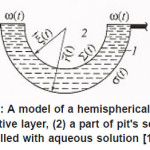
Figure 13: A model of a hemispherical pit: (1) resistive layer, (2) a part of pit’s scavity filled with aqueous solution [1],
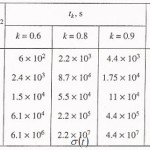
Table 1
The table shows a numerical dependence of the value on and estimates the time of pit stabilization;
The problem of a hemispherical pit (Fig. 13) also deserves attention. In this case, the distribution of the potential ϕ in the resistive layer is determined by the Laplace equation
These expressions represent a principle formulation of the problem of the dissolution of bottom surface σ(t) of a pit. They correlate the kinetics of this process and the shape of the pit. This problem is considered in [1].
References
- Popov, Yu.A., Teoriya vzaimodeistviya metallov I splavov s korrozionno-aktivnoi sredoi (The Theory of Interaction of Metals and Alloy with Corrosive Medium), Moscow: Nauka, 106-109 (1995).
- Kolotyrkin, Ya.M., Usp. Khim., 31(2): 322 (1962).
- Vetter, K., Elektrochemische Kinetik, Berlin: Springer-Verlag, 1961. Translated under the title Elektrokhimicheskaya kinetika, Moscow:Khimiya (1967).
- Strehblow, H. and Wenners, J., Z. Phys.Chem. (Munich), 98: 199 (1975).
CrossRef

This work is licensed under a Creative Commons Attribution 4.0 International License.

