Solvents Effect of Quantum Sized Sno2 Nanoparticles Via Solvothermal Process and Optical Properties
Department of physics, Presidency College, Chennai - 600 005, India.
Corresponding Author E-mail: anandphy@yahoo.in
DOI : http://dx.doi.org/10.13005/msri/070208
Download this article as:
![]()
Well-dispersed quantum sized SnO2 nanoparticles have been successfully synthesized by simple solvothermal process using ethylenediamine as both a coordination and an alkali reagent. The size of the prepared tin oxide nanoparticle has been characterized by X-ray powder diffraction (XRD) and transmission electron microscopy (TEM) analysis. The TEM images show nano-particles as clusters with size in the range of 2.27–3.35 nm. Morphological studies were obtained by scanning electron microscopy (SEM). The optical direct band gap values of SnO2 nanoparticles were calculated to be about 3.75–4.27eV, which were confirmed the quantum size effect. The photoluminescence (PL) properties and the possible mechanisms were also discussed.
KEYWORDS:Semiconductors; SnO2; Nanoparticles; Solvents; Solvothermal process
Introduction
Synthesis of nanomaterials by various routes has been developed to control the size of grains in these materials in the range of quantum size. These materials show interesting properties compared to their bulk counterparts. Tin oxide (SnO2) is an important n-type semiconductor with wide band gap (3.6 eV)1 and one of the most widely used semiconductor oxides due to its chemical and mechanical stabilities and investigated for transistors, electrode materials2 and solar cells. Among the various applications, the most important use of SnO2 is of gas sensors. The sensing properties of SnO2 sensors (sensitivity, selectivity and reproducibility) depend on several factors, mainly crystallite size. Especially, as the diameter of the SnO2 is small or comparable to its excite Bohr radius (2.7nm) that excitons and carriers are confined in all three dimensions to a nanometer size region, unique properties such as blue shift of the band edge transition energy, unusual structural and optical properties takes place.3,4 Consequently, the use of nanoparticles will allow obtaining better responses of these solid-state gas sensors.5 Many methods have been developed to synthesize SnO2 nanocrystallites, compared with other methods; the solvothermal approach is a better alternative with the advantages of mild synthetic conditions, simple manipulation and low pollution. Ethylenediamine was usually used as the structure direction agents for the synthesis of 1D nanomaterial in the solvothermal process due to its strong chelating ability with metal ions, and numerous semiconductors with several of morphologies were synthesized by using ethylenediamine as solvent.6-8 The process, ethylenediamine acted as a template molecule, which was incorporated into the inorganic framework first and then escaped from it to form nanocrystallites with desired morphologies.6
In this present work, quantum sized SnO2 nanoparticles were synthesized using ethylenediamine as both an alkali and ligand to coordinate with Sn ions by a solvothermal process. The phase, purity, size, morphological and optical properties of the as-synthesized quantum sized SnO2 nanoparticles were investigated. Furthermore, the possible mechanism for the formation of the SnO2 nanoparticles was discussed.
Material and Methods
All chemical reagents were commercial with AR purity, and used directly without further purification. The synthesis process of SnO2 nanoparticles was done by only two steps method. Firstly 1.06g SnCl4.5H2O was dissolved in 60 ml solvent (methanol: sample 1, butanol: sample 2, mixture of water and methanol: sample 3, mixture of water and butanol: sample 4), while stirring vigorously, 0.8ml of ethylenediamine (C2H8N2) was slowly dropped into the above solution, slurry-like white precipitates were formed. After stirring few minutes, the solution was poured into Teflon-lined stainless steel autoclave and kept at 190°C for 24hrs. Then the autoclave was cooled to room temperature naturally; the resulting brownish precipitates were collected and washed with distilled water and absolute ethanol for several times to remove the impurities. Secondly the collected product was dried at 60 °C for 5h in vacuum.
Seifert JSO DEBYEFLEX 2002 diffractometer using Cu-Ka radiation source, Hitachi S-4500 scanning electron microscope (accompanied by energy dispersive X-ray analysis (EDAX) attachment for the compositional analysis) and JEOL-3010 transmission electron microscope were used to characterize the structure, morphology and size of the samples. Optical absorption spectra of the powdered samples were recorded in a Varian Cary 5E UV–vis spectrometer. The photolu-minescence (PL) measurements were carried out with a Fluoromax-4 Spectrofluorometer.
Result and Discussion
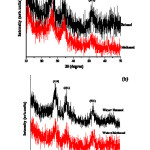
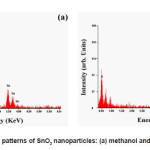
The details XRD patterns of the SnO2 nanoparticles are shown in Fig. 1 (a) and (b). All the samples present diffraction peaks at around 27, 34 and 52°C are assigned to tetragonal structure of SnO2 planes (110), (101) and (211) (JCPDS No.41-1445), respectively. The broadened diffraction peaks attributed to the too small size of particles in the samples. Moreover, no diffraction peaks due to impurities discerned; the facts indicate that the level of impurity in the samples is low. The average crystalline sizes of the as-synthesized SnO2 nanoparticles were calculated by using Scherer’s equation:
![]()
where, l is X-ray wavelength (0.15418nm for Cu-Ka), b is the full width at half maximum of the diffraction peak (FWHM) and q is Bragg’s diffraction angle. The average crystalline sizes of the samples (sample 1: 2.27, sample 2: 3.28, sample 3: 3.06 and sample 4: 3.35). In the XRD pattern, the particles diameter drastically decreased when solvent was used as pure alcohol, compared with their corresponding water mixture solvents.
Figure 1: XRD patterns of the products (a) methanol, butanol; (b) mixture of water and methanol, mixture of water and butanol
 Click on image to enlarge |
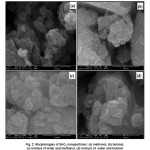
Fig. 2 (a–d) represents the SEM images of SnO2 nanoparticles synthesized by used methanol, butanol, mixture of water and methanol, mixture of water and butanol as solvents. An agglomeration of particles was observed in most of the cases. The shape of the agglomerated particles of the samples (1–4) looked like the florets of cauliflower. Agglomeration effect was very prominent in aqueous media as compared to organic solvents because organic solvents have better dispersing ability.9 The particles size estimated for the samples 3 and 4 were approximately ~3.06 and ~3.35 nm. The lower particles size of ~2.27 and ~3.28 nm were obtained for samples 1 and 2, respectively. The lower particle size and morphology reveal the key role of individual solvents in controlling the nucleation and crystal orientation.9
Figure 2: Morphologies of SnO2 nanoparticles: (a) methanol, (b) butanol, (c) mixture of water and methanol, (d) mixture of water and butanol
 Click on image to enlarge |
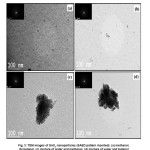
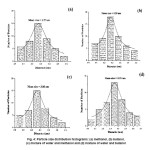
Size and morphology information of the samples were further investigated by TEM analysis. The typical TEM images (SAED pattern inserted) depicted in Fig. 3 (a–d) and corresponding particles size distribution of the samples shows in Fig.4 (a-d). TEM images show well-dispersed spherical shape of morphologies in pure alcohol-mediated SnO2 nanoparticles. The agglomerated effects of spherical-like morphologies were observed in water-mediated SnO2 nanoparticles. The nanoparticles sizes were estimated from TEM analysis as 2.27, 3.28, 3.06 and 3.35 for samples 1, 2, 3 and 4 respectively. The results obtained are in good agreement with the size estimated by using XRD and SEM analysis. The SAED pattern rings revealed that the obtained SnO2 nanoparticles are highly crystalline in nature. The EDAX spectra of the SnO2 nanoparticles for samples 1 and 2 shown in Fig. 5(a) and 5(b) revealed that the presence of Sn and O as the only elementary species in the samples, samples 3 and 4 also showed Sn and O as the only elementary species (spectra not shown). Moreover, no additional peaks corresponding to any other elements except Sn and O were observed.
Figure 3: TEM images of SnO2 nanoparticles (SAED pattern inserted): (a) methanol, (b) butanol, (c) mixture of water and methanol, (d) mixture of water and butanol
 Click on image to enlarge |
Figure 4: Particle size distribution histograms: (a) methanol, (b) butanol, (c) mixture of water and methanol and (d) mixture of water and butanol
 Click on image to enlarge |
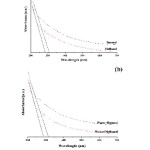
UV–visible absorption spectra were carried out in order to characterize the optical absorbance of the SnO2 nanoparticles. The quantum size effect is most pronounced for semiconductor nanoparticles, where the band gap increases with decreasing size, resulting in the inter-band transition shifting to higher frequencies. When the size of SnO2 nanocrystallites is smaller or comparable to the exciton Bohr radius (2.7nm), the quantum confinement effect would occur and a blue shift in energy is observed. The absorption edges of the samples 1 and 2 are at 285 and 306nm and also samples 3 and 4 observed at 290 and 315nm as shown in Fig. 6 (a) and (b). Their corresponding band gap energies are 4.35 and 4.05eV for sample 1 and 2 and samples 3 and 4 are 4.27 and 3.93eV, which were larger than the value of 3.6eV for the bulk SnO2.10 It was very clear that the absorption edges shifted in higher energy region as the particles size reduces. The increasing trends of the band gap energy upon the decreasing particle size are well presented for the quantum confinement effect.
Figure 5: EDAX patterns of SnO2 nanoparticles: (a) methanol and (b) butanol
 Click on image to enlarge |
Figure 6: UV-vis absorption spectra of SnO2 nanoparticles (a) methanol, butanol; (b) mixture of water and methanol, mixture of water and butanol
 Click on image to enlarge |
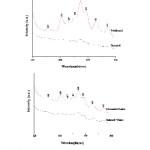
Fig. 7 (a) and (b) shows the photoluminescence spectra of the as-synthesized SnO2 nanoparticles. Generally, in poly- and nanocrystalline oxides, oxygen vacancies are known to be the most common defects and usually act as radiative centers in luminescence processes. The oxygen vacancies mostly present in three charge states of Voo, Vo+ and Vo++.11,12 As the Voo is a much shallow donor, it is believed that most oxygen vacancies will be in their paramagnetic Vo+ state under flat-band conditions. There are two strong, three weak and three shoulder emission peaks in the visible region. Particularly, the peak position at 468nm is sharp and unchanged for all samples, can be assigned to oxygen-related defects introduced during solvothermal growth. The interactions between oxygen vacancies and interfacial tin vacancies lead to the formations of a significant number of trapped states, which form a series of matastable energy levels within the band gap and result in emission in the visible region. In our study, the emission peak around 450nm revealed that the Vo++ centre in all the samples. The recombination of surface trapped hole with an electron in deep trap
Figure 7: Photoluminescence spectra of SnO2 nanoparticles (a) methanol, butanol; (b) mixture of water and methanol, mixture of water and butanol
 Click on image to enlarge |
(Vo+) to form a Vo++ center gives rise to visible emission when a conduction band electron recombines with the Vo++ center. As we know that oxygen vacancies usually act as radiative centers in the luminescence process.13 According to the analysis of the EDAX pattern, there are oxygen vacancies in the surface of the as-synthesized SnO2 nanoparticles, so we speculate that these observed peaks might associate with the oxygen vacancies.14
It is well known that ethylenediamine is both a strong coordination that can coordinate with Sn4+ and a strong alkali reagent. The mechanism for the formation of the SnO2 nanoparticles would be meaningful to provide the methodology to synthesis novel nanomaterials. To investigate the mechanism for the formation of SnO2 nanoparticles, the effect of solvents upon the structure and composite of the products were studied. Fig. 1(a) and (b) show the XRD pattern of samples, the particles diameter drastically decreased when solvent was used as pure alcohol, compared with their corresponding water mixture solvents which were conformed by SEM and TEM analysis. The Fig. 6 (a) and (b) clearly show the decreasing particles size upon the increasing of band gap energy, it confirms the quantum effect. From the above results, the possible mechanism for formation of quantum-size SnO2 nanoparticles during the solvothermal process was as followed: as the ethylenediamine was added into the precursor solutions, the complex of Snn(ethylenediamine)m4+were formed immediately and white slurry was observed. Mean while, –OH groups were released. During the solvothermal process, the complex of Snn(ethylenediamine)m–x(OH)x(4–x)+ were dissociated and SnO2 nanoparticles formed gradually. It was thought that the formation of Snn(ethylenediamine)m4+ complex decreased the reactivity between Sn ion and –OH group and resulted in the formation of quantum size SnO2 nanoparticles. It was supposed that the formation of complexes between Sn4+ and ethylenediamine decreased the releasing rate of Sn4+ and induced the formation of quantum size SnO2 nanoparticles.
Conclusion
In summery, quantum sized SnO2 nanoparticles were synthesized by solvothermal process using ethylenediamine as both a coordination and an alkali reagent. The particle sizes of the SnO2 nanoparticles synthesized from methanol, butanol, mixture of water and methanol and mixture of water and butanol were calculated to be 2.27, 3.28, 3.06 and 3.35nm, respectively, these sizes were confirmed by both XRD and TEM results. Florets of cauliflower like morphologies were observed by SEM images. Moreover, obvious quantum size effect on the SnO2 nanoparticles was observed from the UV-vis spectra. The photoluminescence (PL) properties and the possible mechanisms were also discussed. This work would be meaningful to provide a methodology to synthesize quantum size nanomaterials. The present crystallinity of the quantum sized SnO2 product ensures the feasibility of the applications of gas sensor, solar cell and optoelectronic devices.
Acknowledgements
The author is grateful to the University of Grant Commission for extending financial assistance to carry out this work.
References
- Rockenberger J., Felde U., Tischer M., Troger L., Haase M. and Weller H., J. Chem. Phys., 112: 4296 (2000).
- Zhu J., Lu Z., Aruna S.T., Aurbach D. and Gedanken A., Chem. Mater., 12: 2557 (2000).
- Ahn H.J., Chio H.C., Park K.W., Kim S.B. and Sung Y.E., J. Phys. Chem. B., 108: 9815 (2004).
- Lee E.J.H., Ribeiro C., Ciraldi T.R., Leite E.R and Varela J.A., Appl. Phys. Lett., 84: 1745 (2004).
- Baik N.S., Sakai G., Miura N. and Yamazoe N., J. Am. Ceram. Soc., 83: 2983 (2000).
- Deng Z.X., Wang C., Sun X.M. and Li Y.D., Inorg. Chem., 41: 869 (2002).
- Li Y.D., Liao H.W., Ding Y., Fan Y., Zhang Y. and Qian Y.T., Inorg. Chem., 38: 1382 (1999).
- Li Y.D., Liao H.W., Ding Y., Qian Y.T., Yang L. and Zhou G.E., Chem. Mater., 10: 2301 (1998).
- Kwon Y.J., Kim K.H., Lim C.S. and Shim K.B., J. Ceram. Pro. Res., 3: 146 (2002).
- Aoki A. and Sasakura H., J. Appl. Phys., 9: 582 (1970).
- Das S., Kar S. and Chaudhuri S., J. Appl. Phys., 99: 114303 (2006).
- Vanheusden K., Warren W.L., Seager C.H., Tallant D.R., Voigt J.A. and Gnade B.E., J. Appl. Phys., 79: 7983 (1996).
- Cai D., Su Y., Chen Y.Q., Jiang J., He Z.Y. and Chen L., Mater. Lett., 59: 1984 (2005).
- Huang Z. and Chai C., Mater. Lett., 61: 5113 (2007).
Accepted on: 19 Jul 2010


![]()
![]()
![]()