A Preliminary Discussion of the Polynomial Fits to the Thermal Curves of Solid-Solid Reactions, Carried Out in Bulk
Rabia Ahmad and Qamer Faisal
Department of Chemistry, Jamia Millia Islamia, Jamia Nagar, New Delhi - 110 025, India.
DOI : http://dx.doi.org/10.13005/msri/080115
Article Publishing History
Article Received on : 01 May 2011
Article Accepted on : 09 Jun 2011
Article Published :
Plagiarism Check: No
Article Metrics
ABSTRACT:
Dozens of authors have obtained experimental thermal curves of solid-solid reactions, carried out in bulk. Different mathematical functions were used to obtain fits to the thermal curve data. Polynomials were found to give the best fits to the data. The data may be divided into three types on the basis of the shape of the curves, with one peak, with two peaks and with three peaks. In this preliminary report we present one fitted curve of each of the three types as specimen. The importance of the Thermal Curves is briefly pointed out. A detailed discussion of the large amount of the available data may be taken up later.
KEYWORDS:
Solid-solid reaction; Thermal Curve; Polynomial fits; Heat of reaction
Copy the following to cite this article:
Ahmad R, Faisal Q. A Preliminary Discussion of the Polynomial Fits to the Thermal Curves of Solid-Solid Reactions, Carried Out in Bulk. Mat.Sci.Res.India;8(1)
|
Copy the following to cite this URL:
Ahmad R, Faisal Q. A Preliminary Discussion of the Polynomial Fits to the Thermal Curves of Solid-Solid Reactions, Carried Out in Bulk. Mat.Sci.Res.India;8(1). Available from: http://www.materialsciencejournal.org/?p=2507
|
Introduction
A large number of authors e.g.1-9 have obtained experimental thermal curves of solid-solid reactions, carried out in bulk. The thermal curve for any solid-solid system is obtained by taking the chemicals of high purity, after separately grounding them well, in the desired ratio, in a test tube (2 cm inner diameter and 15cm length). The tube is immediately placed in a Dewar flask and a sensor stick and a stop watch started at the time of mixing. The readings of temperature are recorded at every 30 second interval of time, by the digital electronic thermometer, with accuracy of 0.01°C. The temperature readings for a system are taken for one hour. To ensure that the room temperature is constant measurements are done in AC chamber. We plot the graph of temperature rise (in degree Celsius) vs. time (in minutes). Clearly, all those studies are carried out at the room temperature. We have also done the thermal measurements after mixing different inorganic solid, organic solid as well as organic solvent impurities to the pure reactants. We have obtained the thermal curves. We have fitted all these data to different Mathematical Functions. The Mathematical Functions used for fitting the thermal curves are as follows 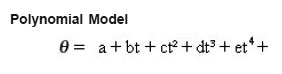
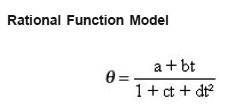
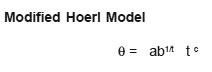

where q is the temperature rise, t is the time, a,b,c,d, e are coefficients.
The best fits are obtained using the Polynomials. We present one fitted curve for three types i.e. thermal curve with one peak, with two peaks and with three peaks. All these data are for pure reactants. The Heat of Reaction can be calculated from the Area of the Thermal Curve. Probably more meaningful results can be obtained with thermal curves having a single peak. Then after adding the impurity the shift in the peak can be obtained. We have studied the change in the area with the impurity mixed with the pure reactants. These results are not being reported here. From the fits that we have obtained we have chosen one case from each type. We shall report the discussion of the Thermal curve for all the pure reactants we have obtained, at some other place. Also the effect of the impurities on the thermal curve will be reported elsewhere. Here we have reported briefly the fitting to each type of curve.
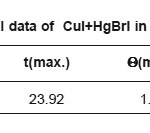
Table 1a: Thermal data of CuI+HgBrI in (3:1)molar ratio
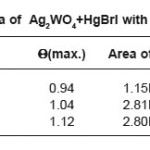
Table 1b: Thermal data of Ag2WO4+HgBrI with different molar ratios
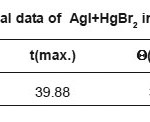
Table 1c: Thermal data of AgI+HgBr2 in (1:1)molar ratio
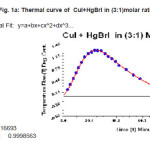
Figure 1a: Thermal curve of CuI+HgBrI in (3:1)molar ratio.
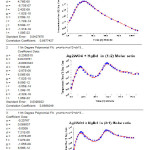
Figure 1b: Thermal curve of Ag2WO4+HgBrI with different molar ratios
Figure 1c: Thermal curve of AgI+HgBr2 in (1:1)molar ratio.
A Typical Fit for the Three Different Types of the Curves
In Table 1 (a) we give the data for a typical case of the one-peak curve, in Table 1(b) we give the corresponding data for a typical case of the two peak curve and Table 1(c ) gives the data for a typical 3 peak curve. All these are fitted very well by a polynomial. It is found that whereas the one peak curve is fitted by a 10-degree polynomial, the cases of more than one peak require a polynomial of a higher degree. The fits to the curves are shown in Figs 1(a), 1(b),and 1 (c) respectively.
Whereas the earlier authors used the thermal curve data for getting some idea of the number of steps in the reaction, it may also be used for finding out the heat of the solid-solid reaction. The situation is perhaps simpler for the one peak case. The polynomial fit of the thermal curve gives a simple analytical expression for the area under the thermal curve. This eliminates the need for numerical computation of the area. There are also other advantages in getting an analytical equation for the thermal curve.
A detailed study of the thermal curves and their fits along with the uses to which these may be put shall be presented some time later.
Acknowledgements
We wish to express our thanks to Prof. M.Z.R. Khan, Retd. Professor AMU, Aligarh for several discussions. We would also like to thank Mr. Sapan Jain, Assistant Professor, J.M.I., New Delhi for help in the computational work. Special thanks are due to the Ex-Head of the Department, Prof. Kishwar Saleem for extending to us the facilities of the Department. We are also thankful to Prof. Sharif Ahmad, Head Department of Chemistry, JMI, New Delhi.
References
- Beg, M.A. and Ansari, S.M., J. Solid State Chem., 20: 103 (1977).
CrossRef
- Beg, M.A. and Ansari, S.M., J. Solid State Chem., 23: 409 (1978).
CrossRef
- Beg, M.A. and Ahmad, A., Bull. Chem. Soc. Jpn., 55: 297 (1982)
CrossRef
- Beg, M.A. and Ahmad, A., Bull, Chem. Soc. Jpn, 55: 3607 (1982).
CrossRef
- Beg, M.A. and Saud, R., Indian J. Chem, 25A: 373 (1986).
- Beg, M.A. and Ahmad, A. and Askari, H., J. Solid State Chem., 67: 3717 (1987).
- Rafiuddin and Beg, M.A. , J. Solid State Chem., 75: 7 (1988).
- Rafiuddin , Beg, M.A. and Ahmad, A., J. Solid State Chem., 80: 94 (1989).
CrossRef
- Beg, M.A. and Jain, A., Polyhedron, 11(21): 2775 (1992).
CrossRef

This work is licensed under a Creative Commons Attribution 4.0 International License.