Activation Energy from Thermogravimetric Analysis of Certain Azopolyamides
Research and Post–Graduate Department of Chemistry, Pachaiyappa's College, Chennai - 600 030, India.
DOI : http://dx.doi.org/10.13005/msri/080127
Download this article as:
![]()
Six new azopolyamides were synthesized from 2, 21–dimethoxy 4, 41–diaminoazobenzene [Benzenamine–(3, 31– dimethoxy–4, 41-azo) bis] condensed with any one of the following diacid chlorides viz. (i) terephthaloyl chloride. (ii) isophthaloyl chloride. (iii) 4, 41–azodibenzoyl chloride (iv) 3, 31-azo dibenzoyl chloride (v) 4, 41–stilbene dicarbonyl chloride and (vi) 4, 41–oxydibenzoyl chloride using low temperature solution method. These polyamides were characterized by thermogravimetric analyses (TGA and DTA). Activation energy has been calculated using Murray and white, coats and Redfern, Doyle's, Freeman and Carroll, Ozawa–Flyn–Waal's and modified Coats and Redfern's method.
KEYWORDS:X-ray diffraction studies were carried out to study crystralline properties of the polyamides
Introduction
The kinetics of thermal decomposition reactions of carbonaceous materials is complex as the process involves a large number of reactions in parallel and in series. Although TGA provides general information on the overall reaction kinetics rather than individual reactions, it could be used as a tool for providing comparison of kinetic data of various reaction parameters such as temperature and heating rate.
During thermal degradation, the molecules orient themselves in a closed packed system so that activation energy plays an important role in disrupting the nature of the bonds. The main step in these processes is the thermal degradation through mass and energy transport which determines the rate of formation of various types of products from polyamides.
Arrherius integral function does not havean exact analytical solution since the integral method produces on unwilling increases of the noise. Therefore, several approximation methods have been proposed in literature, mainly Ozawa-Flyn-Waal’s1,2 and modified Coats and Redfern’s3 methods. The other methods are (i) Kissinger-Akahira-Sunose (KAS)4 (ii) Criado5 and (iii) Van-Krevelen6 methods. Therefore, study of degradation kinetics of polyamide is important.
Experimental
The pyrolysis process may be represented by the following reaction scheme:
A (solid)→B (solid) + C (volatile)
The rate of conversion
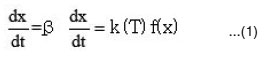
where
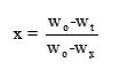
since Wo = weight at the beginning; Wx = weight loss at the end;
k(T) = function of temperature; f (x) = function of conversion .
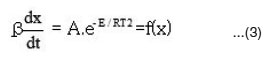
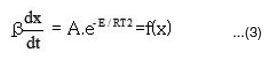
Arrhenins equation is:
![]()
where R = gas constant; A = pre exponential factor
By combining equation (1) and (2), we get
Murray and White’s method 7
Plot of ln (ln (1-c)) – 2 ln T vs 1 / T
Doyle’s Method8
Plot of log
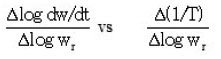
Freeman and Carroll’s method9
Plot of
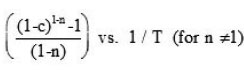
Coats and Redfern’s method2
Plot of log
Flynn – Wall – Ozawa Method
This method is derived from integral isoconversional method. Using Doyle’s approximation for the integral equation can be simplified as
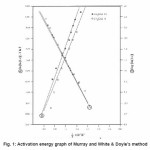
Thus, for α = const., the plot ln β vs. 1 / T, obtained from thermograms recorded at several heating rates, should be a straight line whose slope can be used to evaluate activation energy. The results were presented in Tables 1 and 2 and graphical lines were shown in Figures 1 and 2.
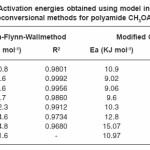
Table 1: Activation energies obtained using model independent or Isoconversional methods for polyamide CH3OAZ – ST
 Click on image to enlarge |
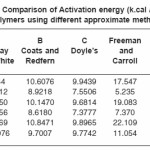
Table 2: Comparison of Activation energy (k.cal / mole) of polymers using different approximate methods
 Click on image to enlarge |
Figure 1: Activation energy graph of Murray and White & Doyle’s method
 Click on image to enlarge |
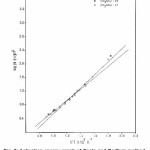
Figure 2: Activation energy graph of Coats and Redfern method
 Click on image to enlarge |
Results and Discussion
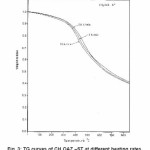
Pyrolysis – kinetics of polyamides was investigated using a thermogravimetric analysis (TGA) at various heating rates of 10, 15 and 20° K/ min in the temperature range of 300–1200°K in the nitrogen atmosphere (Fig. 3). One can see that the shape of the weight loss curves does not change with variations in heating rate, but weight loss temperatures show an increase at higher heating rates. The weight loss shows that degradation occurs almost totally in three or four steps as there are three or four peaks in DTG. TG thermograms show that the decomposition temperature, increases with the increase of the heating rate. The kinetic parameters Ea, ln A and correlation coefficient (R2) (Table 1) were determined (using non – isothermal TG data) for different conversions (d) in the range of constant single heating rates of 10,15 and 20oK / min separately from the plots of g (α) / T2 vs 1000 / T. The amount of residual fraction increases with increasing heating rate. The percentage by weight of residues were calculated to be about 0.42%, 0.41% and 0.40% corresponding to heating rates of 10,15 and 20oK / min, respectively.
Arrhenius parameters calculated in this method are found highly variable indicating a strong dependence on the type of reaction mechanism selected. Based on high correlation coefficient, random nucleation type mechanism (F3) appears the most probable mechanism10 for non–isothermal degradation of polyamide in this study with the activation energies 14.5, 18.2 and 24.6 KJ mol-1 at the heating rates 10,15 and 20oK / min, respectively. The activation energies in F3 mechanism third order reaction mechanism operating in solid state where f(x) = (1-x) 3 and g(x) = [(1-x)-2 – 1] /2 are also found to be 25.55 to 70% increased on increasing the heating rate to 15 and 20oK, respectively. But as very high correlation coefficient (R2) of linear regression are usually obtained for different form of g (α), one can not certain whether the lower values of R2 are due to inappropriate choice of g (α) or experimental errors inherited to the measurements of TG curves. Therefore, the correctness of mechanism may be considered on the basis of comparing kinetic parameters obtained from model–based as well as model free non–isothermal methods.
Figure 3: TG curves of CH3OAZ –ST at different heating rates
 Click on image to enlarge |
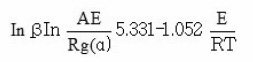
Ozawa – Flynn – Wall (Isoconversional) Method:
This method was developed independently by Ozawa1 and by Flynn and Wall2. The main equation of this method is as below.
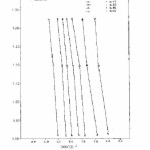
The activation energies for different conversion values (α -0.2, 0.3, 0.4, 0.45, 0.5, 0.55 and 0.6) were calculated (Table 1) from the slope of plots of log β versus 1000 / T (Fig. 4) using eqn. 3. Almost constant values of activation energies (9.8 to 14.0 KJ mol-1) were found in the conversion range from α = 0.3 to 0.5. But higher values of activation energy at α = 0.55 and 0.60) were found at higher conversions at higher temperatures which indicates that different type of degradation mechanism takes place at higher conversions. The values of activation energy obtained by this method are found increasing with increase of conversion i.e α > > 0.5 (Table 1)
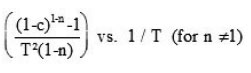
Modified Coats–Redfern method:
In order to determine the most probable model, Coats and Redfern method was used. The following modified Coats–Redfern method equation was obtained after rearranging the eqn.1.
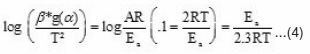
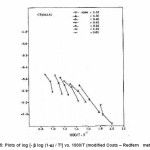
From the plot of log (β* g (α) / T2) versus 1000 / T, the activation energy can be calculated from the slope. The kinetic parameters (Table 1) were calculated for conversions at α = 0.20, 0.30, 0.40, 0.45, 0.50, 0.55 and 0.60 by plotting log {-β log (1-α) / T2} versus 1000 / T (Fig.5) according to modified Coats–Redfern eqn. 4. Values of Ea are found near and in similar order as that of Ozawa–Flynn–Wall method.
The activation energies obtained by isoconversional methods at lower conversion (α = 0.2 – 0.5) and higher conversion (α > 0.6) were found significantly different. The activation energies are also found almost constant in the range of α = 0.3 to 0.5. It predicts the different mechanisms of thermal degradation of polyamide at the lower conversion (dehydration, depolymerization, disintegration and competition between formation of volatile compounds and char) and at the higher conversion (cross–linking and aromatic cyclization of char residue). In the present study, the values of activation energy obtained in single heating rate and multi–heating rate methods in the range of conversion (α = 0.3 to 0.5) are not found very far away from each other, indicating a consistently similar mechanism is operating in this range.
Also, activation energies obtained from Murray and White, Coats and Redfern and Doyle’s methods are in good agreement with Ozawa–Flynn–Wall’s method with in the experimental error. The large difference in Freeman and Carroll’s method is found to be the determination of the difference differential functions over short temperature intervals.9 One of these involved is the tangent dw / dt. The variation in Ea is justified because of different elementary steps and complex mechanism of thermal degradation of polymer sample.
Figure 4: Plots of log β vs. 1000/T (Ozawa-Flynn-Wall method)
 Click on image to enlarge |
Figure 5: Plots of log [- β log (1-α) / T2] vs. 1000/T (modified Coats – Redfern method).
 Click on image to enlarge |
Figure 6: X – ray diffraction curves
 Click on image to enlarge |
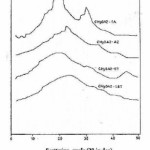
X – Ray Diffraction
Wide angle X- ray diffraction scans 2θ ranging from 0 to 50o were shown in Fig. 6. The X– ray diffraction patterns of CH3 OAZ–ST and CH3 OAZ–IST polyamides (ST = 4,41–Stilbene dicarbonyl chloride and IST = 3,31 – Stilbene dicarbonyl chloride) show a little peak indicating amorphous nature. From diffractogram of CH3 OAZ– TA (TA = terephthalic acid), we infer that the sharpness of the peak indicates the crystalline property of the polyamides. These crystalline morphologies (peak around 30o) may be related to rigidity structure of the polyamide and this should be a reason that it became brittle during film formation. Hence, it is noticed that rod–like rigidity, flexible nature of backbone and orientation of molecule control the crystallinity of a polymer.
References
- T. Ozawa, Bull. Chem. Soc. (Japan), 38: 1881(1965)
CrossRef - J. H. Flynn and L.A. Wall, J. Polym. Sci.,Polym. Lett. Ed. 4: 323 (1996). J. Res. Nat.Bur. Standard 70: 487 (1960).
- A.W. Coats and J.P. Redfern, Nature 201:68 – 69 (1964).
CrossRef - Kissinger, H.E., Anal. Chem. 29(11):1702- 1706 (1957).
CrossRef - Criado, J.M., Thermachim. Acta. 24(1): 186-189 (1978).
CrossRef - Karunanidhi, Ph.D. Thesis, university of Madras – (2000)
- P. Murray and J. White, Trans. Br. Cera. Soc 54: 151 (1955)
- C. Doyle, J. Appl. Polym. Sci. 5(15): 282-292(1961); 6: 639 (1962)
- E.S. Freeman and B. Carrol, J. Poly. Chem.62: 394 (1958)
Accepted on: 13 Feb 2011


![]()
![]()
![]()