Computational Studies of Vibration Spectra and Thermodynamic Properties of Metformin Using HF, DFT Methods
S. Srinivasan1 and V. Renganayaki2*
1Department of Physics, Govt. Arts and Science College, Ponneri, India.
2PG Department of Physics, D.G. Vaishnav College, Chennai - 600 106, India.
DOI : http://dx.doi.org/10.13005/msri/080124
Article Publishing History
Article Received on : 12 Mar 2011
Article Accepted on : 10 Apr 2011
Article Published :
Plagiarism Check: No
Article Metrics
ABSTRACT:
The molecular vibrations of metformin, one of the important anti-diabetic drugs to treat Non Insulin Dependent Diabetes Mellitus (NIDDM) have been investigated at room temperature by Fourier transform infrared (FTIR) and Fourier transform Raman (FTR) spectroscopies. The solid phase FTIR and FT-Raman spectra of the title compound have been recorded in the regions 4000-400 and 3500-250 cm-1. A satisfactory band assignment has been made on the fundamental modes of vibration. Employing the ab - initio Hatree –Fock (HF) and Density Function Theory (DFT) methods, the theoretical vibrational frequencies and geometry parameters like bond lengths, bond angles etc have been calculated and compared with the experimental values. HF and DFT calculations were performed using the standard B3LYP/6-31G** method and basis set combination. Optimized geometries were obtained using the global optimization procedure. Theoretical investigations of harmonic vibrational frequencies and thermodynamic properties viz. the zero point vibrational energy (ZPVE), entropy, heat capacity have been carried out. It has been found that both methods gave consistent data for geometric parameters, but DFT yielded vibrational frequencies much closer to the experimental values.
KEYWORDS:
Metformin; FTIR; FT Raman; ab - initio; DFT; thermodynamic functions
Copy the following to cite this article:
Srinivasan S, Renganayaki V. Computational Studies of Vibration Spectra and Thermodynamic Properties of Metformin Using HF, DFT Methods. Mat.Sci.Res.India;8(1)
|
Copy the following to cite this URL:
Srinivasan S, Renganayaki V. Computational Studies of Vibration Spectra and Thermodynamic Properties of Metformin Using HF, DFT Methods. Mat.Sci.Res.India;8(1). Available from: http://www.materialsciencejournal.org/?p=2569
|
Introduction
Type 2 or NIDDM is a metabolic disorder that affects more than 200 million people world-wide.1 The different classes of oral hypoglycemic agents used to treat NIDDM have complementary mechanisms of action, and their use in combination often results in blood glucose reduction that are significantly greater than those that can be obtained with maximal dose of any single drug.2,3 Metformin belongs to the class of biguanides and it is chemically known as 1, 12–dimethyl biguanide hydrochloride. It is a white hygroscopic crystalline powder with a bitter taste with a molecular formula C4H11N5 HCl. Metformin is an exciting drug having major impact on the treatment of type 2 diabetes is that it increases insulin sensitivity by both decreasing hepatic glucose output and enhancing peripheral glucose uptake. Metformin also decreases plasma Very Low Density Lipoprotein (VLDL) and triglycerides resulting in modest decreases in plasma total cholesterol, which in turn reduces cardio vascular risk factors.4
In the present study, a detailed vibrational analysis has been made using FTIR and FTR spectra of metformin. The ab-initio and density function theory (DFT) methods have become powerful tools for the investigation of molecular structure and vibrational spectra.5 Literature survey shows that molecular mechanics computational studies have been done so far on the titled compound.6 The evolution of DFT that includes electron correlation in an alternative way is affording opportunities of performing vibrational analysis of moderately large molecules. The present work has been performed with a view point of getting vibrational frequencies on an optimized geometry of metformin using DFT based Becke3-Lee-Yang-Parr (B3LYP) functional with standard 6-31G** basis set which has not been carried out so far. These frequencies are analyzed and compared with the experimental data. In the study of chemical kinetics and chemical equilibria, the knowledge of various thermodynamic functions is of immense importance.7 Understanding the molecular properties as well as the nature of reaction mechanism has been the subject of many experimental and theoretical studies. The molecular parameters like IR intensity of harmonic frequency of vibration, reduced mass, force constants and various thermodynamic parameters like entropy, heat capacity and energy have been evaluated.
Experimental
The spectroscopically pure grade sample of metformin was procured from a reputed pharmaceutical company, Sun Pharmaceutical Industries Ltd, Mumbai, India and was used as such for the spectral measurements. The room temperature FTIR spectrum of the title compound has been recorded in the range 4000 – 400 cm-1 in the solid state at SAIF, IIT Madras, Chennai, India. The BRUKER IFS 66V model FTIR spectrometer had globar as the source and the interferometer chamber had KBr beam splitter. The sampling technique used was KBr pellet method. The FTIR spectrometer had a resolution of ±1cm-1. They had the facilities of signal averaging, signal enhancement; baseline correction and other spectral manipulation made possible with multitasking OPUS software on the dedicated PC/ INTEL-4.
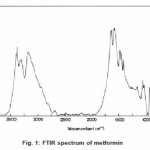
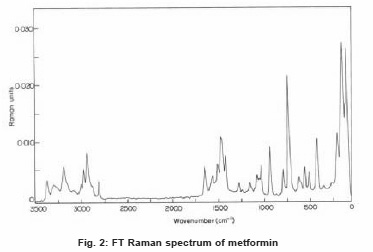
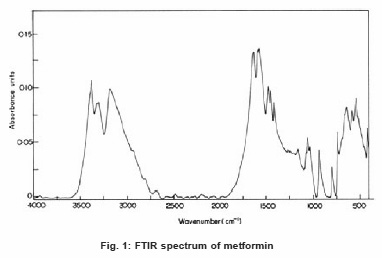
The FT-Raman spectrum of metformin was recorded on a computer interfaced BRUKER IFS 66V model interferometer equipped with FRA-106 FT-Raman accessories at IITM, Chennai. The spectrum was recorded in the Stokes region 3500-250 cm-1 using Nd: YAG laser operating at 200 mw power continuously with 1064 nm excitation. The reported wave numbers are expected to be accurate within ±1 cm-1. The FTIR and FTR spectra of metformin are presented in the Figure 1 and 2 respectively.
Figure 1: FTIR spectrum of metformin
Figure 2: FT Raman spectrum of metformin
Results and Discussion
Vibrational Band Assignment
The aim of the vibrational analysis is to decide which of the vibrational modes in the molecule give rise to each of the observed bands at specific wave numbers in the FTIR and FTR spectra. The functional groups present in the molecule were identified and a satisfactory vibrational band assignment has been made for the fundamental modes of vibration by observing the position, shape and intensity of the bands. Vibrational frequencies of similar compounds like guanidines and their hydro halide derivatives have been taken into consideration for the assignment of fundamental vibrations of Metformin.8, 9
N-H Vibrations
The N-H stretching of C=N–H group occurs in the region 3400 – 3100 cm-1. Usually the frequency of this vibration is decreased in the presence of hydrogen bond.10 The medium intensity bands at 3392, 3372 cm-1 and 3297, 3176 cm-1 have been assigned to N-H asymmetric and symmetric stretching vibrations respectively. N, N2 di substituted guanidine hydrochlorides have medium intensity bands at 1590–1530 cm-1 due to in plane NH2 deformation.9 Bands at 1566, 1533 and 1508 cm-1 have been assigned for NH2 in plane deformation vibrations. N-H wagging vibrations occur in the region 910 – 660 cm-1. The bands of very weak intensity at 936, 800 and 736 cm-1 are due to N-H wagging.
C=N, C–N Vibrations
Guanidines absorb strongly at 1685 – 1580 cm-1 due to C=N stretching vibrations8. Metformin being a biguanide, has strong absorption bands at 1626 and 1583 cm-1 which are due to C=N stretching vibrations. It has been reported that C–N stretching of aliphatic amine compounds is generally weak and occurs in the region 1220 – 1020 cm-1.11 The weak intensity bands in the FTIR spectra at 1205, 1160, 1151, 1142, 1080, 1061 and 1035 cm-1 have been assigned to C–N stretching vibrations. Medium to weak intensity bands in the frequency range 600 – 400 cm-1 are due to CNC deformation vibrations.8 The peaks at 571, 541, 517, 482, 464, 446 and 420 cm-1 are assigned for CNC deformation.
C–H Vibrations
For aliphatic compounds, CH asymmetric stretching vibration of the methyl group occurs at 2975 – 2950 cm-1 and the symmetric CH3 stretching vibration absorbs at 2885 – 2865 cm-1. The presence of an adjacent group alters the position of CH3 symmetric stretching vibration whereas the asymmetric band is insensitive to it.12 In Metformin, the presence of nitrogen near methyl group reduces the symmetric CH3 stretching range as 2835 – 2815 cm-1.13 Bands at 2964 and 2821 cm-1 are assigned to CH asymmetric and symmetric stretching vibrations of the methyl group respectively. The methyl groups give rise to two deformation bands, the asymmetric one in the region 1475 – 1445 cm-1 and the symmetric at 1390 – 1370 cm-1.9 Bands of medium intensity at 1475, 1455 and 1417 cm-1 are due to CH3 asymmetric deformation. Weakly intense bands at 1383 and 1357 cm-1 belong to CH3 symmetric deformation.
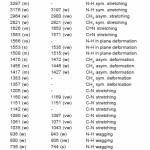
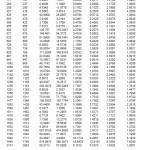
The infrared and Raman spectral assignments and the experimental vibrational frequencies of metformin have been presented in Table 1. The theoretically calculated vibrational frequencies, IR intensity, reduced mass, force constants for the molecule metformin using HF and DFT methods are presented in Table 2. The vibrational frequencies are in accordance with the experimental data.
Table 1: % Vibrational band assignment of metformin
Table 2: Vibrational wavey numbers obtained for metformin by B3LYP/6-31G**level: (wave number (cm-1); IRintensity (km mol-1) reduced mass (amu) force constants (m dyne A-1)
Molecular Geometry
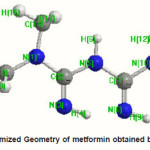
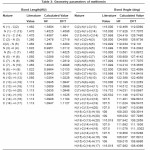
The optimized molecular structure of metformin is shown in figure 3. The global minimum energy for metformin using the DFT structure optimization calculated as -432.6759 Hartrees and in HF method as 429.9791 Hartrees. Further the optimized geometrical parameters such as bond lengths and bond angles are obtained by the large basis set calculations (the global minimum energy) for the molecule and are presented in Table 3. These structural parameters are in good agreement with the literature values.14, 15
Figure 3: % Optimized Geometry of metformin obtained by DFT Method
Table 3: Geometry parameters of metformin
Thermodynamic Function Analysis
The total energy of a molecule is the sum of translational, rotational, vibrational and electronic energies.
ie, E = Et + Er + Ev + Ee
Thus the molecular partition function is the product of the translational, rotational, vibrational and electronic partition functions of the molecule.16 The relations between partition functions and various thermodynamic functions were used to evaluate the latter due to translation, vibration and rotation degrees of freedom of molecular motions.9
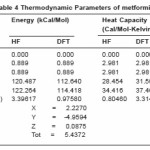
The statistical thermo chemical analysis of metformin is carried out considering the molecule to be at room temperature of 298.15 K and one atmospheric pressure. In the methodology of B3LYP computations, the contributions due to internal rotations are not considered. The free energy of the molecule is calculated including zero point vibrational energy. The values of zero point vibrational energy (ZPVE) of the molecule were 107.9710 kcal/mol by DFT method and 116.2475 kcal/mol by HF method respectively.
Microscopically, the thermal energy is the kinetic energy of a system’s constituent particles, which may be atoms, molecules, electrons, or particles in plasmas. The titled molecule is considered as an asymmetric top having rotational symmetry number one and the total thermal energy has been arrived at as the sum of electronic, translational, rotational and vibrational energies. Table 4 summarizes the calculated thermodynamic parameters namely heat capacity, entropy, rotational constants and dipole moments of metformin.
Table 4 Thermodynamic Parameters of metformin
Conclusions
The DFT based quantum mechanical approach provides the most reliable theoretical information on the vibrational and thermodynamic properties of metformin. In the present investigation, a complete vibrational band assignment has been made available for metformin using FTIR and FTR spectra. The optimized geometrical parameters and vibrational frequencies of the fundamental modes of metformin were performed and analyzed both at HF and DFT level of theories utilizing B3LYP functional and standard basis set 6-31G (d, p).
Geometry parameters obtained during the course of present investigation show that a better agreement between the experimental data in the literature and the computed data is obtained by using DFT method. The statistical thermo chemical analysis of metformin carried out considering the molecule to be at room temperature of 298.15 K and one atmospheric pressure provided various thermodynamic functions of metformin. The results confirm the ability of the methodology applied for the interpretation of the vibrational spectra of the title compound in the solid phase.
References
- King H A & Herman W, Diabetes care, 21:1414 (1998).
CrossRef
- UK Prospective Diabetes study Group,Lancet, 352: 837 (1998).
CrossRef
- Charpentier G, Diabetes Metab Res Rev, 18:S70-6 (2002).
CrossRef
- Bailey C J & Turner R C, N Eng J Med, 334:574 (1996).
- Parr RG &Yang W, Density Functional Theory of atoms and molecules, Oxford University Press, Oxford (1989).
- Truhlar D G, Steckler G R & Garden M S,Chem Rev, 87: 217 (1987).
CrossRef
- Gupta S L & Kumar V, Elementary Statistical Mechanics 12th Ed., Pragati Prakashan,Meerut, India (1993).
- Socrates G, Infrared Characteristic Group Frequencies, 1st Ed. John Wiley, New York (1980).
- Bellamy L J, The Infrared Spectra of Complex Molecules, 3rd Ed., Chapman and Hall,London, New York (1975).
- Colthup N B, Daly L H & Wiberly S E,Introduction to Infrared and Raman Spectroscopy, 2nd Ed., Academic Press, NewYork (1975).
- Gunasekaran S & Usha Desai, Proc Indian Natl Sc Acad Part A, 59: 301 (1993).
- Sharma A, Gupta V P & Virdi A, Indian J Pure & Appl Phys, 40: 246 (2002).
- Dalton F, J Chem Soc, 2: 2927 (1960).
CrossRef
- Hariharan M, Rajan S S & Srinivasan R, Acta Cryst, C45: 911 (1989).
CrossRef
- Sutton L E, The inter atomic bond and bond angles in molecules and ions, Chemical Society, London (1956).
- Srinivasan S, Gunasekaran S,Ponnambalam U et al, Indian J Pure & Appl Phys, 43: 459 (2005).

This work is licensed under a Creative Commons Attribution 4.0 International License.

