Rare-earth and transition metal mixed compounds are of very much interest due to their usefulness in various industries and devices..1-4 They also show very interesting physical properties5-8 because of multivalent character of transition metals. Our research group have undertaken the study of magnetic, dielectric and electrical transport properties of rare-earth compounds such a sesquioxides, tungstates, garnets, chromites, vanadates, molybdates.9-16 Rare-earth nickelates RNiO3 are perovskite type compounds with general formula ABO3 (where A is large non magnetic alkali, alkaline earth or magnetic rare earth ion and B is a small transition metal cation). Such compounds exhibit ferroelectic, semiconducting and magnetic properties interesting both from theoretical and experimental point of view. This paper reports the transport studies of NdNiO3, SmNiO3 and EuNiO3 in the temperature interval 400-1200K. Magnetic and dielectric studies have already beed reported.17-18
Material Preparation and Experimental Procedure
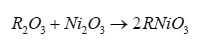
The base materials for the preparation of studied compounds were rare-earth sesquioxides R2O3 (procured from Rare and Reserach Chemicals, India with stated purity of 99.999%) and Ni2O3 (procured from Bonds, India with stated purity of 99.99%). All these oxides were dried around 500K before use. The stoichiometric amount of these oxides were mixed thoroughly, made into pellets and fired around 800K in a platinum crucible in air for 24h. The reaction product after regrinding again made into pellets and fired around 1200K for 30h. The final product was cool down slowly. The prepared compounds undergo following solid state reaction.
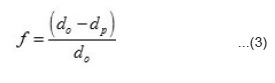
To get confirmation regarding the complete formation of the prepared compounds X-ray diffraction study have been carried out at room temperature using CuKα line (λ=0.15418 nm). From X-ray diffraction pattern, dhkl values have been evaluated using relation
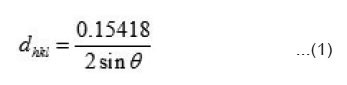
with these values of dkhl, structure of the compounds were resolved using usual procedure. All the peaks have been identified and assigned proper hkl values. This ensures that prepared compounds are in single phase and no unreacted base materials was left behind. The compounds have been found to have orthorhombic unit cell [Table not shown] the measurement of electrical conductivity (σ) and Seebeck coefficient (S) have been done on pressed pellets sintered for 24 h around 800K. A two electrode method has been employed. Platinum foils have been used as electrode material. The details of measurements were as described in earlier publications of our group.11,16
Results and Discussion
Measurements of σ and S were performed pellets because it is extremely difficult to grow large single crystal of these compounds due to their hight melting poing. In polycrystalline pellets, grain boundaries and air pores considerably reduce the electronic conductivity measurements on them generally do not reflect the bulk value for the material. It is not possible to eliminate completely the grain boundaries and air pores. However, the pellets can be prepared in such a way that their influence is considerably reduced. With clean grain boundaries, the bulk value for the material can be obtained by suitable corrections for the porosity. The first requirement in this direction is to make pellets of uniform density. This has been achieved by using proper steel die and keeping the ratio of the thickness square (t²) to face area (A) of the pellet less than four as given by other workers.19 Air pores are considerably reduced by making use of fine grain powders and higher pelletizing pressure (P) and sintering the pellets around 800K for forty hours. Pellets made at P > 8 × 10⁸ n m-2 have a density (dp) equal to 80 to 83 percent of the density (do) calculated from X-ray data. From the density data the single crystals value of electrical conductivity (s) have been obtained from the measured value of σp using the relation described elsewhere¹¹
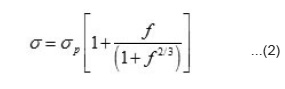
where porefraction
The grain boundary effect in pellets made at such higher pressure is also considerably reduced. The fact is evident from the indepedence of σac on signal frequency (0-105 Hz). The electrodes on the pellet faces also play a significant role in the σ and S measurements. Ohmic contact between pellet and electrode interface is a stringent criterion.19 It has been checked that platinum foil electrodes form ohmic contact on the pellets of all nickelates but at very fields (E~ 0.60 × 10³ V/m) by measuring current density through the pellet at different applied voltages at constant temperature (Figure not shown). It has also been observed that both σ and S do not depent upon the dimensions of the pellet. Further, S does not depent upon P and therefore needs no correction. The dc current density (J) through the pellet of the studied compounds has also been measure as a function of time at constants temperature and applied dc field. It has been found that J is independent of time. This indicates that electrical conductivity of studied compounds is essentially electronic and ionic conductivity is negligibly small (figure not shown).
The sutyd of electrical conductivity together with Seebeck coefficient gives idea about the conduction mechanism. To understand the transport mechanism in the studied nickelates, the steady state dc electrical conductivity and Seebeck coefficient of several pellets of each nickelates with platinum foil electrodes have been measured in both the heating and cooling cycles between the temperature interval 400-1200K. No hysteresis was observed at higher temperature except only slight
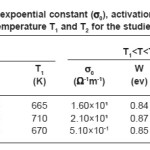
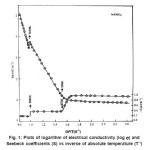
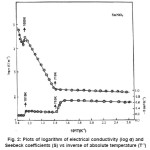
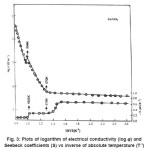
difference at lower temperature. This indicates that the compounds are not hygroscopic. The variation of electrical conductivity σ with the temperature for studied compounds are shown as log σ vsT-1 plots in Figs. 1-3. It is seen from these figures that the plots are linear in specific temerature regions with different slopes. In general they can be divided in three linear regions namely (i) T > T1 (ii) Ti < T< T2 and (iii) T > T2. The temperatures T1 and T2 may be termed as break temperature. The linear regions can be expressed by the relation.
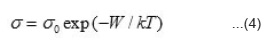
where σ0 is pre-exponential constant and W is the activation energy corresponding to the slope of the straight lines. The values of σ0 and W are different for different nickelates and for different regions of the same nickleates. The evaluated values of σ0, W, T1 and T2 are given in Table 1.
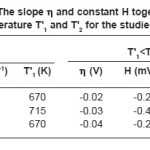
Seebeck coefficient measurement gives idea about the nature of chargfe carries taking part in the conduction. The accuracy of the measurements depends upon the resistance of the sample pellet. Thus typical error in the reported values of S is about ±10 percent. The results of S variation with T-1 are shown in fig. 1-3. It is seen from the plots that S values are negative throughtout the studied temperature range indicating that the mobile charge carriers are holes. These plots have three linear regions and the slope in earch linear region is very small. The value of S in each linear region can be expressed by the relation.
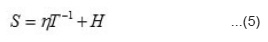
Where h is the slope of S vs T-1 plot and H is a constant and its value is equal to the intercept on S axis. The evaluated values of h and H in different temperature regions of the studied compounds together with break temperatures T’1 and T’2 are given in table 2.
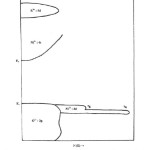
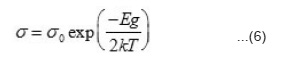
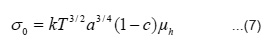
The electronic conduction in solids is usually explained on the basis of an energy band model. The relevant bands which may be important in electrical conduction in these solids are empty R3+: 5d, Ni3+: 4s bands, partially filled Ni3+: 3b bands, extremely narrow R3+: 4fn levels and completly filled O2-: 2p bands. The magnitude of electrical conductivity in studied nickelates is several order of magnitude larger than in the corresponding R2O320. Thus R3+: 5d band should not come in the picture in the electrical conduction of these solids. The semi empirical model proposed by Goodenough²¹ is helpful in deciding the relative position of these bands. On qualitative basis Ni3+: 4s band should be separated from Ni3+ : 3d band should lie few electron volt above it. RNiO3 are quite stable and therefore O2-: 2p band should lie below Ni3+: band, The position of R3+: 4fn levels is not very certain but is must lie close to the top O2-: 2p band. However, they will shift sequentially down till they are half filled (4f7). On the basis of these arguments, a general schematic energy band diagram of RNiO3 will be as shown in fig. 4. In the temperature region T > T2 the intrinsic band conduction is the dominant conduction mechanism in these solids and is due to the normally generated electrons from 02+: 2p band to Ni3+: 4s band. Thus hole will conduct in O2-: 2p and eletrons in Ni3+ : 4s bands. In such a situation, the temperature variation of electrical conductivity is given by the relation²².
Where
with
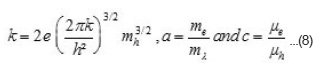
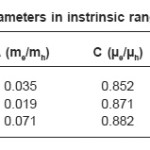
According to this relation, the log σ vs T-1 plot should be a straight line with a slope -Eg/2k and it has been observed experimentally. From the slope of the straight line, energy band gap (Eg) has been evaluated and is given in table 3 for the studied nickelates. It is seen from the table that Eg ~ 3eV, which is quite reasonable for instrinsic band conduction.
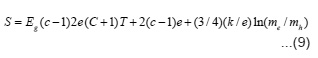
In band conduction, the temperature variation of µe and µh, and me and mh is expected to be similar. Therefore, it is reasonable to assume that their ration will be constant in the studied temperature range. Hence second and third terms in the above equation will remain constant with temperature. Thus above expression can be written as
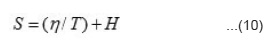
Where
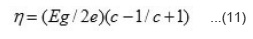
and
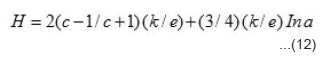
The S vs T-1 plots should be straight line with has been found experimentally. From those plots, h and H can be evaluated. Knowing the values of Eg. h and H, both an c can be evaluated using equation 8 by taking mass of the majority charge carrier (holes) to be equal to the mass of free electron. These values are given in table 3. It is seen from this table that mobility of the majority charge carriers lie in the expected order 10-3m²/V or more of the intrinsic band conduction.
In the temperature range T < T1 < T2, the slope of log s vs T-1 plots becomes small and that of S vs T-1 plots becomes large and constant with temperature. This indicates that conduction mechanism is hopping type. A hole from Ni3+ centre may hop to neighbouring Ni2+ centre giving hole type hopping conduction and will be given by the expression.24
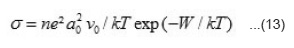
Where n is the number of Ni3+ centres per unit volume in the specimen at temperature T, a0 is minimum distance between neighbouring Ni3+ centres and can be evaluated from crystal structure, v0 is the hopping frequency and can be obtained from the literature,25 W is the activation energy and k is Boltzmann constant. Thus value of n can be evaluated for studied nickelates. In hopping conduction, S remains indepedent of temperature and is expressed by the relation.25
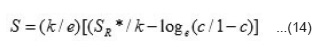
Where SR* stands for effective entropy of the lattice which is temperature indepedent, SR*/e is very small (~ 10µV) and c = n/NS, we have
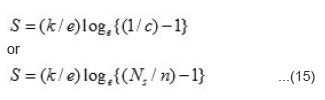
The value of Ns can be obtained by the relation
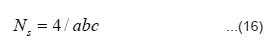
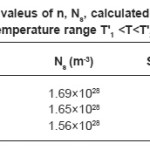
Where a, b and c unit cell parameters of studied nickelates. Knowing the values of n and Ns, the value of S can be evaluated. The calculated and experimental values of S in the temperature T1 <T<T2 are given in Table 4 together with the values of n and Ns. It is seen from table that there is very good agreement between calculated and experimental values of S. The mobility of the hopping conduction (µ) is given by the relation.²³
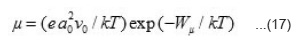
Where Wµ is the mobility hopping activation energy and is given by the expression
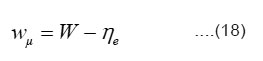
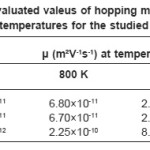
Since a0, W and h for studied compounds are known, so value of hopping mobility (µ) can be evaluated at different temperatures for the region T’1 < T < T’2. These values are given in table 5.
It is seen from this table that the mobility of charge carriers is appropriate for hopping conduction and it confirms conduction via hopping mechanism. On furtehr decrease of temperature i.e. in the region T < T’1, probability of hopping becomes small and the electrical is taken over by the acceptor type impurities. In this case the slope of S vs T-1 plots becomes same as that of log σ vs T-1 plots.
Table 1: Pre-expoential constant (σ0), activation energy (W) and break temperature T1 and T2 for the studied nickelates
Table 2: The slope η and constant H together with break temperature T’1 and T’2 for the studied nickelates