Effects of Geometrical Cross- Section on Fatigue Strength of Aluminum Alloy (6063)
Suleiman Q. Abu-Ein, Ghazi S. Al-Marahleh* and Sayel M. Fayyad
Department of Mechanical Engineering, Faculty of Engineering Technology-Al Balqa' Applied University, P.O. Box 15008, Amman, Jordan.
DOI : http://dx.doi.org/10.13005/msri/080201
Article Publishing History
Article Received on : 12 Jul 2011
Article Accepted on : 01 Sep 2011
Article Published :
Plagiarism Check: No
Article Metrics
ABSTRACT:
This research constructs a relationship between the geometrical cross section and the fatigue strength of aluminum alloy (6063). Different geometrical cross - section specimens were manufactured with the same section space, the specimens were tested under bending and unbending loading conditions. The strain was calculated and fatigue curves were drawn for all different forms of sections. After studying and analyzing the results, it became clear that increasing the sides in any form increases the fatigue strength as the strain is fixed. Fatigue curve equations were derived using computing techniques and connected to find a mathematical relationship between the geometrical shape of the section and fatigue strength. Equation were derived in order to determine the stress or strain, a specimen of a certain section figure can endure to fail under the effect of a number of cycles. The results show a good agreement when applying the same conditions for all specimens.
KEYWORDS:
Fatigue; Aluminum alloy; Bending; Stress; Strain; Cross-section; Fatigue curves
Copy the following to cite this article:
Abu-Ein S. Q, Al-Marahleh G. S, Fayyad S. M. Effects of Geometrical Cross- Section on Fatigue Strength of Aluminum Alloy (6063). Mat.Sci.Res.India;8(2)
|
Copy the following to cite this URL:
Abu-Ein S. Q, Al-Marahleh G. S, Fayyad S. M. Effects of Geometrical Cross- Section on Fatigue Strength of Aluminum Alloy (6063). Mat.Sci.Res.India;8(2). Available from: http://www.materialsciencejournal.org/?p=2614
|
Introduction
Parts of machines are often exposed to varying stress, so it is important to know the resistance of materials under these conditions. In addition, it is known that materials exposed to perpetual loads or reversed stresses fail at stress values less than the final resistance value of those materials, especially at the static load. The fatigue can be described as the phenomenon of advanced failure that arises from the formation of cracks and the growth and spreading of these cracks. There is no full explanation for the microscopic behavior of the formation of these cracks and their spread, but this phenomenon can be clarified as follows. The crack initiation and the constant movement of crack area until failure occur probably in many forms through the movements of layers which produce weak bands on the surface. The static shear stress results in the occurrence of slipping degrees on the surface about (10-4 to 10-5) cm high, which are described as slipping coarse bands. Under the cyclic loading conditions, it is familiar to notice the existence of slipping bands of the height order of (10-7) cm in the areas from which the cracks initiate. These slips cause extrusions and intrusions to occur on the surface of the specimens, the same happens in the reversed slips caused by the reversed loads. These extrusions and intrusions could have sharp forms or un-sharp forms. Many studies discussed this phenomenon. M. Zlatanoviæ (2003) discussed nitriding, nitrocarburizing, carburizing, boriding and similar diffusion processes which may occur in different working media that provide active species for diffusion into surface zones of materials. Wear and corrosion resistant coatings of different chemical composition, texture and morphology may be grown onto the surface of industrial parts by various chemical, electrochemical, mechanical, and thermal, plasma or combined processes. By combining diffusion and deposition processes; the techniques that belong to the most advanced industrial surface treatments, a new quality surface structure may be obtained. It has been found that the excellent mechanical, tribological, corrosion and decorative behaviors of steel components were produced by nitriding/nitrocarburizing followed by a post oxidation process. The combinations of gas nitriding, plasma cleaning and post-oxidation, as well as salt bath nitriding and post – oxidation, were successfully applied and opened a new field of combined technology investigations. Principles, properties and some applications of combined technologies and pulse plasma were discussed,.1 Jeffrey M. et al. (2006) examined and evaluated the behavior of an aluminum deck panel when loaded to failure. The specific objective was to develop accurate finite element models of the deck panel that would predict behavior of the panel as loads approached the failure load. This predicted response could then be compared with experimental response information obtained from two ultimate-load laboratory tests. Such report documents the findings from the ultimate load simulations.2 Johan Maljaars et al. (2005) investigated the material properties and mechanical response models for fire design of steel structures based on extensive research and experience. It is found that the behavior of aluminum load bearing structures exposed to fire was relatively unexplored. This article gave an overview of physical and mechanical properties at elevated temperatures of frequently applied aluminum alloys, found in relevant literature, and discussed mechanical response models currently applied for fire exposed aluminum structures. A comparison was made with steel structures exposed to fire.3 R. Gitter (2008) stated that aluminum has in fact proved itself as a suitable material for load bearing structures for more than one hundred years. However, certain knowledge of aluminium is necessary to design structures. In combination with the materials and material provisions of EUROCODE 9: EN 1999, the task of this work was to cover the most important aspects needed to design by using aluminum. It covered the important differences in physical properties compared to steel which need to be understood to design aluminium structures. It covered the influence of heat on the mechanical properties of aluminium. The essential metallurgical aspects were explained to enable the understanding of aluminum’s nomenclature system for alloys and their temper designations. It dealt with the alloys listed in EUROCODE 9 and gave a good background information and advice for their selection and application for structures. In particular, the design of extruded profiles and material selection combined with this topic were treated in a special section.4
Methods of Testing The Fatigue
There are two methods for testing the fatigue one of them depends on making the power or stress applied on the specimens constant and knowing the number of cycles until failure is reached when imposing a little load or a relatively little stress. Here, this stress does not change by increasing the cycles imposed. In this case, the specimens endure a relatively big number of cycles (more than 106), and the fatigue resulting is called high cycle fatigue. The second method depends on making the amount of strain constant and knowing the number of cycles. This method is used when the imposed load is relatively high. The amount of imposed stress to achieve the strain itself changes according to the change of the number of cycles as a result of the strain hardening in some metals, or as a result of the strain softening in other metals. For this reason, the amount of stress cannot be used to achieve the fatigue curve, but the strain amount should be fixed and the number of cycles known. When choosing the method of testing, the factors that affect the fatigue resistance must be taken into consideration. Among the most important factors is the consideration of stresses in certain areas where the fracture begins before the other areas. The other factor that affects the fatigue resistance is the nature of the surface of the parts exposed to successive loading cycles.5
The Effect of Stress Average on the Fatigue Strength
Endurance tests are carried out for completely reversed stresses: σ max/σ min =R or σ max= σmin =-1. There are many cases in the mechanical designing in which the stress change is not completely reversed. It is important to know the endurance limit under the effect of such changing stresses. Previous researches have indicated that the stress range (R) necessary to create the fracture decreases with the stress average. Using the results of researches, which suggested using an equivalent law that links between the stress range (R) and the stress average (σm), the equivalent curves shown in Figure 6 link the stress average with the stress range as percentage of the final resistance. The stress range has a maximum value when the stress is completely reversed; that is (σm=0), while it reaches zero when the stress average reaches the resistance value. So, if the endurance limit for the reversed stress and the final resistance are known, it will be possible to find the endurance limit in any kind of stress variation by using these curves. Other studies have shown that there is no general law that links between stress average and stress range. However in some materials the relationship between stress average and stress range is represented more accurately by the dotted straight lines,5
Material and Methods
Experimental Considerations and Specimens Preparation
Specimens of different forms of sections have been chosen. Specimens with quadrate, triangular, hexagonal and octagonal sections were chosen in order to obtain a fixed section space for all the used sections.
Studied Specimens Specifications
Section Space = 6 cm2 , Specimen length= 20 cm. All the specimens’ bars were prepared from aluminum (6063) which has the following properties:
Chemical and Physical Properties
|
Si%
|
Mg%
|
Density
|
Electrical
|
|
|
|
|
conductivity
|
|
0.4
|
0.7
|
2.71g/cm
|
50
|
|
Mechanical Properties
|
|
|
Yield strength
|
|
175 N / mm 2
|
|
Ultimate strength
|
|
220 N / mm 2
|
Brinell hardness (500 kg load, 10 mm boll): 25.
Methods and Experimental Test
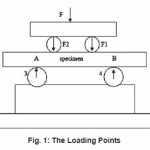
One of the main parts of the device is the specimen fixation straining unit. The specimen can be fixed according to the type of the test and strain of tension or pressed by changing the screws depending on the type of the test. The second part of the device is the control board. The device can impose an alternating strain in different forms, where alternating strain can be imposed as a sine wave, a saw – tooth wave or a quadrate wave. The specimens were loaded through the set designed and fabricated, Fig. 1. When a vertical strain is imposed (tension – compression), a moment is obtained on the ends of the specimen, through this moment the specimen will be under an equal load along it (the middle part between the interior loading points). Therefore, all the points of the specimen that have the same distance from the middle line will have the same loading and will be exposed to the same stress.
Figure 1: The Loading Points
The imposed strain can be calcu1ated by the imposed moment, such that if strain is (ε), the moment can be given as
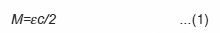
where c: is the distance from the neutral axis.
The deviation can be read through the meters installed on the specimen. The reading is compared with theoretical calculations and might contain an error in the case of imposing high strain.
Considering that the exterior surface of the specimen is flat, the strain on the surface of the specimen or any level from the middle line can be calculated. Also, through imposing the strain and reading the deviation the maximum strain which is on the exterior surfaces can be obtained for all specimens.
The Effect of Strain Average on the Fatigue Strength
Experiments were carried out on part of the specimens through imposing a strain where the average does not equal zero (εm ≠0). The average of the stress was fixed to a value of (σ m = 0.001). The effect of average on the fatigue strength was concluded by calculating the number of cycles until the failure of the specimen.
Results and Discussion
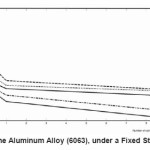
Through the experiments carried out on the forms of specimens the dimensions of which are previously cleared and which have the same section space, results showing the number of cycles in the maximum strain area were obtained for all the forms of specimen sections. Analyzing the results, a difference can be noticed in the fatigue strength for these forms in case of imposing the same strain on the specimen. Here, the strain itself is the maximum strain which is on the upper and lower surfaces of the specimen in this case of loading. That is, the specimen with more sides can endure more strain than the specimen with fewer sides, Fig. (2).
Figure 2: Behavior of the Aluminum Alloy (6063), under a Fixed Strain Value (ε = 0.001)
The mathematical relation between the section form and the fatigue strength can be written as
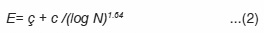
This equation applies in all cases where the value of(ç) is fixed for all the sections and depends on the quality and mechanical properties of the metal, whereas the value of (c) is fixed for each single section and depends on the number of sides of the specimen section as follows
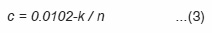
where
n: is the number of sides and k is constant in all cases.
Equation (2) can be rewritten as
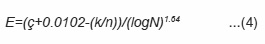
To find the strain that a form can endure, we can apply the previously mentioned relations with the condition that all the specimens are made of the same metal and have the same section space and mechanical properties. The fixed values mentioned in equation (4) (ç ,k ) can be found by means of the computer. The previously mentioned equations are fixed because of the use of the same ç=0.085 and k = 0.036.
The Relationship Between Maximum, Strain, Profile Shape And Fatigue Strength
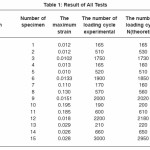
For the purpose of knowing the distribution of stress throughout the section of the specimen and the maximum stress, the specimen is exposed to a tensile test carried out to know the mechanical properties of the metal used in the research. The results obtained are shown in Table (1). In order to find the relationship between stress the specimen can endure and the section form (the number of section sides), the maximum strain was found with the number of cycles. The results obtained show the maximum load value imposed on the specimen with the number of loading cycles the specimen can endure to reach the failure stage. The more the value of the maximum strain imposed on the specimen, the less the number of the loading cycles. This relationship is not linear, since by reducing the strain in a certain percentage the number of cycles to reach failure increases in a higher percentage. This applies to all the specimens with different forms of sections.
Table 1: Result of All Tests
It can also be noticed that the specimens with a round section can endure more cycles in the case of imposing an equal strain on all the forms of specimens, and that a fixed change occurs according to the number of sides of the form of section of the specimen.
Stress can be written as :
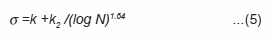
where the value of (k) is fixed for all the forms and is affected by the mechanical properties of the metal. Because all the specimens are made of the same metal and have the same properties; whereas the value of (k2) is different from a case to another, depends on the form of the cross section of the specimen and can be represented by the following formula:-
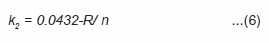
n = number of sides of the form.
The value of R is constant for all the forms, and by substituting the value of (k) in equation (5), σ can be written as
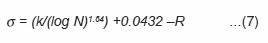
The value of the constants (R and k) for this metal can be calculated to be k = 0.36 and R=0.1527 .In order to find the maximum load that any form can endure the same number of loading cycles or another form on which a known maximum strain is imposed can endure, the previous relationship can be applied
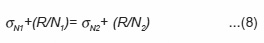
where σN1: is the amount of maximum stress in the first specimen, N1: is the number of sides of section of the first specimen, σN2 is the amount of maximum strain in the second specimen, N2: is the number of sides of section of the second specimen. In order to verify the equation, experiments were carried out on specimens of different forms under different loads. The results are shown in Table (1) which shows the error percentage in the obtained equation compared to the results of the experiments.
The Effect of the Number of Loading Cycles on the Form of Fracture
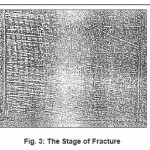
There are three stages for the fracture, the first one is faster than the second and is represented by the initiation of the crack and its growth, and the second stage is slow and makes the fracture surface relatively soft and burnished.
In the Third Stage, the Specimen Turns into the Elasticity State where the Fracture is Relatively Fast.7
Throughout the experiments, the three stages of the fracture for a real specimen can be noticed and is shown in Figure 3. In the first stage, the fracture has an angle of (45o) for indicating that the fracture growth in this stage is due to the maximum static shear stress which has an angle of (45o). The second stage as indicated in the figure is vertical towards the direction of the maximum natural stress; therefore the fracture is vertical on the specimen section. In the third stage the specimen converts to the elasticity state, where the elastic defect can be noticed before the final separation of the specimen
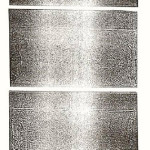
By taking a sample of the broken specimens and noticing the form of the fracture section shown in Figure 11 which represents quadrate section specimens, we can see a difference in the fracture section surface in a way that each of the three specimens is differently loaded from the other, and consequently each one is fractured with a different number of cycles as shown in Table 2.
Figure 3: The Stage of Fracture
Figure 4: the Different Fracture Surfaces of Quadrate Section Specimens
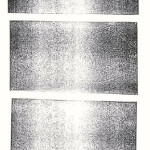
Figure 5: the Different Fracture Surfaces of Hexagonal Section Specimens
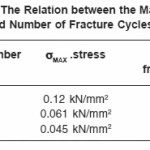
Table 2: The Relation between the Maximum stress and Number of Fracture Cycles Needed
It can be noticed from the table that specimen number (1) is loaded with a higher stress relative to the other specimens and fractured with a less number of cycles than specimens number (2) and (3). By noticing the form of the fracture shown in Figure 4, it can be noticed that the burnished surface part of the third specimen is bigger than the burnished surface parts of the first and second specimens. Therefore, it can be decided whether the specimen is fractured as a result of the fatigue of a low number of cycles or that of a high number of cycles. This can be applied to all the forms of other specimens as noticed in Figure5, which represents fracture surfaces of real hexagonal samples.
References
- Zlatanovic. M. “Combined Plasma Surface Treatments for Wear and Corrosion Protection”, Tribology in Industry, 25(3&4) pp: 65-69,(2003).
- J. M. Dobmeier J.M., Furman W. Barton, José P. Gomez, Peter J. Massarelli and Wallace,T. M.. “Final Report on Analytical and Experimental Evaluation of an Aluminum Bridge, “ Turner-Fairbank Structural Laboratory pp:1-30.(2006).
- J. M. and Joris F., “Fire Exposed Aluminum Structures, HERON, 50(4): 261-278.(2005).
- Gitter. R. “Design of Aluminium Structures:Selection of Structural Alloys. Paper Presented at the Workshop in Brussels”:EUROCODES – Background and Applications-AluConsult, Kirchstrasse 19, D78244, Gottmadingen/Germany. Email:gitter.aluconsult@t-online.de ; Corrected and Amended in August 2008, pp: 1-32.(2008).
- Miller. K.J., “Short Fatigue Cracks”. Advanced in Fatigue Science and Technology. (1990).
- Stephens. R.I, Lee H. W., Bu R., and Werner G.K., Fracture Mechanics.Proceedings of the 18th National Symposium on Fracture Mechanics.(1988).
- Rodopoulos. C. A., Delos E.R., “Theoretical analysis on the behavior of short fatigue cracks” , International journal of fatigue,24(7): DOI:10-10161S0142-1123(01)00196-7,PP:719-724.(2002).

This work is licensed under a Creative Commons Attribution 4.0 International License.