R.K. Giri1, Satish Prakash2 and Pooja Rani2
1India Meteorological Department, Lodhi Road, New Delhi - 3, India.
2Department of Physics, Meerut College Meerut-Up - 250 001, India.
DOI : http://dx.doi.org/10.13005/msri/080209
Article Publishing History
Article Received on : 20 Nov 2011
Article Accepted on : 29 Dec 2011
Article Published :
Plagiarism Check: No
Article Metrics
ABSTRACT:
This paper integrates the observations from space borne sensors, namely (Moderate Resolution Infrared Spectroradiometer) MODIS over the Jaipur region, India. Indian Oil Corporation (IOC) depot catches fire on October 29th over Sitapura industrial area in the outskirts of the Jaipur city (26.9 0N /75.8 0E). This anthropogenic activity induces the concentration of atmospheric aerosols even after few days of the events. This was a rare event to study the atmospheric consequences over the vicinity of affected area, using space-based remote-sensing instruments. Present paper discusses the induced aerosol loading (dust loading) and their optical properties derived from MODIS data along with vertical velocity potential from National Centre for Environmental Prediction (NCEP).
KEYWORDS:
Oil fire plume; Atmospheric Optical Depth (AOD); Atmospheric particle and solar radiation
Copy the following to cite this article:
Giri R. K, Prakash S, Rani P. Plume Generated by Oil Depot Fire and Associated AOD Changes. Mat.Sci.Res.India;8(2)
|
Introduction
The interaction of aerosol particles with the radiation is well known and one of the key parameter to understand the scattering /absorption of radiation. This interaction will provide either positive (warming) or negative (cooling) forcing to the environment. Scattered or absorbed radiation within the aerosol population layer when integrated over the beam length gives the Aerosol Optical Depth (AOD). The AOD related to the visibility of the atmosphere. On the clean day, the sun will appear bright in the sky and the AOD will be low. On the polluted day, the sun will seem duller and AOD will be higher. The resident time of most of the air pollutants are short lived and their optical properties changes significantly with time after the event. Due to massive evolution of smoke from the oil depot reduces the visibility significantly over the area. Koschmieder (1924) derived a relationship between the extinction coefficient and meteorological range. R.J. Chairson (1969) developed the relationship between the mass concentration of aerosol and visual range. Sometimes like mineral dusts is a major contributor to the aerosol loading in the troposphere influencing the seasonal variability of the aerosol optical properties and the regional-to-global radiative forcing [Tegen and Lacis, 1996]. Its influence affects cloud microphysical properties and cloud lifetime [Rosenfeld et al., 2001]. The atmospheric column aerosol loading during the pre-monsoon season is highest over the Gangetic plains (GP) on an annual basis [Singh et al., 2004] combined with the heavy anthropogenic pollution concentrated over this region [Singh et al., 2004; Gautam et al., 2007]. Earlier studies done on Kuwait oil file and associated climate change by [Hobbs and Radke, 1992, Herring et al., 1996 and Amin et al., 1994]
Data and Methodology
AOD Data of latitude/longitude steps of 1.0 degree have been taken from the MODIS global web site http://modis.gsfc.nasa.gov. The MODIS instrument is operating on both the Terra and Aqua spacecraft. It has a viewing swath width of 2,330 km and views the entire surface of the Earth every one to two days. The data used in this study were acquired using the GES-DISC Interactive Online Visualization and Analysis Infrastructure (Giovanni) as part of the NASA’s Goddard Earth Sciences (GES) Data and Information Services Center (DISC). The aerosol optical thickness product based on the algorithm given by Kaufman and Tanr, 1998.
Analysis and Discussions
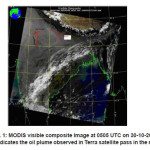
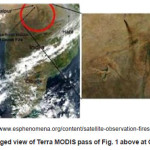
In this article the analysis of the oil depot plume over the outskirt area of Jaipur city is based on the spectral signature seen in the MODIS image. The plume of fire detection strategy is based on detection relative to the thermal emission of surrounding pixels. In this method plume pixels have values elevated above a background thermal emission obtained from the surrounding pixels. This method has limitation for variability of the surface temperature and reflection by sunlight. Visible composite MODIS image of Terra satellite on 30-10-2009 at 0505 UTC is shown in Fig. 1 along with its enlarged view (Fig 2). It is clear from the plume observed in both the figs (1 & 2) the prevailing wind direction was from South-South West, West-West North and in most cases variable at outskirts of Jaipur city. There is haze like situations surrounding the oil depot in Sitapur area and Banas river (Fig 1). The same situations are shown as an enlarged view of the scene seen in the image.
Figure 1: MODIS visible composite Image at 0505 UTC on 30-10-2009 (arrow indicates the oil plume observed in Terra satellite pass in the morning)
Figure 2: Enlarged view of Terra MODIS pass of Fig. 1 above at Oil plume site
Visualization by HYDRA Tool
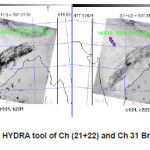
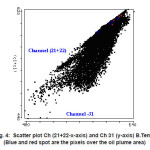
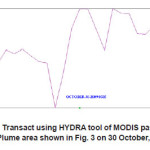
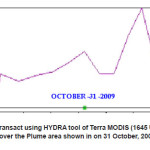
HYperspectral-viewer for Development of Research Applications (HYDRA) is a visualization tool developed by university of Wisconsin, USA (Rink et al, 2005) to inspect the multi-spectral remote sensing data. The MODIS data of 30.11.2009 at 0505 UTC is analyzed with the help of HYDRA tool (Fig 3) as a channel combination tool for T4 (Channel 21 & 22) and T11 (Channel 31) over the affected area marked as blue and red color in the image (Fig 3). These scatter plot by taking brightness temperature of channel 31 on x axis and Channel 22 & 23 on y – axis is shown in the Fig 4. The blue and red dots show the pixels belong to the oil plume region and lies on higher brightness temperature side. The transact plot given in Fig. 5 shows the marked difference of 30 0K surrounding the oil depot area. MODIS Channel 21 saturates at nearly 500 K; channel 22 saturates at 331 K. Since the low-saturation channel is less noisy and has a smaller quantization error, T4 is derived from this channel whenever possible. T11 is computed from the 11-µm channel (channel 31), which saturates at approximately 400 K. The transact of the image on 31.10.2009 at 1645 UTC pass over that area is seen in Fig. 6 and indicates a small range of temperature of 8 oK (578 K-570 K). The same difference noticed on 30.10.2009 was 30 K (Fig 5), it shows that the plume is moved away from that area and temperature is lowered due to the cooling arrangement made to stop the burning of the oil.
Figure 3: Visualization by HYDRA tool of Ch (21+22) and Ch 31 Brightness temperatures
Figure 4: Scatter plot Ch (21+22-x-axis) and Ch 31 (y-axis) B.Temp (Blue and red spot are the pixels over the oil plume area)
Figure 5: Transact using HYDRA tool of MODIS pass over the Plume area shown in Fig. 3 on 30 October, 2009
Figure 6: Transact using HYDRA tool of Terra MODIS (1645 UTC) pass over the Plume area shown in on 31 October, 2009
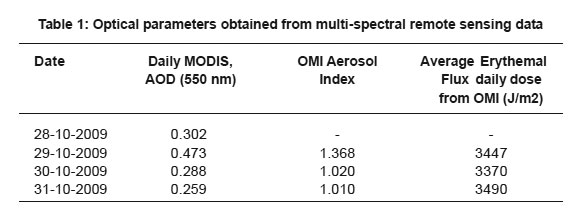
Table 1: Optical parameters obtained from multi-spectral remote sensing data
National Centre of Environment Prediction (NCEP) Derived Vertical Velocity Field
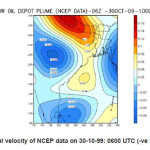
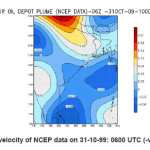
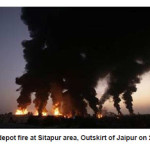
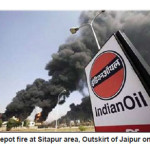
Due to the intense heat of the fire, the plume was highly buoyant and rose rapidly and vertically within the atmosphere. The large amount of vertical wind shear present on 29-10-2009 enabled the height attained by the plume. The negative of vertical velocity field denotes the ascent of the heat, induced pollutant or organic matter over that area. The momentum gained by the plume can be better understood by knowing the nature of the vertical velocity over the area. The pressure vertical velocity (-0.02) is marked by an arrow over that area (Fig 7 & 8). It is clear from the negative value of pressure vertical velocity that there is an upward momentum of the constituents which spread over the area and increase the loading in the atmosphere. The actual images of the plume of fire are shown in the Figs 9 & 10.
Figure 7: Pressure vertical velocity of NCEP data on 30-10-99: 0600 UTC (-ve value indicates ascent)
Figure 8: Pressure vertical velocity of NCEP data on 31-10-99: 0600 UTC (-ve value indicates ascent)
Figure 9: Oil depot fire at Sitapur area, Outskirt of Jaipur on 29-11-2009
Figure 10: Oil depot fire at Sitapur area, Outskirt of Jaipur on 29-11-2009
Aerosol Optical Depth
At very high temperature of oil depot plume it was predicted that all organic chemicals in the fuel would be completely destroyed, leaving few pollutants. The optical parameters like aerosol optical depth (AOD) at 550 nm, aerosol index from ozone monitoring instrument (OMI) and average erythemal flux in J/m2 from OMI are given Table 1. The average value of AOD on 29-10-2009 is increased by 37 % due to aerosol loading produced by the plume of fire. Subsequently AOD decrease on 30.10.2009 and 31.10.2009 due to the migration of the plume materials with the wind. The possible reason is due to the intense heat of the fire; the plume was highly buoyant and rose rapidly and vertically within the atmosphere. The large amount of vertical wind shear present on 29-10-2009 enabled the height attained by the plume. Similar trend is observed in the daily aerosol index obtained from OMI data (Table 1). The average erythemal flux in

from OMI data shown in Table 1 shows the decrease subsequently after 29-10-2009. This may be due to the redistribution of ozone content in the atmosphere, which normally prevents the harmful radiation to reach on the earth. Ozone acts as a protective shield for harmful ultraviolet radiation. The subsequent decrease might shows inability of the prolonged harmful effect of the organic materials produced by the fire plume.
Observations by Central Pollution Control Board (CPCB)
The level of suspended particulate matter (SPM) at the Chokhi Dhani monitoring station on the outskirts of Jaipur was 376 microgrammes per cubic metre of air, while the annual average in a residential area is supposed to be 140, according to CPCB’s ambient air quality standards (http:// www.thaindian.com/newsportal/enviornment/ jaipur-air-poisoned-by-oil-depot-fire-pollution-board_100272132.html).
Concluding Remarks
The present paper discusses the utility of multispectral remote sensing in analyzing the plume observed by the oil depot fire. MODIS imagery data as well as derived optical parameters shows the significant difference during the occurrence of the event.
Acknowledgements
Author is great full for the support of HYDRA team at CIMSS Wisconsin University, U.S.A and the support guidance of the Director General of India Meteorological Department, Lodi Road, New Delhi-3
References
- Amin, M.B, and Husain, T, Kuwaiti oil fires-air quality monitoring. Atmos. Environ. 28: 2261–2276 (1994)
CrossRef
- Charlson, R. J, Environ. Sci. Technol., 3 (10), 913–918 (1969), DOI: 10.1021/ es60033a002
- Gautam, R., N. C. Hsu, M. Kafatos, and S.-C. Tsay, Influences of winter haze on fog/low cloud over the Indo-Gangetic plains, (2007), J. Geophys. Res., 112: D05207, doi:10.1029/ 2005JD007036.
- Hobbs, P.V and Radke, L.F, Airborne studies of the smoke from the Kuwait oil fires. Science. 256: 987–991 (1992).
CrossRef
- Herring, J.A., Ferek, R.J and Hobbs, P.V., “Heterogeneous chemistry in the smoke plume from the 1991 Kuwait oil fires”. J. Geophys. Res. 101: 14,451–14,463 (1996).
CrossRef
- Koschmieder, H.,Theories der horizontalen Sichtweite. Beilr Phys. Atmos., 12: 33-53 (1924).
- Kaufman Y. J. and Tanr., D, Algorithm for remote sensing of aerosol from MODIS. MODIS Algorithm Theoretical Basis Document (1988).
- Rosenfeld, D., Y. Rudich, and R. Lahav, Desert dust suppressing precipitation: A possible desertification feedback loop, Proc. Natl. Acad. Sci. U. S. A., 98: 5975– 5980 (2001).
CrossRef
- Rink, Tom, Whittaker, Tom, Menzel, Paul, Antonelli, Polo and Baggett Baggett, ‘HYDRA (HYperspectral-viewer for Development of Research Applications) , CIMSS, USA (2005).
- Singh R. P., S. Dey, S. N. Tripathi, V. Tare, B. Holben, Variability of aerosol Parameters over Kanpur, northern India, J. Geophys. Res., 109: D23206 (2004), doi:10.1029/ 2004JD004966
- Tegen, I. A., and A. A. Lacis, Modeling of particle sizes distribution and its influence on the radiative properties of mineral dust aerosols, J. Geophys. Res., 101: 19,237– 19,244 (1996). [http://newshopper. sulekha. com/]CrossRef

This work is licensed under a Creative Commons Attribution 4.0 International License.