Mohan L. Verma1 and Nirbhay K. Singh2*
¹Condensed Matter Physics Research Laboratory, Department of Applied Physics Shri Shankaracharya College of Engineering and Technology Junwani, Bhilai - 490 020, India.
²Shri Shankrachayra Institute of Engineering and Technology Khapri, Durg, India.
DOI : http://dx.doi.org/10.13005/msri/090120
Article Publishing History
Article Received on : 21 Jun 2012
Article Accepted on : 23 July 2012
Article Published :
Plagiarism Check: No
Article Metrics
ABSTRACT:
Electrical and electrochemical properties of PEO based hot pressed nanocomposite polymer electrolyte (1-x)[70PEO:30AgI]:xAl2O3 where 0d≤x 10 wt% , have been studied. The conventional Solid Polymer Electrolyte composition (70PEO:30AgI) identified as highest conducting film at room temperature, has been used as 1st phase host matrix and nano-size particle of Al2O3 as 2nd phase dispersion. As a consequence of dispersal of Al2O3 in host, a conductivity enhancement of was achieved in film 93[70PEO:30AgI]:7Al2O3. These composition has been referred to as optimum composing composition. The ion transport behavior in polymer membrane have been discussed on the basis of ionic conductivity(σ), relaxation time (τ), and ionic transferred number(tion). The Impedance Spectroscopic study analysis at different temperature have been carried out to characterize the ion transport mechanism. The temperature dependence conductivity study has also been done to compute the activation energy(Ea) form logσ – 1/T plot.
KEYWORDS:
Hot pressed polymer electrolyte; Ionic conductivity; Activation energy
Copy the following to cite this article:
Mohan L. Verma M. L, Singh N. K. AC Impedance Spectroscopic of Nano Size Al2O3 Filler in PEO:AgI Polymer Electrolyte. Mat.Sci.Res.India;9(1)
|
Copy the following to cite this URL:
Mohan L. Verma M. L, Singh N. K. AC Impedance Spectroscopic of Nano Size Al2O3 Filler in PEO:AgI Polymer Electrolyte. Mat.Sci.Res.India;9(1). Available from: http://www.materialsciencejournal.org/?p=1215
|
Introduction
The ionic conducting Solid Polymer Electrolyte (SPEs) show tremendous technological power sources viz. flexible, compact, light-weight, leak-proof, thin film micro-batteries of desirable shape/size.1-4 The conduction mechanism in polymer electrolyte was reported for the first time in 19735, while the first practical SPE battery based on ‘Poly(ethylene oxide) (PEO)-Li+ -ion salt complex’ was demonstrated in 1979.6 Since then, a wide variety of SPEs, involving different kinds of mobile ions viz. Li+ , H+ , Na+ , K+, Ag+ etc. as principle charge carriers, has been reported. PEO-based polymer electrolyte is one of the most promising materials due to their good mechanical and electrochemical properties. SPEs are prepared usually by solution–cast method. It has been observed in general that the existence of high degree of amorphousity in polymer host(viz.PEO) supports high ionic mobility and hence, high ionic conduction in SPEs. However, the SPE films prepared conventionally be complexing the salts in polymeric host, are found to be less stable mechanically. In a recent investigation, it has been observed that mechanical strength of polymer electrolyte membranes as well as the degree of amorphousity in polymer host could be enhanced substantially by dispersing nano-size particles of an inert/insulating material such as Al2O3 or SiO2 or TiO2 etc.7-12 Such system are referred to as nanocomposite polymer electrolytes(NCPEs). The size of the filler particles plays a significant role in improving these physical properties of SPEs. Very recently, in place of traditional solution casting method, a novel hot- press technique has been developed to prepare SPE membrances.10-14 The present paper report some electrictrical viz. ionic conductivity(s), ionic transference number (tion), relaxation time (t),activation energy (Ea) and electrochemical properties of hot-press synthesized new Ag+ ion conducting nano-composite polymer electrolyte(NCPE) membrane (1-x)[70PEO: 30AgI]: xAl2O3 where 0d³xd³10 wt% using different experimental technique.
Experimental Procedure
In present studies the impedance measurement technique has been employed to evaluate the true bulk conductivity and activation energy of polymer electrolyte film as a function of salt concentration and temperature. The highest conducting composition 70PEO:30AgI taken as based system to study the influence of Al2O3– -as a addition on it. The general formula for SPE system is (1-x)[70PEO:30AgI]:xAl2O3 where 1≤x≤10 wt.(%), AR grade chemicals PEO (6×10⁵ MW, Aldrich, USA,puerty 98%), AgI(purity 98%) and Al2O3 (purity e³99.8%,size <50nm) were used for the synthesis of hot-pressed NSPEs. Dry powder of constituent chemicals in appropriate wt(%) ratio were homogeneously mixed for 10 min. at room temperature then heated separately about 1100C for 20 min. at melting point of PEO and to remove moisture. It result into a soft lump/slurry which was then pressed (~ 2 ton/cm2) between two SS-cold block giving rise to a uniform film. The polymer electrolyte film so obtain sandwiched between fine brass blocking electrode then it placed in a temperature regulated furnace. The impedance and corresponding phase angle θ were measure at different constant temperature for different composition using HIOKI 3532-50 LCR meter over frequency range 50Hz to 5MHz . The value of Bulk resistance Rb determine by Cole-Cole plot from which conductivity is calculated. The activation energy was calculated by the slop of Arrhenius plot. The relaxation time, capacitance and dielectric constant of OCC was calculated by impedance spectroscopic graph at maximum frequency obtain on intersecting point of real and imaginary part of impedance in frequency vs impedance plot. The ionic transference number (tion) were determine by Waganer’s polarization method
Results
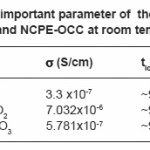
At room temperature measurement values of ionic parameter s, tion, and activation energy Ea of different composition are listed in Table 1.
Table 1: Some important parameter of the hot-pressed SPE host and NCPE-OCC at room temperature
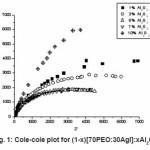
Figure 1: Cole-cole plot for (1-x)[70PEO:30AgI]:xAl2O3
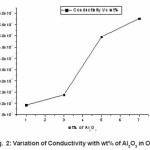
Figure 2: Variation of Conductivity with wt% of Al2O3 in OCC
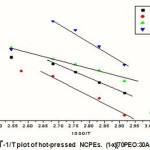
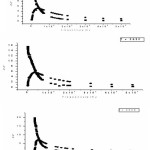
Figure 3: logσ-1/T plot of hot-pressed NCPEs. (1-x)[70PEO:30AgI]:xSiO
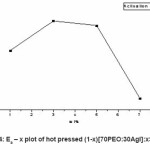
Figure 4: Ea – x plot of hot pressed (1-x)[70PEO:30AgI]:xSiO2
Figure 5: Current versus Time Plot of -70PEO:30AgI ,95(70PEO:30AgI);5SiO-2, 93(70PEO:30AgI);7SiO-2
Figure 6: Variation of Real and Imaginary impedance of NCPE OCC
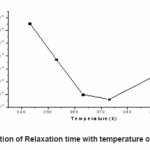
Figure 7: Variation of Relaxation time with temperature of NCPE OCC
Discussion
Ionic Conductivity as a Function of Composition and Temperature
The Cole- Cole plot for different (1- x)[70PEO:30AgI]:xAl2O3 where 0≤x≤10 is shown in Fig.1 which shows variation of real and imaginary part of impedance. The interception of plot on real axis give value of blocking impedance Rb.
By measuring the thickness t, area of sample A, and blocking impedance Rb form experimental Cole-Cole plot the conductivity values can be calculated from the equation,
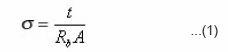
The maximum conductivity was observed at 30 wt.% of AgI. (i.e. for composition 70PEO:30AgI) with conductivity (s ~ 3.3 x10⁻⁷S/cm) and it is used as host for the formation of nano-composite polymer electrolyte(NCPEs). The increase in conductivity is due to increase in degree of amorphisity in the composition. The filler Al2O3 concentration conductivity variation at room temperature for hot press nanocomposite polymer electrolyte(NCPE) membranes (1-x)[70PEO:30AgI]:Al2O3 is shown in Fig.2.
The room temperature conductivity increases initially with increase in nano size filler concentration in SPE host(70PEO:30AgI). The conductivity (σ) maxima were observed at 7 wt% of Al2O3 . Increase in conductivity is due to the increase in degree of amorphicity and creation of additional hopping sites as well as available of more conducting pathways for migration. Knowing the ionic conductivities at different temperature for each composition, the Arrhenius polt can be fitted form which the activation energy calculated. The Arrhenius equation gives the quantitative basis of relationship between the activation energy Ea and the rate at which a reaction proceeds. The Arrhenius equation is
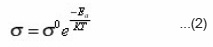
The experimental Arrhenius plot with different wt(%) of Al2O3 in 70PEO:AgI is shown in Fig.3.The variation of activation energy with wt% of Al2O3 is shown in Fig.4.
The lowest activation energy calculated by Aurreheneous plot for the NCPE OCC composition is 0.058eV. The low activation energy of NCPE OCC indicative of relatively easier ion transport in newly synthesis system and hence can potentially used of electrochemical device application.
Ionic transference Number
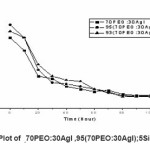
The transference number (tion) were determine by dc-polarization (Waganer’s polarization method).15 The electrolyte sample was sandwiched between two brass blocking electrode and it was polarized by applying the d.c. potential 300 mV. The current response of the cell was measured by digital electrometer. A steady state current reached after ~1.5 hour. The ionic transference number calculated from the polarization current versus time plot (Fig.5) using equation
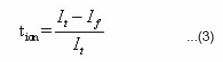
Where Ii is the initial current and If is the final residual current.
The transference number values for all the samples were found to be in the range of 0.95- 0.99, which is close to unity indicate that the electrolyte are principally ionic conductors and that the charge transport is mainly Ag+ ion.
Impedance Spectroscopic Study of Sample
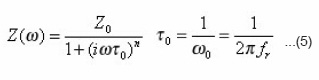
The experimentally measured parallel values of the resistance and the capacitance were converted to their equivalent resistance and are displayed in the form of complex impedance (Z* = Z’ – iZ”) plots.16–19 The complex impedance can be expressed by using the Debye expression.
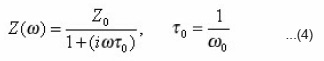
which may be established by considering the specimens, as a parallel circuit of a pure resistor and an ideal capacitor.. The τ0 and ω0 are the relaxation time and the characteristic angular frequency, respectively. The complex impedance can be expressed by introducing a temperature- dependent factor into the Debye expression, i.e., the Cole-Cole expression.16,18
The is the mean relaxation time, and the factor τo n take values over the range 0 <n<1, indicating polydispersive multi-Debye type relaxation. If n is unity, then the relaxation is explained by Debye-type response.17 The real and the imaginary parts of the complex impedance can be rewritten from Eq. (6) in the following forms:
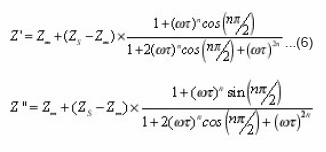
where the Zs and Z0 are the static impedance and the impedance at very high frequencies, respectively.
From the real and the imaginary parts of the impedance relaxation it is observed that at increasing frequency, the real part Z’ decreases while the imaginary parts Z” shows a peakand and with increasing temperature, the impedance peak of the imaginary part is observed and shifts toward the high frequency side.
The complex impedance plot of the 93[70PEO:30AgI]:7Al2O3 exhibits one impedance semicircular arc. Thus, one impedance arc representative of the bulk properties of the grains (dc resistivity). The centers of the impedance semicircular arcs lie below real axis. Thus, the impedance relaxation can be explained by using the Cole-Cole response.16,18
The intercepting point of imaginary and real part corresponds to.20,21
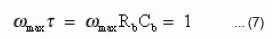
ωmax is the frequency at the maximum of the semicircular arc of cole-cole plot.
Conclusion
A new solid polymer electrolyte membrane (1-x)[70PEO:30AgI]:xAl2O3 with different wt% of Al2O3 has been investigated for the purpose of fabricating solid state thin film electrochemical devices viz. capacitor, batteries. A novel hot-press technique has been used for the film casting. The maximum conductivity of NCPE-OCC obtain at 7% Al2O3 . The ion transport mechanism of NCPE-OCC has been studied in terms of basic ionic parameters σ, Ea, tion , relaxation time τ etc. the impedance spectroscopy study of the NCPE-OCC explain the properties of material with frequency. The very low activation energy of NCPE-OCC shows very good conducting property of electrolyte, the value of tion close to unity shows that the electrolyte is pure ionic. Variation in relaxation time shows increase in velocity of ion in electrolyte with increase in temperature.
References
- Nan C, Fan L, Lin Y & Cai Q, Phys Rev Lett,91: 26 (2033).
- Thokchom J S, Chen C, Abraham K M & Kumar B, Solid State Ionics, 176 (2005).
- Armand T Reddy M J & Rao UVS, J of Power Source, 268: 93 (2005).
- Shreekanth T, Reddy, Annu Rev Matter Sci, Mater soc. 345 (1986).
- Fenton D E, Parker J M & Wrigth P V, Polymer,14: 589 (1973).
CrossRef
- Armand M P, et.al. Fast Ion Transport in solid (EDs) North Holland, 131 (1979).
- Chung N K, Kwon Y D & Kim D, J Power Source, 124: 128 (2003).
CrossRef
- Chandra Angesh et.al. Hot-Pressed polymer electrolyte, (Lanbert Academic Pub. Bermany) (2010).
- Pandey G P, Kumar Y & Hasmi S A, Indian J Chemistry, 49: 743 (2010).
- Appetecchi G B, Croce F, Hasson, et.al., J Power Sources, 114: 105 (2003).
CrossRef
- Crpce F, Settimi L, Scrosati B,Electrochemistry Commu, 8: 346 (2006).
- Agrwal R C, Chandra A, Bhatt A & Mahipal Y K, New J Physics 42: 135 (2009).
- Chandra A, Agrwal R C, Mahipal Y K, J Physics D Applied Physics 42: 135 (2009).
- Chandra A , Dur Phys J Appl Phys, 50: 21101 (2010).
- Wagner, J.B.; and Wagner, C. Journal of Chemical Physics, 26(6): 1597-1601.
CrossRef
- R. C. Agrawal, Y. K. Mahipal Int. J. Electrochem. Sci., 867-881 (2011).
- R. C. Agrawal,et.al.(Series Eds.). 3: 231.(2009).
- C. D. Robitaille, D. Fauteax, J. Electrochem. Soc., 315-325(1986).
CrossRef
- D. Golodnitsky et al. J. Electrochem. Soc., 3484-3491(1997).
CrossRef
- Y. Tominaga, N. Takizawa, H. Ohno,Electrochim. Acta, 45: 1285-1289 (2000).
CrossRef
- F. M. Gray, Polymer Electrolytes, The Royal Society of Chemistry, Cambridge (1997).

This work is licensed under a Creative Commons Attribution 4.0 International License.