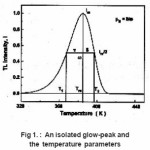
Thermoluminescence (TL) appears when a solid sample (usually an insulator or semiconductor )is heated after being irradiated ata low temperature T0. Part of the energy absorbed by the sample in course of irradiation may be released during heating. Thermoluminescence has found important application in dating and dosimetry. The rigorous theory of thermoluminescence is very complicated. The most popular model of thermoluminescence (TL) is the three parameter model suggested by Halperin and Braner1 and later developed by Chen et al.2 In three-parameter model, TL is described by the parameters namely activationenergy ( E ), order of kinetics ( b ) and frequency factor ( s ). There are a number of methods for the determination of activation energy (E) , such as peak shape, initial rise , various heating rates method etc. Out of these methods peak shape method probably is the simplest because in peak shape method activation energy (E) can be determined by knowing only two or three characteristic temperatures of the peak . In this paper we present a review of the peak shape method for the determination of activation energy of a TL peak The geometrical shape of a TL-glow peak plays an important role in TL applications . It is an important and convenient method for calculating the trapping parameters of distinct energy levels within the crystal . This method is based on measurements of a few points on the glow peak as shown in Fig. 1
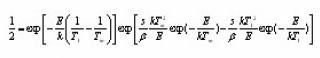
The integrals in the brackets can be resolved by asymptotic expansion. By dropping terms after the first in series, expression (3) changes in the following :
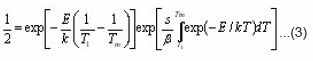
Doing logarithm and rearranging and then applying the maximum conditions one obtains
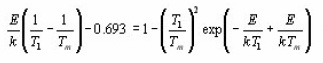
larger than 20, the exponential of the last expression becomes equal to 0.184. Furthermore, the term
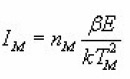
Using condition at maximum i.e. ,
where
with the approximation
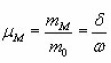
Here

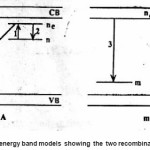
n0 and mo being the concentration of electron and holes at time A probability of recombination

s being the frequency factor In the second process , it is given by
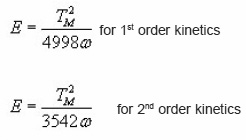
has different value for first order and second order according to the following expressions :
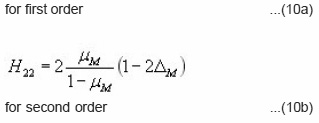
Halperin and Braner also gave a very easy way to decide the type of kinetics involved in the process.
for first order and

for second order
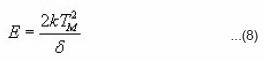
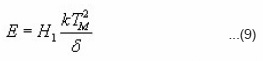
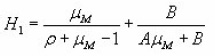
Equation (9) can be changed by introducing
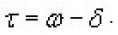
It is very useful because if it is very easy to eliminate any interfering glow peak appearing at the low temperature side, it is impossible to eliminate shouldering peaks at high temperature side of the observed peak. Therefore equation (9) becomes
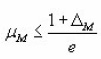
The equations of Halperin and Braner require iterative process to find owing to the presence of ΔM. To overcome this difficulty a new approximated method was proposed by Chen.
Keating,8 following Bemski9 and Lax10 introduced the possibility of temperature dependent frequency factor s+soTa where -2≤a≤2. For all values of, Keating gave the following formula for first order peaks :
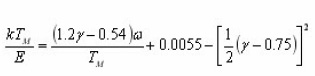
from which can be calculated. In this formula. The formula is reported to hold true for 0.75<<0.9 and

Chen6 ummerised all the pre-existing methods and gave a detailed methodology for deriving the coefficients for the first and second order kinetics. He derived expressions for evaluating E using numerical approximations. Chen method is useful for a broad range of energies ranging between o.1eVto 2.0eV and pre- exponential factor between 1015sec-1 and 1013sec-1. It does not make any use of iterative procedure.
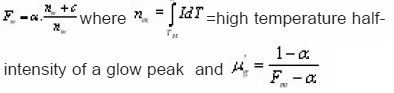
Furthermore, the procedure does not use any knowledge of the kinetics order which is found using directly symmetry factor µg from the peak shape. He used total half-width peak method to find Ew, high temperature side half peak to find Ed and low temperature side half peak to find Et.
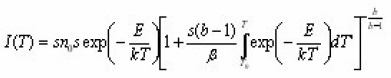
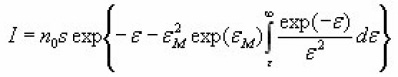
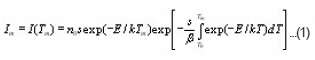
He started from the first order equation , giving TL intensity as a function of the temperature,
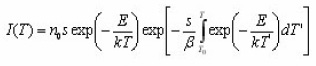
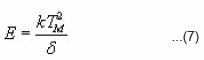
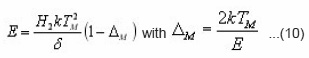
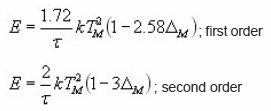
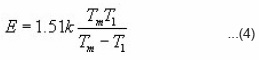
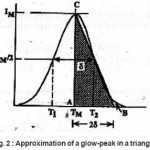
At, the expression of is obtained. The integral on the R.H.S can be approximated by means of an asymptotic expansion and a reasonable approximation is accepted. Using the assumption of Lushchik5 that the area of the second half of the peak is equal to that of a triangle having the same height and half-width, he reached to the expression of activation energy for first order kinetics as
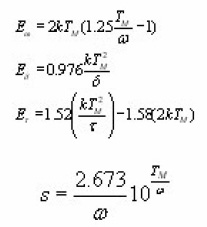
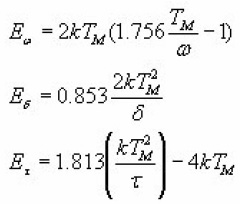
For second order kinetics the activation energy forms are
In the literature , there are plenty of reported cases of non-integer values of b, the order of kinetics. Chen7 gave a method of calculating the activation for non-integer values of b (GO). He started from the general order equation proposed by May and Patridge
The equation was rearranged using condition at the maximum and then solved numerically by approximating the integral by a certain number of terms of the asymptotic series and using the iterative Newton-Raphson method. The Chen’s method consists of finding the temperature at the maximum TM , , by computer is calculations. He used

and ß=0.5 Ks. Once the value of is found, the intensity can be found by inserting the temperature at the maximum, in the previous equation and using again asymptotic series. The values of , the low and half temperature intensity, can be calculated by solving numerically the equation

Using the asymptotic series for the integral approximation ,Chen found

After that the geometrical parameters of the peak i.e.

are found.
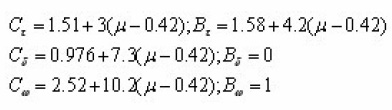
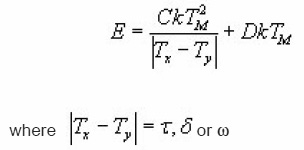
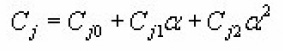
Interpolating and extrapolating the constants appearing in the equations for the 1st and 2nd order, Chen gave a general expression which summarises all the previously given expressions . The equations can be summed up as
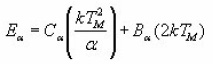
Where α is τ, δ or ω.
The values of Ca and Da are summarised as below :
With μg =0.42 for 1st order
And μg=0.52 for 2nd order
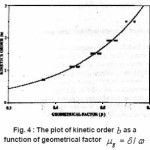
Chen found that the order of kinetics b is a monotonic function of shape factor µg=δ/ω. Chen calculated µg (ranging from 0.36 to 0.55) for various values of ranging from 0.7 to 2.5 and presented a graphical relation between b and µg (Fig. 4 ). This provided a simple method by which can be determined from a measured value of µg.
Figure 4 : The plot of kinetic order b as a function of geometrical factor
Balarin11 deduced some expressions for determining the activation energy based on the quantity ω=T1-T2 for 1st and 2nd order kinetics. He obtained the following relations :
According to Balarin, the previous expressions allow to determine the activation energy values accurately to within 0.5%. The experimental inaccuracy in the determination of w then becomes dominant and limiting.
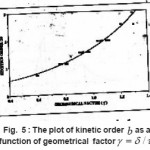
Balarin also proposed a graph which gives the kinetic order as a function of γ=(δ/τ) (Fig. 5)
Figure 5 : The plot of kinetic order b as a function of geometrical factor
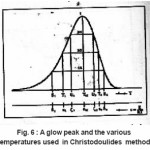
Christodoulides12 developed some expressions for the determination of the activation energy, E, of a first order peak using the widths or half-widths of the peaks. These widths corresponds to temperatures at which the signal level is 1/4 , 1/ 2 or 3/4 of the peak height, on both sides of the peak temperature at the maximum TM, Fig. 6 shows the various temperatures previously defined The expressions are valid in the region of E/KTM values 10 and 100 . Using the 1st order kinetic equation giving the variation of height intensity with temperature , and inserting it in the equation of the maximum , for a constant heating rate , one gets the following expressions in terms of the variable ε=E/KT and its value at the peak maximum εM=E/KT.
Figure 6 : A glow peak and the various temperatures used in Christodoulides method
The integral can be expressed in terms of the second exponential integral 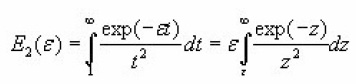
So the former equation becomes
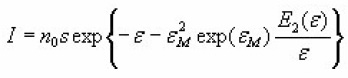
which has a maximum value,for ε = εM ,equal to
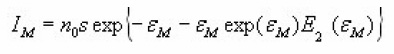
And finally,
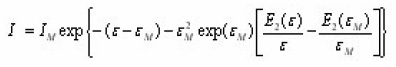
which gives the signal output I as a function of e for a TL peak of given IM and εM.For a given value of Em,the ratio I / IM depends only on εM. An iteration procedure is needed to solve the above equation because one must be sure about the convergence of the procedure itself. This is done using as a starting value of
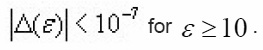
ForT<TM i.e.ε>M and i.e. ε>εM two different expressions of are obtained.In those expressions,a rational approximation may be used for the transcendental function Such an expression is ,
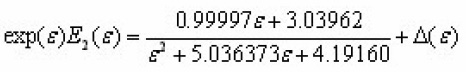
Where
Simple linear relations can then be searched for connecting pairs of the quantities (ε1,εm),(ε2,εm),(ε1,ε2),(δ1εm),(δ2εm),(δ1δ2),(δ1ξ1) and (δ2ξ2). Similar expressions are also given which allows to know the width of a peak whose E and TM are known.
Mazumdar et al13 (1988) extended the work of Christodoulides on peak shape method following general order kinetics . To construct a new set of expressions , they involved temperatures where intensity is 1/2 , 2/3 and 4/5 of the maximum. The authors claim that the selection of these points is based on the fact that the upper half of the peak, in general , is expected to be free from interference from satellite peaks.
They also started from the well-known GO equation and calculated

(for ) and (for ). However , their expressions are not valid for b=1 . For a given value of the ratio I/IM the corresponding values of and are then determined using the same iteration procedure followed by Christodoulides, taking starting value of ε.
Now if i and j denotes the intensity ratios, the expression for the activation energy can be written as
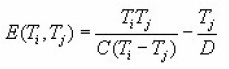
where Ti and Tj are the temperatures at a given ratio at the falling and the rising side respectively of the peak. The values of the coefficients C and D are listed by Mazumdar et al., (1988) .
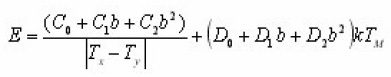
With prior knowledge of b, a new set of expressions for GO kinetics was presented by Gartia et al.14 The mathematical procedure is similar to that given by Mazumdar et al.13 Using equations for b=1 [Christodoulides12] and [Mazumdar et al13] , applying iterative method , it is possible to write the following expression for activation energy.
The coefficients C and D are found using the method of least square for different order of kinetics b in the range from 0.7 to 2.5 and for x=1/ 2,2/3 and 4/5. For a particular value of x the coefficients result to be dependent on and then can be expressed as a quadratic function of b itself . So that the previous equations can be rewritten as
The authors claims the validity and the superiority of their method in comparison to those of Chen. Indeed the E
values obtained by using expressions for x=1/2 are more accurate than those of Chen . Furthermore , it is pointed out that Ex,Eτand Eω are in excellent agreement among themselves , whereas Chen’s value for Eδ and Eω yield poor results .
After the Chen’s work,7 the graphical picture of the dependence of symmetry factor µgon b has been utilized to determine easily the order of kinetics. The order of kinetics still remains a topic of controversy and a matter of debate. For a given value of b, μg, is not unique. It is dependent on and. For a given value of b, µg, and for extreme values of E and s, the maximum deviation in μg can be as high as 7%. Therefore without an a priori knowledge of E and s, absolute determination of b from the value of μg is not possible. The treatment given by Gartia et al allows to find a general expression for µg considering any position selected on the glow peak, in terms of the variable u=E/KT and its value at peak uM=E/KTM.
Recently study of Kitis and Pagonis15 led to new insights as to the meaning of the coefficients used in Chen’s original equation. Although Chen’s GO kinetics expression (in fact approximations) proved to be very accurate in practice, it did not have any theoretical basis before . Moreover , in the final expression of E, the characteristic parameter b was absent. Kitis and Pagonis theoretical foundation to the peak shape method coefficients as a function of b. They deduced the equations :
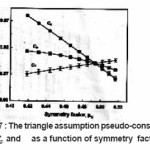
Cω,Cδ and CI are respective triangle assumption pseudo-constants which was evaluated by simulation. The numerical simulation of synthetic glow- peaks was performed by using very broad regions of the trapping parameters( E ranging from 0.7eV to 2 eV , s ranging from 107 sec-1 and 1020 sec-1, b ranging from 1.1 to 2 ) in order to cover as many practical cases as possible. Fig. 7 shows the behavior of the pseudo-constants Cω,Cδ and Cx as a function of the symmetry factor .
Figure 7 : The triangle assumption pseudo-constants Cω Cδ and as a function of symmetry factor
The correctness of their equation was ensured by getting output activation energy values coinciding with the input ones. The errors of the peak shape method were studied in details. They also described the error evaluation procedure , which allows one to gain all the benefits of the peak shape method when they are applied to experimental results. A scope for further improvement of the accuracy of the evaluation of the activation energy is there.
Due to lack of physical basis of the most widely used GO model, Mixed order kinetics model was developed by Chen et al2 using a set of three differential equations formerly used by Halperin and Braner.1 Yossian and Horowitz16 (1997) have successfully applied MO kinetics both to the synthetic glow-peaks and to isolated peak 5 in TLD- 100 following post -irradiation annealing at 1650C and commented that MO kinetics is a viable alternative to GO kinetics in the intermediate range(1<b<2). Chen et al have shown the variation of μg with
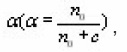
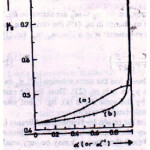
where c is the concentration of trapped electrons or holes not taking part in the TL process in the temperature range considered due their being in deep traps or in low probability recombination centers by choosing a certain value of uM(=E/KTM) They also reported that the shape of MO TL peak depends strongly on α(0≤α≤1) and a very weak function uM. They presented a graphical picture (Fig.8) of the variation of μg with. From that one can estimate the value of of an experimental TL peak by knowing the value of µg.
Singh et al.,17 took into account the dependence of μg on in obtaining the value of α from µg vs α. curve by taking average of μg for different values of uM (20≤uM≤40).They presented a set of peak shape formula involving a for determination of activation energy unlike those of Chen(1969). They evaluated
Figure 8: (a) Geometrical symmetry factor & (b) integral symmetry factor μg as a function of α
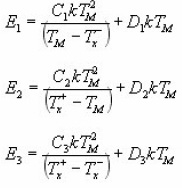
are the temperatures on the rising side
and falling side
of TL peaks at fractional intensity.
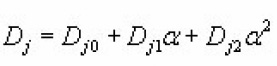
The coefficients Cj and Dj ( j=1→3) for a particular value of x depends on a. Using method of non-linear regression they expressed Cj and Dj as quadratic function of α as
The coefficients Cfor x=0.2 , 0.5 , 0.8 are tabulated by Singh et al.,(1998).
Singh et al.,18 introduced filling factor

n0being the initial concentration of trapped electrons and being the concentration of the electron trap site) in the MO equations.
Sunta et al.,19 (2002) tested the capability of MO and GO kinetics to it synthetic glow-peak derived from various phenomenological models such as one -trap-one -recombination center model (OTOR), non-interactive multi-trap system (NMTS) and interactive multi-trap system( IMTS ) . They found that the MO kinetics model fits the NTMS and IMTS glow -peaks much more successfully than the GO kinetics . On the other hand, the MO fits poorly the TL peaks produced by the OTOR model. They attributed to this result to the fact that the OTOR model is too simple and physically unrealistic.
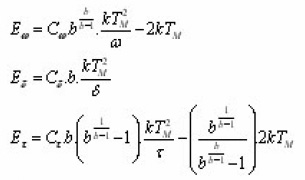
Kitis et al.,20 (2008) obtained new peak shape methods for evaluating the activation energy based on MO. They deduced the expression of the pseudo constants Cω,Cδ and Cx as a function of. Consequently, activation
energies are :
The numerical simulation of synthetic glow peak was performed by using very broad regions of the trapping parameters

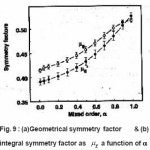
in order to cover as many practical cases as possible. From the simulated synthetic glow peaks both geometrical symmetry factor µg and integral symmetry factor µg were evaluated. Their behavior as a function of α is shown in Fig. 9 .
Figure 9 : (a) Geometrical symmetry factor & (b) integral symmetry factor as μg a function of α
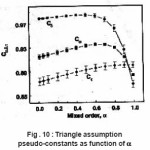
μg is saturated for a beyond 0.9 whereas the µg is not. The behavior of Cω,Cδ and Cτ obtained from the simulation is shown in Fig. 10. The error in all the activation energy is 1.5% when the slight dependence of the coefficients are taken into account and 3.5% when it is not. They further concluded that the term

present in all the activation energy value terms, called bmix have a role in the MO kinetics similar to the kinetic order b of GO kinetics.
Sunta et al21 has found some limitations of GO peak -fitting and peak-shape methods for determining the activation energy of the TL glow peaks in the cases in which retrapping probability is much higher than the recombination probability and the traps are filled up to near saturation level . Right values can be obtained when the trap occupancy is reduced by using small doses or by post-irradiation partial bleaching . They recommended that this method of activation energy determination should be applied only at doses well below the saturation dose.
Figure 10 : Triangle assumption pseudo-constants as function of α
In the present paper we have reviewed different variants of peak shape (PS) method. Normally the peak shape method is suitable for single and isolated glow peaks but the availability of peak shape expressions for arbitrary intensity ratios such as 1/4, 2/3 or 4/5 makes possible investigators to use the peak shape formulas even if one side (rising or falling ) of the peak is clean as reported by Gartia et al.,.22
References
- Halperin, A. and Braner, A.A. : Phys. Rev. ,117: 408 (1960).
CrossRef
- Chen, R. , Kristianpoller , N., Davidson, Z. and. Visovekas , R.: J. Lum. , 23: 293 (1981).
CrossRef
- Grossweiner , L.I. : J. Appl. Phys., 24 : 1306 (1953).
CrossRef
- Dussel, G. A. and Bube , R. H.: Phys. Rev. ,155: 764 (1967) .
CrossRef
- Lushchik,, L.I. : Sov. Phys. JETP , 3 :390(1956).
- Chen , R. : J. Appl. Phys. , 40 : 570 (1969).
CrossRef
- Chen , R.: J .Electrochem. Soc. , 116 : 1254 (1970) .
CrossRef
- Keating, P.N. : Proc.Phys. Soc. , 78 : 1408 (1961).
CrossRef
- Bemski , G. : Phys. Rev. ,111 : 1515 (1958).
CrossRef
- Lax , M.: Phys. Rev. , 119 : 1502 (1960).
CrossRef
- Balarin, M. : Phys. Stat. Sol.(a) , 31 :K111( 1975).
CrossRef
- Christodoulides , C.: J. Phys D : Appl. Phys.,18 :1501 (1985).
CrossRef
- Mazumdar, P.S. , Singh, S.J.and Gartia, R.K.:J. Phys D : Appl. Phys , 21 : 815 (1988).
CrossRef
- Gartia , R. K. , Singh, S.J. and Mazumdar, P.S.: Phys. Stat. Sol.(a) , 114: 407 (1989).
CrossRef
- Kitis, G. and Pagonis, V. : Nucl.Inst.and Meth.In Phys. Res. B ,262: 313 (2007).
- Yossian, D. and Horowitz, Y.S.: Radn. Meas., 27: 465 (1997) .
CrossRef
- Singh, S.D. , Singh, W.S. and. Mazumdar , P.S.: Indian J. Phys.,72 A: 233 (1998)..
- Singh , W.S., Singh, S.D. and Mazumdar, P.S.: J Phys. Codens Matter ,10: 4937 (1998) .
CrossRef
- Sunta, C. M. , Ayta, W.E.F. , Chubaci, J.F.D. and Watanabe , S. : Radiat. Meas. , 35: 595 (2002).
CrossRef
- Kitis, G. , Chen, R. and Pagonis , V.: Phys. Stat. Sol(a) , 205 : 1181( 2008).
CrossRef
- Sunta, C. M. , Ayta, W.E.F. , Piters, T. M. and Watanabe, S.: Radn. Meas. , 30:197(1999)
CrossRef
- Gartia, R.K. and Singh, L.L. : Radn. Meas.,46: 664 (2011).
CrossRef


 ,
,