I. Nawaz
Department of Mechanical Engineering, Faculty of Engineering and Technology, Jamia Millia Islamia, Jamianagar, New Delhi - 110 025 (India).
DOI : http://dx.doi.org/10.13005/msri/090103
Article Publishing History
Article Received on : 09 May 2012
Article Accepted on : 28 Jun 2012
Article Published :
Plagiarism Check: Yes
Article Metrics
ABSTRACT:
Every observable movement involves energy. Hence, energy is obviously an important determinant in the development of a nation. To be specific, the standard of living is directly related to the per capita energy consumption in the region. The per capita energy consumption is mostly due to consumption of electricity. Therefore, electric power is one of the key factors in development of a country. The combined effect of population growth and increase in industrial, domestic and agricultural activities are inevitable and the basic reason for the increase in the worldwide energy demand. Particularly in the Indian context, the power demand is likely to increase by 7% per annum in the next few decades; assuming a GDP growth of 9%. The major resources of electricity generation are the conventional fossil fuels: coal, oil and natural gas. At present, 55% of electricity generated in India is from coal. However, use of coal for electricity generation results in increase of CO2 concentration in atmosphere. In this study, an attempt has been made to estimate the increase in CO2 emission on the basis of statistical analysis using the available data of power production and projected population growth.
KEYWORDS:
Per capita energy consumption; Development; Power demand; CO2 emissions; Population growth
Copy the following to cite this article:
Nawaz I. Projection of Carbon Dioxide (CO2) Emissions in Coming Decades in Indian Context
|
Introduction
Energy plays a vital role in the social, economic, industrial and agricultural growth and comprehensive development of a country. World wide per capita energy consumption is increasing due to rapid industrialization, urbanization and growth in transport and service sector. There is a need to maintain a balance between power generation and environmental health. Power production through fossil fuels particularly coal often leads to environmental pollution. Electricity produced from coal emits CO2 gas at an average rate of 0.98 kg/kWh [1]. It is estimated that 55% electricity generated is from coal based thermal power plants. The combustion of coal in thermal power plants is a major cause of increase in the CO2 concentration levels in the atmosphere2. 41% share of all emissions is from coal generated electricity3. Several studies have shown that plants tend to grow faster in a CO2 enriched atmosphere, but this benefit is offset by denudation of forests leading to decreasing nature’s ability to remove atmospheric CO2. Currently, the CO2 concentration in the air is 392 ppm with an average annual growth rate about 0.74 ppm4. Energy consumption per capita per annum in India is 779 kWh, in China it is 2,741 kWh and the world average is 2,782 kWh 5. If it is assumed that annual energy consumption per capita annual in India is 1000 kWh as per Government of India Target Mission: ‘POWER for All by 2012’ [6] then to fulfill this requirement more electricity is to be generated and consequently emission of CO2 will increase. Already an increase in the concentration of atmospheric CO2 from 280 ppm in nineteenth century to present level of 392 ppm has been observed4. If the present trend of power generation continues, it has been estimated that the atmospheric CO2 will be around 550 ppm by 2050 7.
Sources of CO2 emission
CO2 emission arises by two factors namely; a. Natural sources include: volcanic out gassing, the combustion and decaying of organic matter and also the respiration process of living aerobic organisms and b. Man-made sources include: the burning of fossil fuels, for heating, power generation, transport, industrial processes, domestic activities and agriculture as well as deforestation and other sources. They have greatly increased CO2 concentration in atmosphere. In this study, CO2 emission only through coal-based thermal power plants is considered.
Prediction of CO2 emission for coming decades
On the basis of “best parabolic fit” we can predict the population, electricity demand as well as CO2 emissions from coal-based power plants for the next few decades in India.
P = az2 + bz + c (1)
where, P denotes the expected population and z denotes the year. The regression equation for population growth is given by [8].
P = 0.124z2 + 6.64z + 353 (2)
where, z = Year-1950
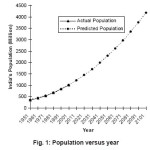
Equation (2) has been computed up to the end of 21st century of India is shown in Figure (1).
Methodology
Equations (1) and (2) have been used to estimate the population growth as shown in Figure (1). The power demand is expected to be proportional to population. Following assumptions have been made:
- Migration of CO2 emitted in India has not been allowed to other countries and vice versa for Indian context;
- Yearly CO2 emitted by thermal power plants is uniformly distributed in atmosphere (no stratification of CO2 in the atmosphere) 11- km above mean sea level [9];
- 50% of yearly CO2 emitted is absorbed by photosynthesis and sea surface [10];
- Electrical energy produces 0.98 kg /kWh of CO2 in the atmosphere from coal [1].
Power demand up to 2100
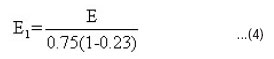
The electric power generated at the generation end does not completely reach to the consumer end. Rather only a part of it is able to arrive at the consumer end. If the energy consumption per capita (E) is known, the actual power generation per capita (E1) required, can be estimated as;
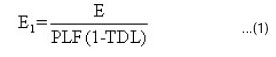
Energy is expressed in kWh and the power generation capacity of plants is expressed in MW, (1kWh is equivalent to 0.114 MW). Considering plant load factor (PLF) 75% [10] and Transmission & distribution losses (TDL) 23% [11], the actual power generation per capita can be estimated as;
Similarly, the actual power generation (E2) for whole population (P) for India can be expressed as;
E2 = E1×P (5)
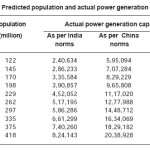
Using the Equations (2) and (5), the predicted population and actual power generation capacity is given in Table 1.
CO2 emissions
As mentioned earlier that 55% electricity generated from coal based power plants. So, we calculate 55% of column 3, 4 and 5 respectively
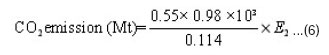
Scientists believe that 50% of yearly CO2 emitted is absorbed by plants and oceans10.
The net CO2 emission (Mt) = 0.5×(expression of Equation 6) …(7) Where Mt = million ton
Results
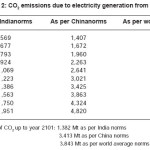
Table (2) shows the net CO2 emissions due to electricity generation from coal based thermal power plants of present century in India.
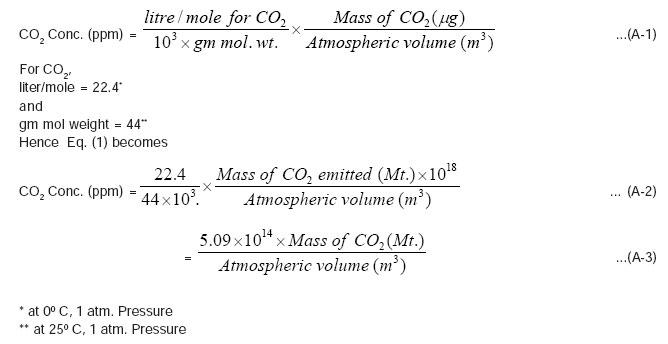
CO2 Concentration (ppm): In Indian context
The geographical area of India is known to be 32, 87,263 km2 [12]. Assuming height of atmosphere to be 11 km, above mean sea level9,
the atmospheric value above the territory of India is;
3.29×11×1015 m3
The CO2 concentration is expected to increase with CO2 emissions from coal burnt for electricity generation. The ppm value is related to the mass of CO2 emitted according to the following equation [13].
Table 1: Predicted population and actual power generation capacity
Table 2: CO2 emissions due to electricity generation from coal
![The CO2 concentration is expected to increase with CO2 emissions from coal burnt for electricity generation. The ppm value is related to the mass of CO2 emitted according to the following equation [13].](http://www.materialsciencejournal.org/wp-content/uploads/2012/06/Vol09_No1_Pro_Naw_F8.jpg)
The annual net increase of CO2 concentration has been evaluated by using the following expression.
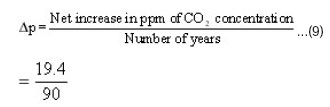
= 0.216 ppm per year (as per India norms)
Effects of CO2
It is a well known fact that carbon dioxide is a green house gas whose increased concentration is a possible outcome of global warming. The global warming will increase with time, and could have disastrous consequences.
These might include;
- Sea level rise
- Negative impact on agricultural productivity
- Spread of diseases
- Change in ecosystem
- Climate change
- Significant change in the world’s rainfall pattern
- Rise in global temperature
- Increased extreme weather
The average global temperature has increased by more than 0.70C over the past century, and the present warming rate is 0.20C per decade. If continued, this trend will lead to a temperature rise of about 30C by the end of this century [6]. However, it is certain that the dynamic equilibrium among the major CO2 reservoirs of the biosphere has been disturbed, and the effects of such disastrous are a matter of considerable and immediate concern.
Environmental Implications
The necessity of burning fossil fuels like coal, oil and natural gas, has caused a substantial modification in the environment. The most serious consequence of the current combustion level is atmospheric pollution. The primary problem involves CO2 levels in the atmosphere, which have risen from 280 ppm, in pre-industrial era up to the current 392 ppm, a value that is still climbing. It is an stoichiometric function of the fuel burned. The “green house effect” which was a matter of expert
study some 30-40 years ago, is now part of the daily human experience. Smog and the change of climate, it may be argued, are also common occurrences now.
Figure 1: Population versus year
Remedial measures
Since power is and has always been an essential part of human life, we cannot possibly reduce the power requirement. Hence, there is a strong need to control the increase of CO2 concentration in atmosphere by
a) Control of the population growth
b) Plantation of more trees
c) Reduction of dependency on fossil fuels
d) Development of alternative fuel such as
hydrogen
e) Search for alternative sources of energy and
f) Greater role of renewable energy sources.
All these measures become important. A balance must be maintained between human activities and environmental health. The last two suggestions in the above list deserve particular attention.
Appendix-1
Conversion of μg/m3 to ppm
The concentration of a pollutant is customarily expressed in volumetric terms. At present, gaseous concentration are expressed with mixed units of mass per unit volume such as μg/m3. The relationship between ppm (by volume) and μg/m3 depends on the density of the pollutant, which, in turn depends on its pressure and temperature as well as its molecular weight (mol wt). Thus one can write:
Conclusion
The Equation (8) shows the net increase of CO2 concentration 19.4 ppm due to power generation only from coal. The annual net increase of CO2 is 0.216 ppm as per India’s energy consumption norms. However, the CO2 emission from India is only about 4% of the global emission. On the bases of the current energy mix and present day technologies for electricity generation the CO2 emission from India alone could become as much as half of the present of global emission in a few decades from now. It is apparent that CO2 emission in atmosphere is unavoidable. Further it is increasing steadily with population and the increasing energy demand. There is a strong need for greater role of renewable energy in particular of solar energy, wind energy and hydro electric power. They do not emit CO2. A simultaneously proper policy regarding population growth and growth of more trees is indicated. These measures are obvious but have been largely ignored by policy planners. In view of the possibility of irreversible damage to the environment, wakeup call has become necessary. Greater public awareness would lead to better planning which is urgently needed.
References
- Watt M., Johnson a., Ellis M. and Quthred H. Life cycle air emission from PV power system. Progress in Photovoltaic: Research Application 1998.
- Power sector at a glance All India. http:// www.powermin.nic.in indian_electricity_ scenario/introduction.htm
- IEA statistics, International Energy Agency (IEA),CO2 emission from coal combustion, Highlights-2011,Edition. http://www.iea.org/ co2highlights/co2highlights.pdf.
- Trends in atmospheric carbon dioxide- NOAA. Earth System Research Laboratory. Global Monitoring Division, Mauna Loa, Hawai. http;//www.esrl.noaa.gov/ghg/ccgg/ trends/
- Bihar use least power, Delhi the most-Bihar Times http://www.bihartimes.in/Newsbihar/ 2011/Aug/newsbihar15Aug/html
- 14th International Exhibition & Conference “power India 2012”, Bombay Exhibition Centre, Goregaon, Mumbai, India. http://www. Indiapowershow.com/
- 7. 3 Degree opf warming-Global warming. http:/ /www. g l o b a l – gr e e n h o u s e. c o m / 3 – degree.html
- Nawaz I., Khan R. A., Khan M. Emran and Tiwari G. N. optimization of clean environment parameters through renewable energy sources. Int. Journal of Ambient Energy, Ambient Press Ltd. 24(3): 67-74 (2003).
- The Earth’s atmosphere. Clouds R vUs.com- Weather Features http://www.rch27.dial. pipex.com/cloudsrus/atmosphere.html
- All India plant load factor. http:// www.cea.nic.in/reports/monthly/executive_ rep/jul11/7.pdf.
- Transmission and distribution losses (power) http://www.teriin.org/upfiles/pub/ papers/ft33.pdf
- Geographical Area of India http://www.thecoloursofindia.com
- Rao C.S. Environmental Pollution Control Engineering. Wiley Easter Ltd. New Delhi, p 30-35 (1999).

This work is licensed under a Creative Commons Attribution 4.0 International License.