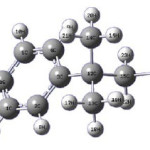
Vibrational Spectroscopic and First Hyperpolarizability Study of 1-chloro-2-methyl-2-phenylpropane
¹Department of Physics, TKM College of Arts and Science, Kollam, Kerala, India.
²Department of Physics, Fatima Mata National College, Kollam, Kerala, India.
DOI : http://dx.doi.org/10.13005/msri/090123
Download this article as:
![]()
FTIR and FT-Raman spectrum of 1-chloro-2-methyl-2-phenylpropane were recorded and analyzed. The vibrational wavenumbers were examined theoretically using the Gaussian03 set of quantum chemistry codes. The experimental frequencies are in agreement with the calculated (B3LYP) scaled values. The predicted infrared intensities, Raman activities and first hyperpolarizability are reported.
KEYWORDS:DFT; Propane; Hyperpolarizability; FTIR; FT-Raman
Introduction
Cumene is the common name for isopropylbenzene, an organic compound that is an aromatic hydrocarbon. It is a constituent of crude oil and refined fuels. It is a flammable colorless liquid that has a boiling point of 152°C. Nearly all the cumene that is produced as a pure compound on an industrial scale is converted to cumene hydroperoxide, which is an intermediate in the synthesis of other industrially important chemicals, primarily phenol and acetone. Wood lignin’s heterogeneous structure consists not only of inter phenyl propane unit linakages of carbon to carbon and carbon to oxygen but also of side chains with various substituent and functional groups. The resin based dental polymers of phenyl propane derivatives have been investigated with the reinforcing effect of electrospun nylon nanofibres.1 It was found that the fibres have a crystalline structure and are mechanically strong. The small diameter of nanofibres also provide a high ratio of surface area to volume, which could enhance the intermolecular hydrogen bonding between the filler of nylon nanofibres and the matrix of resin polymers. Dauban et al.,2 reported the synthesis of phenylpropane derivatives and its calcimimetics properties. Blends of phenylpropane derivatives have been widely investigated because of the theoretical and practical importance of these high performance polymers.3 From the the very initial studies, it was claimed that miscibility occurs a wide composition range, as the blends displayed single intermediate glass transitions in the differential scanning calorimetry heating.4 Further studies revealed phase separation upon annealing5,6 and the phase behaviour of the systems found to be dependent on derivatives and thermal history. There are several examples of optically active phenylpropanols as the pharmacophore in the biological active compounds or as the key intermediates to construct these interesting skeletons. Such as a marketed anti-cholesterolemia drug ezetimibe,7 the well known anti-depressant drug fluoxetine,8 2-substituted chroman derivatives of alpha-tocopherol (vitamin E) (pinostrobin and tephrowatsin E from natural sources),9 chemokine receptor modulators,10 proteinkinase inhibitors (useful for the treatment of neoplasms and viral infection)11 and antagonist (investigated to be safer anti-obesity agents).12 In the present study the FT- IR and FT-Raman and theoretical calculations of the wavenumbers of the title compound are reported.
Experimental
The FT-IR spectrum was recorded on a DR/Jasco FT-IR 6300 spectrometer and the FT- Raman spectrum was obtained on a BRUKER RFS 100/S, Germany. For excitation of the spectrum the emission of a Nd:YAG laser was used, excitation wavelength 1064 nm, maximal power 150 mW. One thousand scans were accumulated with a total registration time of about 30 min. The spectral resolution after apodization was 2 cm-1.
Computational Details
Calculations of the title compound were carried out with Gaussian03 software program13 using the B3LYP/6-31G* basis sets to predict the molecular structure and vibrational wavenumbers. The DFT hybrid B3LYP functional tends also to overestimate the fundamental modes; therefore scaling factors have to be used for obtaining a considerably better agreement with experimental data. Therefore, a scaling factor of 0.9613 was uniformly applied to the DFT calculated wavenumbers.14 The assignment of the calculated wavenumbers is aided by the animation option of MOLEKEL program, which gives a visual presentation of the vibrational modes.15,16
Figure 1:
 Click on image to enlarge |
Results And Discussion
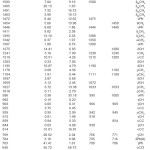
The observed IR, Raman and calculated (scaled) wavenumbers and the assignments are given in Table 1. In aromatic compounds the asymmetric stretching vibrations of CH3 are expected17,18 in the range 2950-3050 cm-1 and symmetric CH3 vibrations in the range of 2860-3000 cm-1. The first of these results from the asymmetric stretching uasCH3 mode in which two C-H bonds of the methyl group are extending while the third one is contracting. The second arises from the symmetrical stretching usCH3 in which all three of the C-H bonds extend and contract in phase. The asymmetric stretching modes of the methyl group are calculated (DFT) to be 3067, 3028, 3022, 3014 cm-1 and the symmetric mode at 3006, 2942 cm-1. The bands observed at 3061, 3026, 2970 cm-1 in the IR spectrum and 3069, 2948 cm-1 in the Raman spectrum are assigned as stretching modes of the methyl group. Two bending can occur within a methyl group. The first of these, the symmetrical bending vibration, involves the in-phase bending of the C-H bonds. The second, the asymmetrical bending vibration, involves out-of-phase bending of the C-H bonds. The asymmetrical deformations are expected in the range17 1400-1485 cm-1. The calculated values (DFT) of dasCH3 modes are at 1503, 1495, 1491, 1483 cm-1. In many molecules, the symmetric deformations dsCH3 appears with an intensity varying from medium to strong and expected in the range17 1380 ± 25 cm-1. The DFT calculations give δasCH3 mode at 1411 and 1393 cm-1. Aromatic molecules display a methyl rock17 in the neighborhood 1045 cm-1. The second rock17 in the region 970±70 cm-1 is more difficult to find among the C-H out-of-plane deformations. In the present case, these rCH3 modes are calculated at 1178, 1104, 1027 and 1018 cm-1. The bands observed at 1111, 1033 cm-1 in the IR spectrum and at 1182, 1108, 1033 cm-1 in the Raman spectrum are assigned as rocking modes of the methyl group. The methyl torsions often assigned in the region17 185 ± 65 cm-1.
The vibrations of the CH2 group (the asymmetric stretch uasCH2, symmetric stretch usCH2, scissoring vibrations δCH2 and the wagging vibration ωCH2) appears in the regions 2980 ± 20, 2885 ± 45, 1440 ± 30 and 1340 ± 25 cm-1, respectively17, 18. These bands are observed at 1350 cm-1 in the IR spectrum, 2936, 1458 cm-1 in the Raman spectrum and at 3011, 2935, 1454, 1342 cm-1 theoretically for the title compound.The twisting and rocking modes of the CH2 group appear in the regions17 1260 ± 10 and 880 ± 25 cm-1. The twisting mode is observed at 1238 in the IR spectrum, 1245 in the Raman spectrum and at 1241 theoretically. Rocking mode is assigned at 939 theoretically and experimentally at 942 (IR), 945 (Raman).
For mono-substituted benzene derivatives, the CH stretching modes are expected in the region17 3105-3000 cm-1. There are five CH stretching modes for mono substituted benzenes. The calculated (DFT) values are 3114, 3098, 3088, 3084, 3074 cm-1. Experimentally, one band is observed in the IR spectrum at 3090 cm-1 as C-H stretching mode of the benzene ring. The benzene ring possesses six ring stretching vibrations, of which the four with the highest wavenumbers (occurring respectively near 1600, 1580, 1490 and 1440 cm-1) are good group vibrations.17 In the absence of ring conjugation, the band near 1580 cm-1 is usually weaker than that at 1600 cm-1. The fifth ring stretching vibration õPh is active near 1335 ± 35 cm-1, a region which overlaps strongly with that of the CH in-plane deformation and the intensity is in general, low or medium high.17, 19 The sixth ring stretching vibration or ring breathing mode appears as a weak band near 1000 cm-1 in mono substituted benzenes.17 The bands observed at 1601, 1582, 1475, 1444, 1300 cm-1 in the IR spectrum and at 1606, 1570, 1440 cm-1 in the Raman spectrum are assigned as uPh ring stretching modes. As seen from the Table 1, the DFT calculations give these modes at 1595, 1575, 1472, 1446, 1307 cm-1. These vibrations are expected in the region17 1620-1300 cm-1. For the title compound the ring breathing mode is assigned at 996 cm-1 theoretically and the bands observed at 995 cm-1 in IR and at 1005 cm-1 in Raman are assigned as this mode. The in-plane CH deformation bands of the phenyl ring are expected17 above 1000 cm-1. In the present case the bands observed at 1190, 1072 cm-1 in the IR spectrum and at 1280 cm-1 in the Raman spectrum and 1275, 1203, 1195, 1097, 1069 cm-1 (DFT) are assigned as gCH modes of the phenyl ring. The out-of-plane CH deformations dCH modes are expected in the region17 1000-730 cm-1. Generally, the CH out-of-plane deformations with the highest wavenumbers have a weaker intensity than those absorbing at lower wavenumbers. The stronger gCH band occurring in the region 775 ± 45 cm-1 tends to shift to lower (higher) wavenumbers with increasing electron donating (attracting) power of the substituent, but seems to be more sensitive to mechanical interaction effects. The bands at 966, 918, 838, 766 cm-1 in the IR and at 969, 771 cm-1 in the Raman spectrum are assigned as the out-of- plane CH modes of the phenyl ring. The DFT calculations give ãCH modes at 992, 963, 913, 844, 769 cm-1. The out-of-plane CH deformation ãCH at 766 cm-1 and the out-of-plane ring deformation gPh at 700 cm-1 in the IR spectrum form a pair of strong bands characteristics of mono substituted benzene derivatives.17, 20 The other substituent sensitive modes are also identified (Table 1). For the title compound, the band at 649 cm-1 (DFT) is assigned as gCCl mode. The C-C stretching modes are assigned at 1219, 955, 859, 814 cm-1 theoretically as expected.17
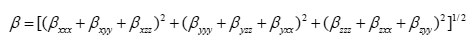
Using the x, y and z components, the magnitude of the dynamic first hyperpolarizability can be calculated by
![]()
The complete equation for calculating the magnitude of the dynamic first hyperpolarizability from the Gaussian03 output is given as follows.21
To calculate the dynamic first hyperpolarizability, the origin of the Cartesian coordinate system was chosen as the centre of mass of the compound. The calculated first hyperpolarizability of the title compound in an electric field of value 0.001 au is 1.56 ´ 10-30 esu.. We conclude that the title compound is an attractive object for future studies of non linear optical properties.
Table 1: Vibrational assignments of 1-chloro-2-methyl-2-phenylpropane
 Click on image to enlarge |
Conclusion
FTIR and FT-Raman spectrum of 1-chloro- 2-methyl-2-phenylpropane were recorded and analyzed. The vibrational wavenumbers were examined theoretically using the Gaussian03 set of quantum chemistry codes. The experimental frequencies are in agreement with the calculated (B3LYP) scaled values. The predicted infrared intensities, Raman activities and first hyperpolarizability are reported. The small differences between experimental and calculated vibrational modes are observed. It must be due to the fact that hydrogen bond vibrations present in the crystal lead to strong perturbation of the infrared wavenumbers and intensities of many other modes. Also we state that the experimental results belong to solid phase and theoretical calculations belong to gaseous phase.
References
- Tang, R.Y.W, Gonzalez, J.B., Roberts, G.D.,J. Dent. Res. 54: 1039 (1975).
CrossRef - Dauban, P., Ferry, S., Faure, H., Ruat, M., Dodd, R.H., Bioorg. Med. Chem. Lett. 10: 2001 (2000).
CrossRef - Foldes, E., Fekete, E., Karasz, F.E., Pukanszky, B., Polymer 41: 975 (2000).
CrossRef - Leung, L., Williams, D.J., Karasz, F.E., MacKnight, W.J., Polym. Bull. 16: 457 (1986).
CrossRef - Choe, S., Williams, D.J., MacKnight, W.J., Karasz, F.E., Polym. Mater. Sci. Engng. 36: 827 (1987).
CrossRef - Choe, S., MacKnight, W.J., Karasz, F.E., Polyimidies, Materials, chemistry and characterization, Amsterdam, Elsevier (1989).
- Xu, X., Fu, R., Chen, J., Bai, X., Bioorg. Med. Chem. Lett. 17: 101 (2007).
CrossRef - Corey, E.J., Reichard, G.A., Tetrahedron Lett.30: 5207 (1989).
CrossRef - Hodgetts, K.J., Tetrahedron 61: 6860 (2005).
CrossRef - Faull, A., Tucker, H., Patent: WO2006001752, Jan. 5, 2006.
- Barda, D.A., Henry, K.J.J., Joseph, S., Lin, H.S., Richett, M.E., Patent. W2005054202, June, 16, 2005.
- Howell, L.L., Czoty, P.W., Byrd, L.D.,Psychopharmacology 13: 132 (1997).
- Frisch, M.J., et al., Gaussian 03, Revision C.02 Gaussian, Inc., Wallingford CT (2004).
- Foresman, J.B., in: Frisch, E.,(Ed.), Exploring Chemistry with Electronic Structure Methods: A Guide to Using Gaussian”, Pittsburg, PA (1996).
- Flukiger, P., Luthi, H.P., Portmann, S., Weber, J., MOLEKEL 4.3, Swiss Centre for Scientific Computing, Manno, Switzerland (2000- 2002).
- Portmann, S., Luthi, H.P. Chimia, 54: 766 (2000).
- Roeges, N.P.G., A Guide to the Complete Interpretation of Infrared Spectra of Organic Structures, Wiley, New York (1994).
- Colthup, N.B., Daly, L.H., Wiberly, S.E., Introduction to Infrared and Raman Spectroscopy, second ed., Academic Press, New York (1985).
- Varsanyi, G., Assignments of Vibrational Spectra of Seven Hundred Benzene Derivatives, Wiley, New York (1974).
- Higuchi, S., Tsuyama, H., Tanaka, S., Kamada, H., Spectrochim. Acta A, 30: 463 (1974).
CrossRef - Thanthiriwatte, K.S., Silva, K.M.N., J. Mol. Struct. Theochem. 617: 169 (2002).
CrossRef
Accepted on: 19 Mar 2012


![]()
![]()
![]()