Article Publishing History Article Received on : 22 Feb 22 Article Accepted on : 13 Apr 22 Article Published : 05 May 2022 Plagiarism Check: Yes Reviewed by: Dr. Guruswamy Swamy Second Review by: Dr. Chuah Lee Siang Final Approval by: Dr. Vijai Anand
Article Metrics
ABSTRACT:
This study was focused on evaluation of conducting and tensile properties of rGO/ Polybutylene adipate terephthalate (PBAT) nanocomposite intended to use in electronic applications which require biodegradability. This study was also considered to be worthwhile since very little work has been done in this regard so far. PBAT was specifically selected for the study as it is an extensively used biodegradable polymer for variety of applications. The solvent casting method was employed to prepare rGO/PBAT nanocomposites where rGO was dispersed in a solution of PBAT by ultrasonication followed by evaporation of the solvent components. Electrical conductivity (σ) of rGO/PBAT nanocomposites showed a percolation behavior as rGO content was increased from 0.5 % to 1.5 %(σ increased drastically with the increase of rGO content). The percolation threshold was approximately 0.0045, (i.e., 0.75 w/w % of rGO). The average critical exponent (t) related to the percolation theory was 1.49 ± 0.19 which is well within the expected range 1< t < 2. According to impedance studies, the electrical impedance of GO/PBAT composites decreased with the increasing rGO content, which agreed well with the behavior of the electrical conductivity investigated previously. The same equivalent circuit was shown by each composite except the values for constant phase element CPE and resistor R; the equivalent electrical circuit was a parallel combination of CPE and R. The dielectric analysis of the composites indicated that dielectric parameters ϵ”, ϵ’ and dissipation factor increased significantly with increasing rGO content. The tensile strength of the composites was better than that of neat PBAT up to 1.5 % of rGO loading and decreased on further increasing of rGO. However, their tensile strain at break decreased with increasing rGO content. The results indicated that PBAT/rGO polymer composite is promising candidate for various electronic applications.
KEYWORDS:
Conductivity; Nanocomposite; Percolation Threshold; polymer; PBAT; rGO
Copy the following to cite this article:
Nayanajith L. D. C, De-Silva R. C. L, Rosa S. R, Kottegoda I. R. M. Evaluation of Conducting and Tensile Properties of Reduced Graphene Oxide/ Polybutylene Adipate Terephthalate (rGO/PBAT) Nanocomposites. Mat. Sci. Res. India;19(1).
Copy the following to cite this URL:
Nayanajith L. D. C, De-Silva R. C. L, Rosa S. R, Kottegoda I. R. M. Evaluation of Conducting and Tensile Properties of Reduced Graphene Oxide/ Polybutylene Adipate Terephthalate (rGO/PBAT) Nanocomposites. Mat. Sci. Res. India;19(1). Available from: https://bit.ly/3ykVWSY
Introduction
Graphene-based materials that are graphene, graphene oxide (GO) and reduced graphene oxide (rGO) have received considerable attention due to their high potential for many practical applications including creation of new materials and innovative electronics. Mostly, graphene-based materials are used in applications in the form of composites with other materials such as polymers because they enhance properties of such materials significantly. Graphene-based polymer nanocomposites have attracted research interest as one of the emerging areas of polymer technology as they manifest much improved properties compared to those of the neat polymer. They have shown substantial influences in the fields such as electronics, automotive, environmental conservation, green energy, aerospace, and so on 1, 2. Moreover, graphene-based electrically conductive polymer nanocomposites have been identified as one of the versatile class of materials, so they are being explored for a wide range of applications 3. Since the graphene-based materials are electrically conductive as well as existing in the form of nanoparticles/sheets, non-conducting polymer materials can easily be made electrically conductive by incorporating a small amount of graphene or reduced graphene oxide (rGO) into the polymer matrix. However, electrical properties of rGO are hardly comparable to those of the pristine graphene as a result of defects in rGO its structure 4, but still, rGO manifests many advantages as well as potentials for variety of applications. Especially, mass production of rGO using chemical processes is much less costly compared to that of graphene and it can also exist in the forms of graphene, but with number of chemical functionalities, which can be harnessed as per the requirements of the particular application 5. Further, rGO has been attracting much attention as a component material in a variety of polymer composites intended for electrical applications such as batteries, electrodes and electromagnetic Interference (EMI) shielding 6,7,8. In addition, polymers can provide extensive advantages over other materials because in case of their light weight, ease of process ability and versatility of controlling conductivity. Also, polymers can easily be processed into desired shapes and do not require highly energy intense machinery as if metal processing requires. However, polymers are highly considered as one of the main polluters of environment due to their non-biodegradable nature. As a result, many types of biodegradable polymer with various characteristics have developed by present day such as polybutylene adipate terephthalate (PBAT), polylactic acid (PLA) and so on, which are commercially available too. Besides their eco-friendliness, they are also important in biomedical applications such as drug delivery systems, bone fixation devices, vascular grafts, gene delivery systems and tissue engineering as they are biocompatible while being biodegradable 9.
In the present work, PBAT was selected to prepare rGO composites as it is a totally biodegradable co-polyester which is synthesized by esterification of 1,4 butanediol with aromatic dicarboxylic acid followed by polycondensation with succinic acid 10. This polymer exhibits high elasticity, wear, fracture resistance and good compatibility with other polymers with similar characteristics such as polylactic acid (PLA) 11. However, it is poor in electrical and thermal conductivity and mechanical strength. Some studies have demonstrated that incorporation of nanofillers into PBAT can improve some of those drawbacks 12. Also, Feng et al. investigated the crystallization and creep of PBAT/ graphite nanosheets composites 13. The present study focuses on some of the conducting and mechanical properties of PBAT/rGO since very little study has been carried out on PBAT/rGO nanocomposites, especially on investigation of their electrical properties.
ExperimentalMaterials
Materials
Nano reduced graphene oxide was obtained from graphene oxide. 14,15 graphene oxide was prepared via the Hummers’ method 16. PBAT (Ecoflex®, density 1.26 gcm-3), was obtained from Polymer Packaging (Pvt.) Ltd. All other chemicals used are of analytical grade.
Preparation of nanocomposites
A
series of PBAT/rGO nanocomposites containing 0.5, 1.0, 1.5, 2.0, 2.5, 3.0 and
3.5 % of rGO was prepared using solvent casting approach in the following
manner;
2.50 g of PBAT and the required amount of rGO were added to a vessel made of polytetrafluoroethylene (PTFE) containing 50 mL of tetrahydrofuran (THF). The mixture was ultrasonicated at 40 kHz for 30 minutes and THF was removed by drying at 70 °C. The resulting nanocomposite was used to prepare the samples for characterizations.
Characterization
Chemical and structural characteristics of the prepared rGO/PBAT nanocomposites were
investigated using Bruker Tensor 27 FTIR spectrophotometer in the mid-IR
spectral range of 600 – 4000 cm-1.
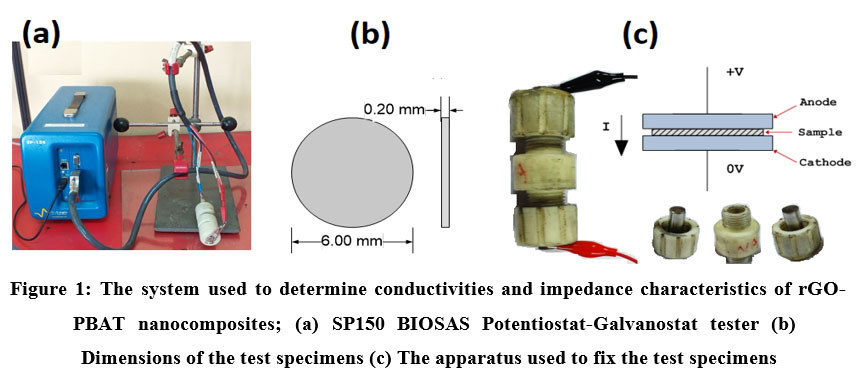
Their electrical conductivities (DC) were determined using the I-V mode of the SP150 BIOSAS Potentiostat-Galvanostat tester (refer to Figure 01a) for which the test specimens as schematized in Figure 01b were prepared by hot-pressing. The prepared specimens were fixed between the stainless steel (SS) plates of the fabricated device illustrated in Figure 01c and a programmed voltage from 0 V to 1V at the rate of 10 mV/s was applied to the test specimens through the SS plates.
Figure 1: The system used to determine conductivities and impedance characteristics of rGO-PBAT nanocomposites
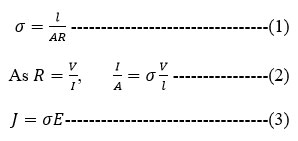
I-V data of the test specimens were used to determine the DC electrical conductivities (σ) of the nanocomposites. σ was calculated using the equation (3). DC electrical conductivity is defined as the rate of charge flow across unit area in a conductor per unit potential (voltage) gradient. σ can be expressed as
Where R, l and A are
resistance, thickness and surface area of the sample respectively, V is voltage and A is amount of current, J
is current density (I/A) and E is magnitude of electrical field (V/l).
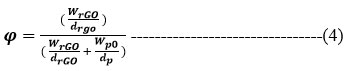
Electrical percolation of the nanocomposites was investigated graphically by plotting volume fraction of rGO in the nanocomposite (φ) vs electrical conductivity. φ was calculated using equation (4)
Where WrGO and Wp are weights of rGO and
PBAT respectively and drGO& dp represent their densities
respectively.
Impedance
spectroscopic analysis of the rGO/PBAT nanocomposites was carried out in
frequency range of 1MHz – 1mHz using the impedance mode of the same instrument
used to obtain I-V data. Using the Nyquist
plot of the nanocomposites, their bulk impedance and dielectric constant, electrical
energy dissipation, relaxation frequency and equivalent circuit were
determined.
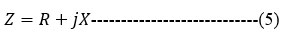
Impedance (Z) is defined as
where the real part of impedance is the resistance R and the imaginary part is the reactance X. the real component can be represented by
the imaginary part by
The phase angle φ can be expressed as
The dielectric constant (ϵ) is given by [17, 18]
The dissipation factor is given by
Where ∈’ , ∈” , ∈0 (8.854×10⁻¹² Fm-1) and f are real and imaginary parts of ∈ , vacuum permittivity and frequency of the AC current.
Tensile properties of the rGO/PBAT nanocomposites were determined as per ASTM D 638-14 standard using Tinius-Olsen HK10S universal tester at the jaw separation speed of 5 mm/min.
Results and Discussions
FTIR analysis
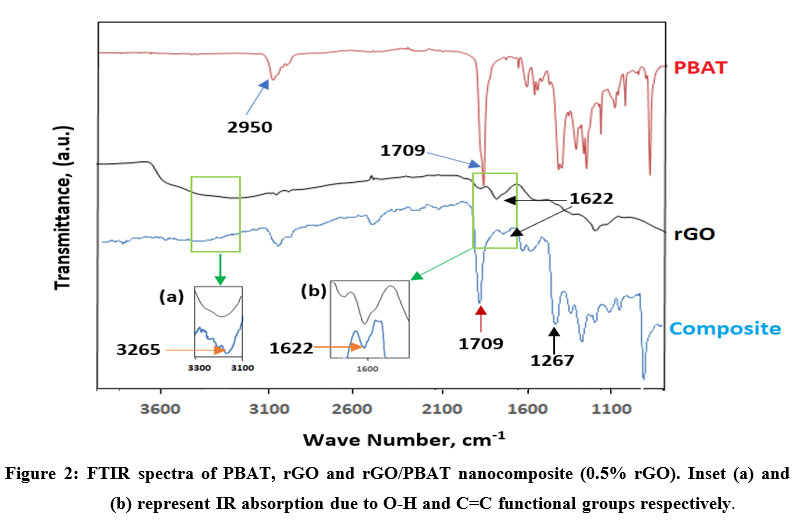
FTIR spectral analysis was performed to investigate the chemical structure of rGO/PBAT nanocomposites. Figure 02 shows the FTIR spectra of rGO/PBAT nanocomposites as well as those of the neat PBAT and rGO included for comparison. The FTIR spectra of rGO/PBAT showed characteristic peaks related to PBAT and rGO. The peaks appear at 2950, 1709 and 1267 cm-1 are the characteristic peaks of PBAT which correspond to stretching vibration of aliphatic C–H, C=O andC-O respectively 19. The spectral signatures at 3265 and 1622 cm-1 shown in the inseta and b are typical stretching vibration of O-H and C=C of rGO respectively 20. Hence, the FTIR spectral information confirms the formation of rGO/PBAT composite .
Figure 2: FTIR spectra of PBAT, rGO and rGO/PBAT nanocomposite (0.5% rGO). Inset (a) and (b) represent IR absorption due to O-H and C=C functional groups respectively.
Electrical conductivities of rGO/PBAT nanocomposites calculated from the equation (3) are in the Table 01. J and E values were obtained using the applied voltage DC (V) and the current (I) passing through the nanocomposite samples. The neat PBAT is an electrical insulator having an electrical conductivity value of approximately 1×10-13 Sm-121.
Table 1: Electrical conductivity data obtained from each nanocomposite prepared
Sample Type
Volume fraction, φ
Conductivity σ, Sm-1
GOPB-0.5
0.003
4.21×10⁻⁶ ± 5.82×10⁻⁷
GOPB-1.0
0.006
3.66×10⁻⁴ ± 3.78×10⁻⁵
GOPB-1.5
0.009
3.91×10⁻⁴ ± 7.27×10⁻⁵
GOPB-2.0
0.012
3.93×10⁻⁴ ± 6.30×10⁻⁶
GOPB-2.5
0.015
4.10×10⁻⁴ ± 5.31×10⁻⁵
GOPB-3.0
0.018
4.82×10⁻⁴ ± 7.89×10⁻⁵
GOPB-3.5
0.021
5.60×10⁻⁴ ± 7.50×10⁻⁵
rGO neat
1
5.97×10⁻¹ ± 1.33×10⁻¹
PBAT[1]
0
~ 1×10-13
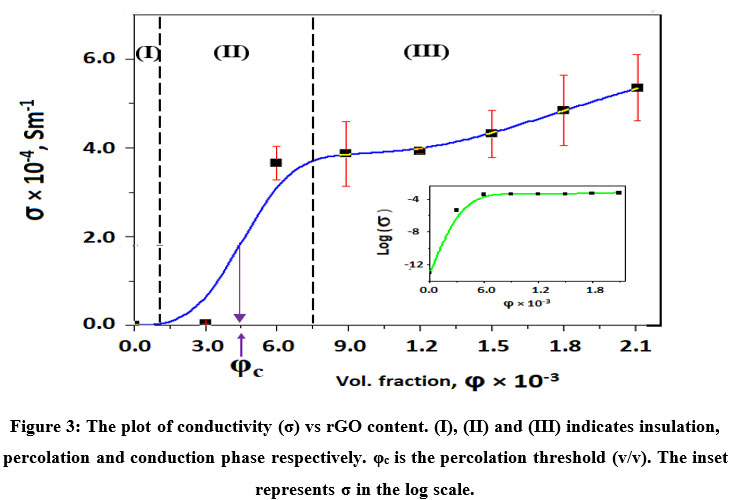
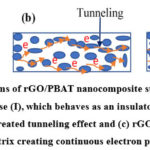
The plot ofσ vs φ (volume fraction) is shown in Figure 03. ϕ of rGO in each composite was calculated using the equation (4). The plot indicates three distinct phases labeled as (I), (II) and (III), in relation to σ of rGO/PBAT nanocomposites and φ. In the phase (I),( φ < 0.003), the electrical conductivity, was so small that it can hardly be determined with the measuring device used (Figure 01 a).In this stage, the electrical conductivity was assumed to be almost same as that of the neat PBAT matrix as rGO nanoparticles are scattered in the polymer matrix creating so wide gaps amongst them that inhibit the electron mobility through the composite as illustrated in the schematic diagram in Figure 04a. As φ is increased from 0.003 up to approximately 0.009, the σ increases drastically (~102 times) which is indicated by the phase (II) of the curve. This behavior of the electrical conductivity of the composite can be attributed to the tunneling effect 21 as illustrated schematically in Figure 04b. It is referred to as the electrical percolation. Electrical percolation in polymer nanocomposites deals with connectivity of conductive nanofiller particles within their network structure and the effects of this connectivity govern on the electrical properties of the composite. The electrical percolation model has been successfully applied to describe the electrical behavior of polymer nanocomposite systems that have a sharp insulator–conductor transition with increasing nanofiller fraction. It has been established both experimentally and theoretically that the electrical conductivity of polymer composites follows a power law dependence predicted by percolation theory for filler concentrations, ϕ, sufficiently close to the percolation threshold, ϕc which is given by the following equation (13) 3,22,23,24.
Where σ0 is a preexponential factor that depends on the conductivity of the fillers, their contact resistance, and the network topology. t is the critical exponent dependent on the connectivity of the system, which is usually found in the range of 1< t < 2 23, 4.
The percolation zone was estimated to be existing approximately between φ = 0.0015 and φ = 0.0075, hence, the percolation threshold, φc of rGO/PBAT nanocomposite was approximated to be 0.0045 which is nearly equal to 0.75 (w/w) % of rGO. The average critical exponent (t), was 1.49 ± 0.19, which was calculated using the equation (10). Therefore, the critical exponent is within the range (1< t < 2) which is typical of conductive fillers in polymer matrix [23, 25]. The only percolation threshold value found in previous similar studies with PBAT was 0.035 (6 % w/w) which was reported by Kashi, S. and et al. (2018) 21. However, the filler material used by them is graphene nanosheets (GNS) of which the conductive properties are hardly comparable with that of rGO.
As more rGO is added to the PBAT polymer matrix, large clusters of rGO are steadily formed. After reaching approximately 1.5 % of rGO (φ=0.009), the electrical conductivity of the composite increased gradually as shown by Phase III. This can be ascribed to the formation of a well-established network of rGO nanoparticles within the PBAT matrix, which results in creation of continuous electron conducting paths 22 as schematically illustrated in Figure 04c.
Figure 3: The plot of conductivity (σ) vs rGO content. (I), (II) and (III) indicates insulation, percolation and conduction phase respectively. φc is the percolation threshold (v/v). The inset represents σ in the log scale.
Figure 4: Schematic diagrams of rGO/PBAT nanocomposite structures; (a) the suggested structure existing in the phase (I), which behaves as an insulator, (b) rGO/PBAT structure at the phase (II) that has created tunneling effect
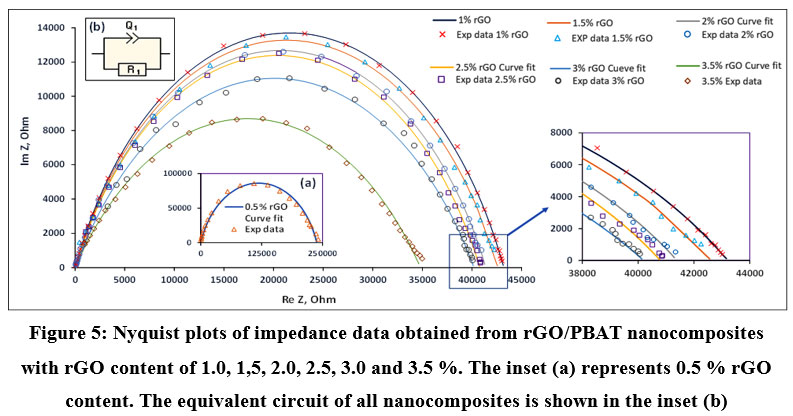
The electrical properties of each rGO/PBAT nanocomposite were further investigated with impedance spectroscopy measurements (Nyquist plots). The obtained Nyquist plots of the nanocomposites with varied contents of rGO from 0.5 % to 3.5 % and the curve fits are shown in Figure 05 where the lines represent the curve fits and the makers indicate experimental data. The equivalent electrical circuits of all composites, shown in the inset (b), were a parallel combination of constant phase elements (CPE) and resistors (R1) of which the values are given in Table 02.
Figure 5: Nyquist plots of impedance data obtained from rGO/PBAT nanocomposites with rGO content of 1.0, 1,5, 2.0, 2.5, 3.0 and 3.5 %.
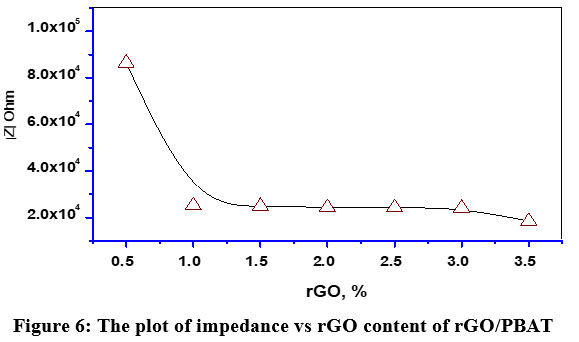
As per the impedance results, the impedance (|Z|) of the composites was reduced drastically from 86.34 to 25.16 Ω as rGO content was increased from 0.5 % to 1.0 % and subsequently the |Z| further decreased gradually with the increase of rGO content as shown in Figure 06. This can be attributed to the typical behavior of conducting fillers at the vicinity of the percolation threshold in polymer matrices 22. This phenomenon well agrees with the drastic increase observed in the DC electrical conductivity of the rGO/PBAT nanocomposites.
Figure 6: The plot of impedance vs rGO content of rGO/PBAT nanocomposites.
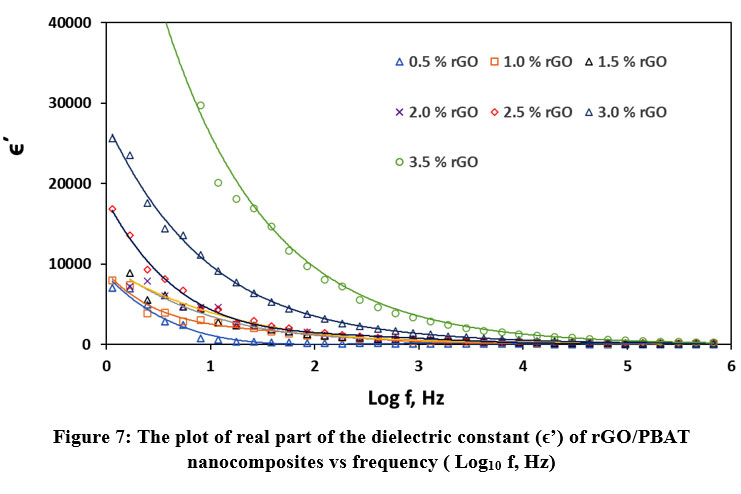
Dielectric data obtained from the rGO/PBAT nanocomposites were used to investigate frequency dependance of the dielectric constant (ϵ) and dielectric loss. The complex ϵ consists of a real part (ϵ’) and an imaginary part (ϵ”) according to the equation (8). Figure 07 shows the variation of the real part of the dielectric constant of all nanocomposites (0.5 % to 3.5 % rGO) with frequency at room temperature. At low frequencies (f < ~100 Hz), ϵ’ exhibited high values and decreased rapidly with the rise of frequency and eventually became constant at high frequencies. This phenomenon can be attributed to slow rate in changing the electric field at low frequencies, which allows the permanent and induced dipoles formed in the nanocomposites to align themselves well with respect to the applied electric field 26. This results in Maxwell Wagner Sillars effect (increase of effect interfacial polarization, IP with decrease of frequency) 27,28. IP occurs either at inner dielectric boundary layers on a mesoscopic scale and the formation of IP is caused by unbounded charges at the interfaces of the nanofillers, which are developed into large dipoles 29. As the frequency is increased, the formed dipole would not have adequate time to align themselves with the rapidly changing electric field. As a result, IP becomes insignificant (relaxation of polarization) which causes ɛ′ to become relatively very small 26. Moreover, at high frequencies micro-capacitor structures are formed within the composites and their effect becomes predominant contributing factor to ɛ′, thus, ɛ′ is no longer dependent on the frequency and its value becomes constant 28- 30 (refer to Figure 07-the plateau region of the curves).
Figure 7 : The plot of real part of the dielectric constant (ϵ’) of rGO/PBAT nanocomposites vs frequency ( Log10 f, Hz).
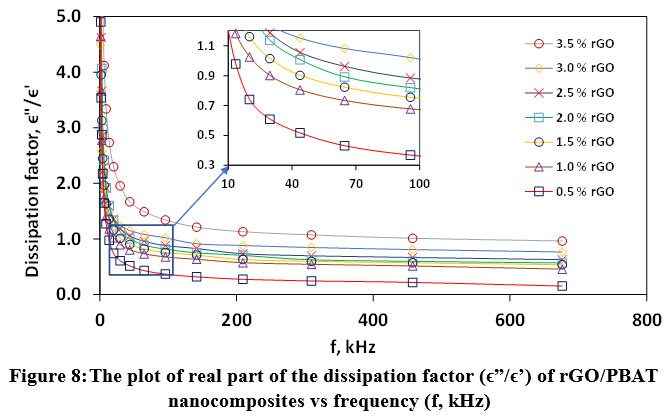
Energy dissipation and dielectric loss in the rGO/PBAT nanocomposites can be evaluated using dissipation factor, ϵ”/ϵ’ , (tan ϕ) and which can be calculated by using the equation (11), which is related to the amount of energy lost, or absorbed by the system 17. As shown Figure 08, the dissipation factor of all rGO/PBAT nanocomposites decreases as the frequency is increased. This is mainly because in the presence of an electric field, rGO nanosheets in the composites can generate electric current, part of which is dissipated as thermal energy 28. However, the dissipation factor increases with the increment of rGO content. This could be ascribed to the fact that interconnections of the rGO nanosheets in the composite become well established with the rise of rGO content, which results in increase of ɛ″ and ϵ”/ϵ’ 31,28. This fact agrees with percolation aspects of the rGO/PBAT nanocomposites as shown in Figure 03 and 04.
Figure 8 : The plot of real part of the dissipation factor (ϵ”/ϵ’) of rGO/PBAT nanocomposites vs frequency (f, kHz).
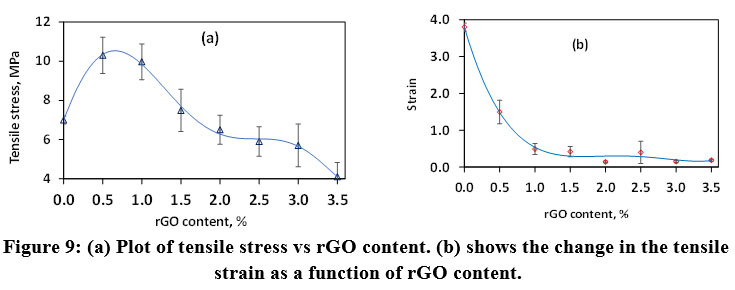
Analysis of tensile properties of the prepared rGO/PBAT nanocomposites were performed to evaluate the effect of rGO content on the tensile stress and strain of PBAT. The tensile test was carried at the jaw separation speed of 5 mm/min. at 23 ± 2 °C. The tensile strength of the composites with respect to that of the neat PBAT (represents the value at the intercept of Y-axis) increased initially as the rGO content was increased from 0 % to 0.5 % after which it decreased dramatically with the increment of rGO content (refer to Figure 09a). Its initial increase may be ascribed to a formation of good interfacial adhesion between the rGO and the polymer molecules at low concentrations of rGO and to the intrinsic high tensile modulus of rGO 32. Its subsequent decrease of the tensile strength may be attributed to rGO in high concentrations being incompatible with the PBAT polymer chains. Yet, higher values of tensile strength than that of the neat PBAT are shown by the composites with rGO content from 0.5 % to 1.5 %, which might be because rGO content of those composites is in the percolation zone where the interconnections between rGO nanosheets are being formed. However, as shown in Figure 09b, the tensile strain of the composites was observed to be decreasing from the beginning with respect to the neat PBAT. This particular behavior of the RGO/PBAT nanocomposites could be due to the fact that the intrinsic tensile strain of rGO is much lower than that of PBAT 33.
Figure 9: (a) Plot of tensile stress vs rGO content. (b) shows the change in the tensile strain as a function of rGO content.
rGO/PBAT nanocomposites pose significantly enhanced electrical conductivities compared to the neat PBAT (~1×10-13 Sm-1). They show a percolation behavior with rGO content from 0 % to 1.5 % with the percolation threshold of 0.0045 at which rGO content is approximately 0.75 %. At the rGO content of 1.5 %, the electrical conductivity of the composite (3.91×10⁻⁴ Sm-1) is enhanced by approximately 109 times compared to that of the neat polymer. comprehensive understand of the percolation threshold is extremely important in preparation of semi-conductive or conductive polymer matrices using insulating polymers and conductive fillers for conducting applications because polymer matrices infused with conductive fillers start to conduct electricity after the filler level exceeds the electrical percolation threshold. According to impedance analysis, all composites show the same equivalent electrical circuits, which is a parallel combination of CPE and R. However, the values of CPE and R vary with rGO content. Also, the impedance values of the rGO/PBAT nanocomposites well agree with the DC electrical conductivity. Results of dielectric measurement of the composites reveal that increment of rGO content significantly increases dielectric parameters which are ϵ”, ϵ’ and dissipation factor. These improvements could be a promising factor in view of practical applications such as dielectrically embedded capacitors. The tensile strength of rGO/PBAT nanocomposites increases up to rGO loading of 0.5 % and remains it above that of the neat PBAT up to 1.5 % rGO loading. However, the tensile strain simultaneously decreases with increase of rGO concentration in the composite. the initiative made in this study to use rGO biodegradable polymer nanocomposite for conducting applications would be an immense benefit for future products concerning environmental pollution such as disposable electronic. Not only the properties evaluated in this study, but also some other important properties, such as processability and biodegradability of the rGO/PBAT nanocomposites are required to be investigated closely since they are the main concerns at event of utilization of the composites in practical applications and waste disposal at the end of their lifetime.
Acknowledgement
We, the authors, acknowledge the
staff of Industrial Technology Institute (ITI), National Research Council (NRC)
of Sri Lanka and University of Colombo for providing grants, facilities and
guidance to make the present research work successful.
Conflict
of Interest
We,
the authors, declare that we have no known competing financial interests or
personal relationships that could have appeared to influence the work reported
in this paper.
Funding
Source
The financial assistance provided by Industrial Technology Institute Treasury, Grant: No. TG-11/00/04 and the National Research Council (NRC) of Sri Lanka. Grant No: 12-022.
References
Müller, K. and et al, “Review on the Processing and Properties of Polymer Nanocomposites and Nanocoatings and Their Applications in the Packaging, Automotive and Solar Energy Fields,” Nanomaterials, vol. 7, no. 4, p. 74, 2017. CrossRef
Oliveira D. and et al., “Polymer Nanocomposites with Different Types of Nanofiller, Nanocomposites – Recent Evolutions,” Intechopen, 2018 .
Mutiso, R.M. and Winey K.I., “Electrical Conductivity of Polymer Nanocomposites,” in Polymer Science: A Comprehensive Reference, Elsevier, pp. 327-344, 2012. CrossRef
Stankovich, S. and et al, “Synthesis of graphene-based nanosheets via chemical reduction of exfoliated graphite oxide,” Carbon, vol. 45, pp. 1558-1565, 2007. CrossRef
Park, W. and et al, “Electrical and thermal conductivities of reduced graphene oxide/polystyrene composites,” Applied Physics Letters, vol. 104, p. 113101, 2014. CrossRef
Zhu, X. and et al, ” Nanostructured Reduced Graphene Oxide/Fe2O3 Composite as a High-Performance Anode Material for Lithium Ion Batteries,” ACS Nano, vol. 5, pp. 3333-3338, 2011. CrossRef
Kholmanov, I.N. and et al, “Reduced Graphene Oxide/Copper Nanowire Hybrid Films as High-Performance Transparent Electrodes,” ACS Nano , vol. 7, pp. 1811-1816, 2013. CrossRef
Kim, S. and et al, “Electromagnetic Interference (EMI) Transparent Shielding of Reduced Graphene Oxide (RGO) Interleaved Structure Fabricated by Electrophoretic Deposition,” ACS Appl. Mater. Interfaces, vol. 6, no. 20, pp. 17647-17653, 2014. CrossRef
Guo, B., Glavas, L. and Albertsson, A. C. , “. Biodegradable and electrically conducting polymers for biomedical applications,” Progress in Polymer Science, vol. 38, no. 9, pp. 1263-1286, 2013. CrossRef
Hong, S. Y., Ko, S. W. and et al, ” Multi-Walled Carbon Nanotube/Biodegradable Poly(butyleneadipate-co-butyleneterephthalate) Nanocomposites and Their Physical Characteristics, Journal of Macromolecular Science,” Journal of Macromolecular Science, vol. 51, no. 1, pp. 125-133, 2012. CrossRef
Yeh, J.T. and et al, “Compatible and crystallization properties of poly(lactic acid)/poly(butylene adipate-co-terephthalate) blends,” Journal of Applied Polymer Science, vol. 116, no. 2, pp. 680-687, 2009. CrossRef
Mittal, V. and et al., “Biopolymer – Thermally reduced graphene nanocomposites: Structural characterization and properties,” Materials Chemistry and Physics, vol. 147, no. 1, pp. 319-332, 2014. CrossRef
Feng, S. and et al, ” Crystallization and creep of the graphite nanosheets based poly (butylene adipate-co-terephthalate,” Thermochimica Acta, vol. 587, pp. 72-80, 2014. CrossRef
Kottegoda, I.R.M., Gao, X., Nayanajith, L.C.D., Manorathne, C.H., J-Z. Wang J.Z.,Liu, H-K. and Yossi Gosef, “Comparison of Few-layer Graphene Prepared from Natural Graphite through Fast Synthesis Approach,” Comparison of Few-layer Graphene Prepared from Natural Graphite through Fast Synthesis Approach. Iresha R. M. Kottegoda, X. Gao, L. J. Material Science & Technol, vol. 31, pp. 907-912, 2015. CrossRef
Perera, D. S. M., De Silva, R. C. L., Nayanajith, L. D. C. and et al, “Anti-Inflammatory and Antioxidant Properties of Coffea Arabica/Reduced Graphene Oxide Nanocomposite Prepared by Green Synthesis,” Material Sci. Research, vol. 18, no. 3, pp. 305-317, 2021. CrossRef
Hummers, W. S. and Offeman, R. E. J. P., “Preparation of Graphitic Oxide,” Am. Chem. Soc., vol. 80, p. 1139, 1958. CrossRef
Hunter Woodward, W. H., “Chapter -1 A Practical Guide,” in Broadband Dielectric Spectroscopy: A Modern Analytical Technique, Michigan, The Dow Chemical Company, pp. 3-59, 2021. CrossRef
Macdonald , J.R. and Barsoukov, E., “Elementary Analysis of Impedance Spectra,” in Impedance Spectroscopy, New Jersey, John Wiley & Sons, pp. 13-14. 2005.
Siyamak, S. and et al, ” Effect of Fiber Esterification on Fundamental Properties of Oil Palm Empty Fruit Bunch Fiber/Poly(butylene adipate-co-terephthalate) Biocomposites,” Int. J. Mol. Sci., vol. 13, pp. 1327-1346, 2012. CrossRef
Shah, A.U.H.A., Ullah, S., Bilal, S., Rahman, G. and Seema, H., ” Reduced Graphene Oxide/Poly(Pyrrole-co-Thiophene) Hybrid Composite Materials: Synthesis, Characterization, and Supercapacitive Properties,” Polymers, vol. 12, p. 1110, 2020. CrossRef
Kashi, S., Gupta, R. K., Kao, N., Hadigheh, S., and Bhattacharya, S. , ” Influence of graphene nanoplatelet incorporation and dispersion state on thermal, mechanical and electrical properties of biodegradable matrices,” Journal of Materials Science, vol. 34, no. 6, pp. 1026-1034, 2018. CrossRef
Alamusi, A., Ning, H. and et al , “Piezoresistive Strain Sensors Made from Carbon Nanotubes Based Polymer Nanocomposites,” Sensors, vol. 11, pp. 10691-10723, 2011. CrossRef
Bessaguet, E. and et al, ” Electrical behavior of a graphene/PEKK and carbon black/PEKK nanocomposites in the vicinity of the percolation threshold, Journal of Non-Crystalline Solids,” Journal of Non-Crystalline Solids, vol. 512, pp. 1-6, 2019. CrossRef
He, L. and Tjong, S.C. , “Low percolation threshold of graphene/polymer composites prepared by solvothermal reduction of graphene oxide in the polymer solution,” Nanoscale Res Lett , vol. 8, p. 132, 2013. CrossRef
Stankovich, S. and et al , “Stable aqueous dispersions of graphitic nanoplatelets via the reduction of exfoliated graphite oxide in the presence of poly(sodium 4-styrenesulfonate),” J. Mater. Chem. , vol. 16, p. 155, 2006. CrossRef
Tantis, I., Psarras, G.C. and Tasis, D., “Functionalized graphene – poly(vinyl alcohol) nanocomposites: Physical and dielectric properties,” eXPRESS Polymer Letters, vol. 6, no. 4, pp. 283-292, 2012. CrossRef
Wagner, K.W., “Explanation of the dielectric after-effects on the basis of Maxwell’s ideas,” Archiv f. Elektrotechnik, vol. 2, pp. 371-387, 1914. CrossRef
Ishaq,S., Kanwal, F. Atiq, S., Moussa, M., Azhar, U., Gul, I. and Losic, D., “Dielectric and impedance spectroscopic studies of three phase graphene/titania/poly(vinyl alcohol) nanocomposite films,” Results in Physics, vol. 11, pp. 540-548, 2018. CrossRef
Kalini A., Gatos, K. G., Karahaliou, P. K., Georga S. N.,Krontiras, C. A. and Psarras, G. C., “Probing the dielectric response of polyurethane/alumina nanocomposites,” Journal of Polymer Science Part B: Polymer Physics, vol. 48, pp. 2346-2354, 2010. CrossRef
Song, S., Xia, S., Wei, Y. and et al., “Fluoro-polymer-coated carbon nanotubes for improved interfacial interactions and dielectric properties in MWCNTs/PVDF composites,” J Mater Sci., vol. 55, pp. 3212-3227, 2020. CrossRef
Ping, F., Lei, W., Jintao, Y,. Feng, C. and Mingqiang, Z., “Graphene/poly(vinylidene fluoride) composites with high dielectric constant and low percolation threshold,” Nanotechnology, vol. 23, no. 36, p. 365702, 2012. CrossRef
Olowojoba, G.B and et al, “In situ thermally reduced graphene oxide/epoxy composites: thermal and mechanical properties,” Appl Nanosci, vol. 6, pp. 1015-1022, 2016. CrossRef
Khoei, A. R. and Khorrami, M. S., ” Mechanical properties of graphene oxide,” Fullerenes, Nanotubes and Carbon Nanostructures, vol. 24, no. 9, pp. 594-603, 2016. CrossRef

 , R. C. L. De Silva1